

Abstract
Known genetic susceptibility loci for type 2 diabetes (T2D) explain only a small proportion of heritable T2D risk. We hypothesize that DNA methylation patterns may contribute to variation in diabetes-related risk factors, and this epigenetic variation across the genome can contribute to the missing heritability in T2D and related metabolic traits. We conducted an epigenome-wide association study for fasting glucose, insulin, and homeostasis model assessment of insulin resistance (HOMA-IR) among 837 nondiabetic participants in the Genetics of Lipid Lowering Drugs and Diet Network study, divided into discovery (N = 544) and replication (N = 293) stages. Cytosine guanine dinucleotide (CpG) methylation at ∼470,000 CpG sites was assayed in CD4+ T cells using the Illumina Infinium HumanMethylation 450 Beadchip. We fit a mixed model with the methylation status of each CpG as the dependent variable, adjusting for age, sex, study site, and T-cell purity as fixed-effects and family structure as a random-effect. A Bonferroni corrected P value of 1.1 × 10⁻⁷ was considered significant in the discovery stage. Significant associations were tested in the replication stage using identical models. Methylation of a CpG site in ABCG1 on chromosome 21 was significantly associated with insulin (P = 1.83 × 10⁻⁷) and HOMA-IR (P = 1.60 × 10⁻⁹). Another site in the same gene was significant for HOMA-IR and of borderline significance for insulin (P = 1.29 × 10⁻⁷ and P = 3.36 × 10⁻⁶, respectively). Associations with the top two signals replicated for insulin and HOMA-IR (P = 5.75 × 10⁻³ and P = 3.35 × 10⁻², respectively). Our findings suggest that methylation of a CpG site within ABCG1 is associated with fasting insulin and merits further evaluation as a novel disease risk marker.
Candidate gene and genome-wide association studies (GWAS) have identified a number of sequence variants that explain some of the interindividual variation in the susceptibility for type 2 diabetes (T2D) (1,2). However, a large component of heritable T2D risk remains poorly understood, with less than half of total genetic variation explained by known single nucleotide polymorphisms (SNPs), a problem known as missing heritability (3–6). T2D is a complex and heterogeneous disease, in which disease onset and development are dependent on interactions between different genetic and environmental factors (7). Epigenetic variation, whether intrinsic or altered by environmental exposure, contributes to variation in gene expression and risk for metabolic disease (8). Furthermore, Liu et al. (9) and others (10,11) have suggested that genetic and epigenetic modifications could interact biologically and that methylation analysis might uncover heritable genetic variants contributing to disease that are difficult to tease out of conventional GWAS results. Ultimately, T2D susceptibility in humans is likely to depend on both genetic and epigenetic mechanisms (8,12–14).
Studies of diabetes-related traits (e.g., fasting glucose and fasting insulin) in healthy individuals have been shown to be a fruitful approach for identifying T2D risk loci (15). Hence, for the current analysis, we examined epigenome-wide methylation associations (EWAS) for fasting glucose, insulin, and homeostasis model assessment of insulin resistance (HOMA-IR) in nondiabetic subjects from the Genetics of Lipid Lowering Drugs and Diet Network Study (GOLDN). We were also interested in the role of SNP variation in significant EWAS regions. Additionally, as previous studies have identified correlations between genetic variation and the quantitative trait of DNA methylation enriched at nearby loci (cis-meQTLs) (15), we integrated regional GWAS data with significant epigenetic findings for a uniquely comprehensive analysis of variation in metabolic traits.
Research Design and Methods
Study Population
GOLDN, described in detail in prior publications (16–18), recruited families with at least two siblings from the participants of the National Heart, Lung, and Blood Institute Family Heart Study in Minneapolis, MN, and Salt Lake City, UT. The trial aimed to identify genetic factors that mediated response to lipid-raising (i.e., postprandial lipemia challenge) or lipid-lowering (fenofibrate therapy) among metabolically healthy individuals. Participants were asked to discontinue the use of lipid-lowering agents for at least 4 weeks, to fast for at least 8 h, and to abstain from alcohol for at least 24 h prior to study visits. The study protocol was approved by the Institutional Review Boards at the University of Minnesota, University of Utah, Tufts University/New England Medical Center, and the University of Alabama at Birmingham, and written informed consent was obtained from all participants. For the current study, we evaluated diabetes-related traits (glucose, insulin, and HOMA-IR) among 837 GOLDN participants without physician-diagnosed or -treated diabetes and available EWAS data. We used a split sample approach to set up internal replication in which N = 544 participants were included in the discovery stage and 293 were included in the replication stage.
Data Collection
Measurement of T2D-Related Traits
Briefly, blood samples were drawn after an overnight fast. Plasma glucose was determined by a hexokinase-mediated reaction on the Hitachi commercial kit (Roche Diagnostics). Plasma insulin was measured by a commercial kit using competitive radioimmunoassay (Linco Research, St. Charles, MO), with intralaboratory reliability of glucose and insulin measurements of 0.984 and 0.975, respectively. HOMA-IR was calculated as fasting glucose × fasting insulin/22.5 (19).
Epigenetic Phenotyping
CD4+ T cells were isolated from frozen buffy coat samples using positive selection by antigen-specific magnetic beads (Invitrogen, Carlsbad, CA). DNA was isolated from the CD4+ T cells using DNeasy kits (Qiagen, Venlo, the Netherlands) (20). We used the Infinium Human Methylation 450 array (Illumina, San Diego, CA) to quantify genome-wide DNA methylation, as described in further detail in a manuscript from our group (20). Briefly, prior to the standard manufacturer protocol steps of amplification, hybridization, and imaging steps, we treated 500 ng of each DNA sample with sodium bisulfite (Zymo Research, Irvine, CA). We used Illumina GenomeStudio software to estimate β scores, defined as the proportion of total signal from the methylation-specific probe or color channel, and detection P values, defined as the probability that the total intensity for a given probe falls within the background signal intensity. During the quality-control (QC) stage, we removed any β scores with an associated detection P value >0.01 and samples with >1.5% missing data points across ∼470,000 autosomal cytosine guanine dinucleotides (CpGs). Additionally, we excluded any CpG probes for which >10% of samples failed to yield adequate intensity (20). We normalized the filtered β scores using the ComBat package for R software (21). We performed the normalization on random subsets of 10,000 CpGs per run, in which each array of 12 samples was used as a batch. We separately normalized probes from the Infinium I and II chemistries and subsequently adjusted the β scores for Infinium II probes using the equation derived from fitting a second-order polynomial to the observed methylation values across all pairs of probes located <50 base pairs (BPs) apart (within-chemistry correlations >0.99), where one probe was Infinium I, and one was Infinium II (20). Finally, we eliminated any CpGs in which the probe sequence mapped either to a location that did not match the annotation file or to more than one locus. We identified such markers by realigning all probes (with unconverted Cs) to the human reference genome (20). After QC, we had data for 461,281 CpGs. Principal components based on the β scores of all autosomal CpGs passing QC were generated using the prcomp function in R (v2.12.1).
Genotyping
Detailed descriptions of DNA extraction and purification procedures as well as the genotyping approach are available in prior publications from our group (17,18). Briefly, we used a hybrid data set of 2,543,887 SNPs, of which 484,029 were typed using the Affymetrix Genome-Wide Human 6.0 Array (Affymetrix, Santa Clara, CA), and the rest were imputed using MaCH software (version 1.0.16; Ann Arbor, MI) with Human Genome Build 36 as a reference. Prior to imputation, we excluded SNPs if they were monomorphic, had a call rate of <96%, exhibited Mendelian errors, had a minor allele frequency of <1%, or failed the Hardy-Weinberg equilibrium test at the P value threshold of <10−6.
Statistical Methods
Baseline characteristics, including fasting glucose, insulin, and HOMA-IR levels, were compared between the discovery and replication data sets using t tests and χ2 tests for continuous and categorical variables, respectively. In the discovery stage, we modeled associations between methylation β score at each CpG and log-transformed measure of insulin, glucose, and HOMA-IR using linear mixed models adjusted for age, sex, study site, and the first four principal components generated to capture T-cell impurity as fixed-effects and pedigree as a random-effect using the lmekin function of the kinship package in R (22). We used the Bonferroni correction to adjust for multiple comparisons, with the genome-wide significance level of 1.1 × 10⁻⁷ (18). In the replication stage, we evaluated markers that reached statistical significance in the discovery set for association with the trait of interest.
Integration of EWAS and Existing SNP Data
For CpG sites that showed a statistically significant association in the discovery and replication data sets, we extracted GWAS SNPs within 20 kb. Regional SNPs were then tested for association with the phenotypic trait of interest, adjusting for age, sex, and center as fixed-effects and family as a random-effect. Similarly to other GWAS published in the GOLDN data, we did not adjust for substructure (18) due to the homogeneity of the study population. Next, regional SNPs were associated with the methylation β score at the significant CpG sites (cis-meQTL) adjusting for age, sex, study site, and the first four principal components for cell purity. Regional plots were assembled to evaluate a potential role of underlying SNP variation in highlighted EWAS regions.
Results
Demographic and Clinical Characteristics
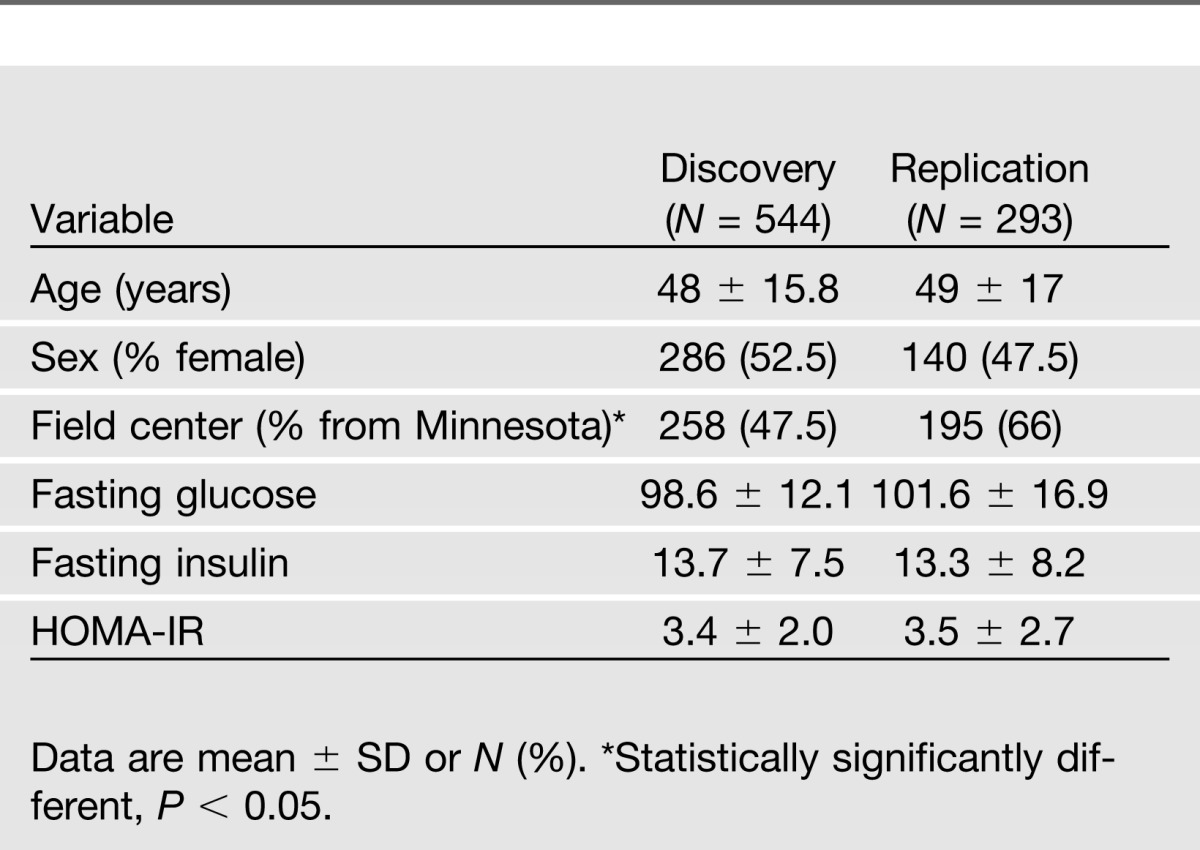
Table 1 summarizes the population characteristics for all 837 participants considered in this study. Discovery and replication data sets did not differ significantly with regards to levels of fasting glucose, fasting insulin, or HOMA-IR (P > 0.05 for all variables). In the discovery sample, the mean age of participants was 48 years; 52.5% of the participants were female, and less than half were recruited at the Minnesota center. The replication sample was demographically comparable except that a larger proportion of participants was recruited from the Minnesota field center. All participants were of self-reported European ancestry.
Table 1.
Characteristics of GOLDN participants
Discovery
Tables 2 and 3 show the top hits from the EWAS analyses for both insulin and HOMA-IR. Manhattan plots for the association of insulin and HOMA-IR with markers of methylation are shown in Figs. 1 and 2. In adjusted analyses, a CpG site in ABCG1 (CpG06500161) was significantly associated with insulin (P = 1.83 × 10⁻⁷). In addition, CpG06500161 was also significantly associated (P = 1.60 × 10⁻⁹) with HOMA-IR, while CpG1881899, also a CpG site in ABCG1, was marginally significant for that phenotype (P = 3.36 × 10⁻⁶). None of the CpG sites investigated was associated with fasting glucose after correction for multiple testing (data not shown).
Table 2.
Top 5 loci associated with fasting insulin in GOLDN participants without diabetes
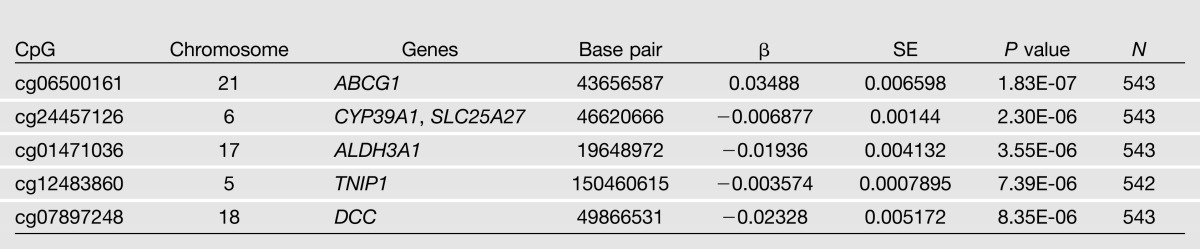
Table 3.
Top 5 loci associated with fasting HOMA-IR in GOLDN participants without diabetes
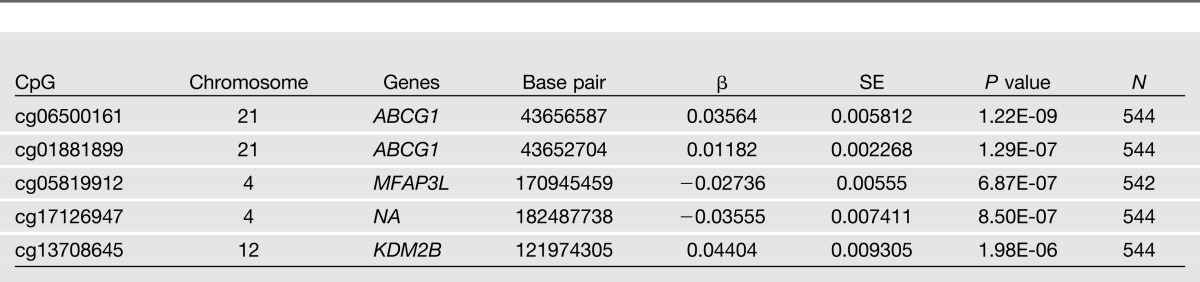
Figure 1.

Manhattan plot of epigenome-wide results testing for association between and the methylation status of fasting insulin. The x-axis displays the chromosome on which the CpG is located, and the y-axis displays −log10(P value). (A high-quality color representation of this figure is available in the online issue.)
Figure 2.

Manhattan plot of epigenome-wide results testing for association between and the methylation status of HOMA-IR. The x-axis displays the chromosome on which the CpG is located, and the y-axis displays −log10(P value). (A high-quality color representation of this figure is available in the online issue.)
Replication
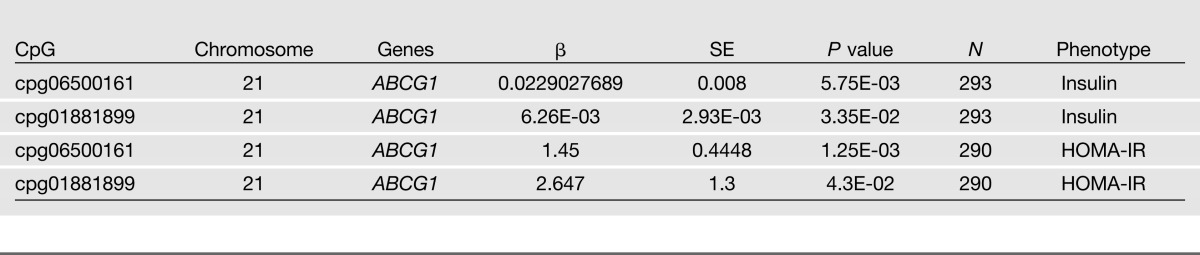
We replicated findings from our discovery set in a replication data set (N = 293) in which we removed prevalent patients with diabetes. Table 4 shows the replication of the top insulin CpG signal (CpG06500161), as well as a second insulin CpG signal that was marginally significant in the discovery set (CpG01881899) in ABCG1 (P = 5.75 × 10⁻³ and P = 3.35 × 10⁻², respectively). HOMA-IR replication analyses are also shown in Table 4 for both CpG signals on ABCG1 (CpG06500161, P = 1.3 × 10⁻³; and CpG01881899, P = 4.3 × 10⁻²).
Table 4.
Replication results for fasting insulin and HOMA-IR
Integration of Regional SNP and cis-meQTL Signals
Finally, we examined SNP-phenotype associations within 20 kb from CpG06500161 in ABCG1. We identified 37 regional SNPs in the region on chromosome 21 (i.e., 3638855 to 43676586, HG19 build), of which 14 were located 20 kb downstream of CpG06500161 and 23 located 20 kb upstream. The level of significance for cis-meQTLs ranged from P = 2.26 × 10⁻⁴ to P = 0.84. Level of significance for the same SNPs associated with insulin ranged from P = 1 × 10⁻² to P = 0.05. Fig. 3 demonstrates the regional overlap of the EWAS, cis-meQTL, and SNP association signals. Similarly, the same SNPs were associated with HOMA-IR with P = 1.3 × 10⁻³ to P = 0.95. The main CpG signal of interest was also plotted on the ABCG1 genomic region using ENCODE to visualize proximity of CpG06500161 to a CpG island, shore, or shelf (Fig. 4).
Figure 3.

Integrated regional overlap of EWAS, cis-meQTL, and GWAS signals. The x-axis displays the cis-meQTL and GWAS signals, 20 kb upstream and downstream from the EWAS signal of interest (CpG06500161); and the y-axis displays −log10(P value).
Figure 4.

ENCODE plot with fasting insulin EWAS signal CpG06500161. (A high-quality color representation of this figure is available in the online issue.)
Discussion
Our findings suggest that differential methylation of a CpG site within ABCG1 is associated with fasting insulin and HOMA-IR in GOLDN. Additionally, our results provide evidence in support of cross talk between genetic and epigenetic modifications in complex traits (6–8). Specifically, our data show that underlying SNP variation correlates with methylation of a CpG site in ABCG1 and is marginally associated with the metabolic traits of interest. This study highlights a novel epigenetic finding for diabetes-related traits and demonstrates an example of SNP variation tagging important functional variation.
The protein encoded by ABCG1 is a member of the superfamily of ATP-binding cassette (ABC) transporters. ABC proteins transport various molecules across extra- and intracellular membranes. More specifically, ABCG1 is involved in macrophage cholesterol and phospholipid transport and may regulate cellular lipid homeostasis in other cell types. Our results contribute to the body of evidence in support of the role of lipid metabolism, specifically of ABC transporters, in insulin resistance. In mice, Sturek et al. (23) have shown that ABCG1 regulates subcellular cholesterol distribution in β-cells, suggesting that islet ABCG1 expression may play a role in T2D pathogenesis and treatment. Others have also shown that ABCG1 expression and cholesterol efflux are reduced in patients with T2D and that this impaired ABCG1-mediated cholesterol efflux significantly correlates with increased intracellular cholesterol accumulation (24). ABCG1 has also been implicated in modulating islet inflammatory responses, indicating possible pleiotropic effects of ABC transporters in T2D etiology (25). Additionally, decreased function of ABC transporters has been associated with impaired insulin secretion (26). Therefore, our research adds considerable support to evidence linking ABCG1 to T2D and related traits and suggests that methylation-driven gene expression changes may mediate some of the observed effects.
Few genetics studies have investigated a role for ABCG1 in T2D, most with null findings. For instance, Schou et al. (27) showed that coding SNPs in ABCA1 and ABCG1 were not associated with T2D in the Copenhagen General Population Study of nearly 40,000 individuals. Recent GWAS have also reported negative findings with regard to ABCG1 and risk for T2D (15,28,29). However, previous analyses did not consider epigenetic modifications. Importantly, our findings suggest that not only is methylation variation in ABCG1 associated with both insulin and HOMA-IR, but also that underlying SNP variation may mediate some of the epigenetic effects. SNPs in the regions were marginally associated with our traits of interest, but not at a significance threshold that would have been picked up in GWAS, confirming the importance of expanding research in the field of T2D to epigenetics.
The results of this study must be interpreted in light of several limitations. First, CD4+ T cells were harvested from stored lymphocytes in which methylation could have been altered due to the freezing and thawing process. Further, this may have resulted in some contamination of CD4+ T cells with other cell types (e.g., CD15+ neutrophils and CD14+ monocytes). Still, CD4 T cells are a reasonable choice for global determination of CpG island methylation (30). CD4+ T cells were selected for three reasons. First, DNA methylation patterns are often tissue-specific (31). For instance, studies of whole-blood samples reflect methylation variations within each blood cell type that may act to confound genomic association results. Second, there is evidence that key genes involved in glucose metabolism are expressed in lymphocytes (e.g., GLUT1) (32). Therefore, we hypothesized this cell type should reflect underlying epigenetic variation influencing our key diabetes-related phenotypes, while minimizing potential confounding (33). Third, blood collection is the most viable tissue collection method among healthy individuals.
Finally, there were some differences in the discovery and replication populations within GOLDN due to the order in which samples were selected for processing. The split-sample design, however, did allow for increased design sensitivity, as well as decreased potential for confounding. Despite these limitations, however, one major strength of this study includes genome-wide epigenetic testing with a dense, genome-wide panel of CpG markers on a large sample of healthy adults and an internal replication data set.
In summary, we have identified two plausible methylation signals for T2D-related factors: insulin and HOMA-IR. The results of this integrated study implicate DNA methylation as an intermediary in T2D pathogenesis. In sum, this information contributes to the understanding of epigenetic and genetic mechanisms governing glycemic traits and ultimately the risk of T2D.
Article Information
Acknowledgments. The authors thank Steve Class for help with the figures.
Funding. This work was funded by National Heart, Lung, and Blood Institute grant U01-HL072524-04. B.H. was also funded by the National Heart, Lung, and Blood Institute, University of Alabama at Birmingham Statistical Genetics Postdoctoral Training Program, Grant 5T32-HL072757.
Duality of Interest. No potential conflicts of interest relevant to this article were reported.
Author Contributions. B.H. wrote the manuscript and researched and analyzed the data. M.R.I., S.A., H.K.T., and D.K.A. contributed to discussion and reviewed and edited the manuscript. J.S. assisted with data analysis. D.Z. contributed to discussion, reviewed and edited the manuscript, and assisted with data analysis. D.A., E.K.K., and J.M.O. reviewed and edited the manuscript. B.H. is the guarantor of this work and, as such, had full access to all the data in the study and takes responsibility for the integrity of the data and the accuracy of the data analysis.
Prior Presentation. This study was presented in poster form at the 73rd Scientific Sessions of the American Diabetes Association, Chicago, IL, 21–25 June 2013.
References
- 1.Manning AK, Hivert MF, Scott RA, et al. DIAbetes Genetics Replication And Meta-analysis (DIAGRAM) Consortium. Multiple Tissue Human Expression Resource (MUTHER) Consortium A genome-wide approach accounting for body mass index identifies genetic variants influencing fasting glycemic traits and insulin resistance. Nat Genet 2012;44:659–669 [DOI] [PMC free article] [PubMed] [Google Scholar]
- 2.Saxena R, Voight BF, Lyssenko V, et al. Diabetes Genetics Initiative of Broad Institute of Harvard and MIT, Lund University, and Novartis Institutes of BioMedical Research Genome-wide association analysis identifies loci for type 2 diabetes and triglyceride levels. Science 2007;316:1331–1336 [DOI] [PubMed] [Google Scholar]
- 3.Manolio TA, Collins FS, Cox NJ, et al. Finding the missing heritability of complex diseases. Nature 2009;461:747–753 [DOI] [PMC free article] [PubMed] [Google Scholar]
- 4.So HC, Gui AH, Cherny SS, Sham PC. Evaluating the heritability explained by known susceptibility variants: a survey of ten complex diseases. Genet Epidemiol 2011;35:310–317 [DOI] [PubMed] [Google Scholar]
- 5.Poulsen P, Kyvik KO, Vaag A, Beck-Nielsen H. Heritability of type II (non-insulin-dependent) diabetes mellitus and abnormal glucose tolerance—a population-based twin study. Diabetologia 1999;42:139–145 [DOI] [PubMed] [Google Scholar]
- 6.Bloom JS, Ehrenreich IM, Loo WT, Lite TL, Kruglyak L. Finding the sources of missing heritability in a yeast cross. Nature 2013;494:234–237 [DOI] [PMC free article] [PubMed] [Google Scholar]
- 7.Franks PW. The complex interplay of genetic and lifestyle risk factors in type 2 diabetes: an overview. Scientifica 2012;2012:482186. [DOI] [PMC free article] [PubMed] [Google Scholar]
- 8.Slomko H, Heo HJ, Einstein FH. Minireview: Epigenetics of obesity and diabetes in humans. Endocrinology 2012;153:1025–1030 [DOI] [PMC free article] [PubMed] [Google Scholar]
- 9.Liu Y, Aryee MJ, Padyukov L, et al. Epigenome-wide association data implicate DNA methylation as an intermediary of genetic risk in rheumatoid arthritis. Nat Biotechnol 2013;31:142–147 [DOI] [PMC free article] [PubMed] [Google Scholar]
- 10.Bjornsson HT, Fallin MD, Feinberg AP. An integrated epigenetic and genetic approach to common human disease. Trends Genet 2004;20:350–358 [DOI] [PubMed] [Google Scholar]
- 11.Rakyan VK, Down TA, Balding DJ, Beck S. Epigenome-wide association studies for common human diseases. Nat Rev Genet 2011;12:529–541 [DOI] [PMC free article] [PubMed] [Google Scholar]
- 12.Patti ME, Butte AJ, Crunkhorn S, et al. Coordinated reduction of genes of oxidative metabolism in humans with insulin resistance and diabetes: Potential role of PGC1 and NRF1. Proc Natl Acad Sci USA 2003;100:8466–8471 [DOI] [PMC free article] [PubMed] [Google Scholar]
- 13.Drong AW, Lindgren CM, McCarthy MI. The genetic and epigenetic basis of type 2 diabetes and obesity. Clin Pharmacol Ther 2012;92:707–715 [DOI] [PMC free article] [PubMed] [Google Scholar]
- 14.Befroy DE, Petersen KF, Dufour S, et al. Impaired mitochondrial substrate oxidation in muscle of insulin-resistant offspring of type 2 diabetic patients. Diabetes 2007;56:1376–1381 [DOI] [PMC free article] [PubMed] [Google Scholar]
- 15.Dupuis J, Langenberg C, Prokopenko I, et al. DIAGRAM Consortium. GIANT Consortium. Global BPgen Consortium. Anders Hamsten on behalf of Procardis Consortium. MAGIC investigators New genetic loci implicated in fasting glucose homeostasis and their impact on type 2 diabetes risk. Nat Genet 2010;42:105–116 [DOI] [PMC free article] [PubMed] [Google Scholar]
- 16.Corella D, Arnett DK, Tsai MY, et al. The -256T>C polymorphism in the apolipoprotein A-II gene promoter is associated with body mass index and food intake in the genetics of lipid lowering drugs and diet network study. Clin Chem 2007;53:1144–1152 [DOI] [PubMed] [Google Scholar]
- 17.Irvin MR, Kabagambe EK, Tiwari HK, et al. Apolipoprotein E polymorphisms and postprandial triglyceridemia before and after fenofibrate treatment in the Genetics of Lipid Lowering and Diet Network (GOLDN) Study. Circ Cardiovasc Genet 2010;3:462–467 [DOI] [PMC free article] [PubMed] [Google Scholar]
- 18.Aslibekyan S, Kabagambe EK, Irvin MR, et al. A genome-wide association study of inflammatory biomarker changes in response to fenofibrate treatment in the Genetics of Lipid Lowering Drug and Diet Network. Pharmacogenet Genomics 2012;22:191–197 [DOI] [PMC free article] [PubMed] [Google Scholar]
- 19.Matthews DR, Hosker JP, Rudenski AS, Naylor BA, Treacher DF, Turner RC. Homeostasis model assessment: insulin resistance and beta-cell function from fasting plasma glucose and insulin concentrations in man. Diabetologia 1985;28:412–419 [DOI] [PubMed] [Google Scholar]
- 20.Absher DM, Li X, Waite LL, et al. Genome-wide DNA methylation analysis of systemic lupus erythematosus reveals persistent hypomethylation of interferon genes and remodeling of CD4+ T-cell populations. PLoS Genet 2013;9:e1003678. [DOI] [PMC free article] [PubMed] [Google Scholar]
- 21.Johnson WE, Li C, Rabinovic A. Adjusting batch effects in microarray expression data using empirical Bayes methods. Biostatistics 2007;8:118–127 [DOI] [PubMed] [Google Scholar]
- 22.Atkinson B, Therneau T. Kinship: mixed-effects Cox models, sparse matrices, and modeling data from large pedigrees. R package version 1.1.0-23, 2009
- 23.Sturek JM, Castle JD, Trace AP, et al. An intracellular role for ABCG1-mediated cholesterol transport in the regulated secretory pathway of mouse pancreatic beta cells. J Clin Invest 2010;120:2575–2589 [DOI] [PMC free article] [PubMed] [Google Scholar]
- 24.Mauldin JP, Nagelin MH, Wojcik AJ, et al. Reduced expression of ATP-binding cassette transporter G1 increases cholesterol accumulation in macrophages of patients with type 2 diabetes mellitus. Circulation 2008;117:2785–2792 [DOI] [PMC free article] [PubMed] [Google Scholar]
- 25.Kruit JK, Brunham LR, Verchere CB, Hayden MR. HDL and LDL cholesterol significantly influence beta-cell function in type 2 diabetes mellitus. Curr Opin Lipidol 2010;21:178–185 [DOI] [PubMed] [Google Scholar]
- 26.Kruit JK, Wijesekara N, Westwell-Roper C, et al. Loss of both ABCA1 and ABCG1 results in increased disturbances in islet sterol homeostasis, inflammation, and impaired β-cell function. Diabetes 2012;61:659–664 [DOI] [PMC free article] [PubMed] [Google Scholar]
- 27.Schou J, Tybjærg-Hansen A, Møller HJ, Nordestgaard BG, Frikke-Schmidt R. ABC transporter genes and risk of type 2 diabetes: a study of 40,000 individuals from the general population. Diabetes Care 2012;35:2600–2606 [DOI] [PMC free article] [PubMed] [Google Scholar]
- 28.Voight BF, Scott LJ, Steinthorsdottir V, et al. MAGIC investigators. GIANT Consortium Twelve type 2 diabetes susceptibility loci identified through large-scale association analysis. Nat Genet 2010;42:579–589 [DOI] [PMC free article] [PubMed] [Google Scholar]
- 29.Saxena R, Hivert MF, Langenberg C, et al. GIANT consortium. MAGIC investigators Genetic variation in GIPR influences the glucose and insulin responses to an oral glucose challenge. Nat Genet 2010;42:142–148 [DOI] [PMC free article] [PubMed] [Google Scholar]
- 30.Talens RP, Boomsma DI, Tobi EW, et al. Variation, patterns, and temporal stability of DNA methylation: considerations for epigenetic epidemiology. FASEB J 2010;24:3135–3144 [DOI] [PubMed] [Google Scholar]
- 31.Bird A. DNA methylation patterns and epigenetic memory. Genes Dev 2002;16:6–21 [DOI] [PubMed] [Google Scholar]
- 32.Fu Y, Maianu L, Melbert BR, Garvey WT. Facilitative glucose transporter gene expression in human lymphocytes, monocytes, and macrophages: a role for GLUT isoforms 1, 3, and 5 in the immune response and foam cell formation. Blood Cells Mol Dis 2004;32:182–190 [DOI] [PubMed] [Google Scholar]
- 33.Adalsteinsson BT, Gudnason H, Aspelund T, et al. Heterogeneity in white blood cells has potential to confound DNA methylation measurements. PLoS ONE 2012;7:e46705. [DOI] [PMC free article] [PubMed] [Google Scholar]