Abstract
The rostral nucleus of the solitary tract (rNST) receives orosensory information from taste bud cells in the tongue and palate via cranial nerves VII and IX. These nerves enter the brainstem, form the solitary tract (ST) and synapse with neurons in the rNST, which then relay incoming sensory information to other brain areas to process external gustatory stimuli. Factors that direct or regulate the trajectory of the developing ST are largely unknown. We used DiI to identify ST projections originating from cells in the geniculate ganglia of embryonic rats from embryonic day 14 through 18 (E14-E18). After identifying the ST fibers, immunolabeling for and protein expression analysis of the axon guidance molecules neuropilin-1 (Npn-1) and neuropilin-2 (Npn-2) and their binding partners, semaphorin-3A (Sema-3A) and semaphorin-3F (Sema-3F) were performed. The results detail the formation of ST projections into the gustatory brainstem and their relationship to developing rNST neurons. DiI-labeled ST fibers were present in the brainstem as early as E14. Npn-1 was expressed in the ST and in the trigeminal tract at E14, but levels of the protein declined through E18. The expression levels of the binding partner of Npn-1, Sema-3A, increased from E14 to E18. Npn-2 was expressed in the ST and, additionally, in radially oriented, tuft-like structures within the brainstem at E14. Expression levels of Npn-2 also declined through E18, in contrast to the expression levels of its binding partner, Sema-3F, which increased during this time period. For the first time, the time course and particular molecular components involved in development of the ST have been identified. These results indicate that the neuropilin and semaphorin families of axon guidance molecules are potential molecular participants in ST formation.
Keywords: Gustatory, rostral nucleus of the solitary tract, tract formation, neuropilins, semaphorins, axon guidance
1
The gustatory solitary tract (ST) consists of afferent fibers of the chorda tympani, greater superficial petrosal and glossopharyngeal nerves that relay sensory information from the oral cavity to the rostral nucleus of the solitary tract (rNST) in the brainstem. As the projecting nerves enter this complex tract, which extends through a large portion of the brainstem, they are spatially organized. Much of the work related to the development of the ST has focused on postnatal development of the terminal fields of the gustatory nerves (Mangold and Hill, 2007, 2008; Thomas and Hill, 2008). No study has attempted to examine the components involved in the guidance and projection of ST fibers in early development. In particular, there is little knowledge regarding the molecular signaling pathways associated with ST development.
Neuropilin-1 (Npn-1) and Neuropilin-2 (Npn-2) are transmembrane receptor proteins that form complexes with plexin receptors and are necessary for semaphorin signal transduction (Neufeld et al., 2002). The neuropilins and semaphorins are involved in nerve fasciculation and axon guidance in both sensory and motor systems (Pasterkamp, 2012). Roles for Npn-1, Npn-2 and their ligands, semaphorin-3A (Sema-3A) and semaphorin-3F (Sema-3F), respectively, are reported in the developmental organization of various cranial and spinal nerves (Pasterkamp, 2012). When activated, Npn-1 leads to the collapse of neuronal growth cones and Npn-2 causes axon repulsion; both effects are mediated by changes in the actin cytoskeleton (Neufeld et al., 2002; Schwarz and Ruhrberg, 2010). Npn-1 knockout mice exhibit defasciculation of both sensory and motor projections of the spinal and cranial nerves (Schwarz et al., 2004; Huettl and Huber, 2011; Huettl et al., 2011). Complementary to these findings, Sema-3A knockout mice exhibit defects in peripheral nerve projection and fasciculation (Taniguchi et al., 1997; White and Behar, 2000).
In particular, the neuropilins and semaphorins play important roles in development of the chemosensory systems, olfactory (Imai et al., 2009) and gustatory (Vilbig et al., 2004). In the olfactory system, levels of Npn-1 determine the axon projection sites of olfactory sensory neurons into the olfactory bulb (Imai et al., 2009). Npn-1 and its ligand, Sema-3A, are expressed in a complementary manner in olfactory sensory neurons, and olfactory sensory neuron specific knockout of Sema-3A results in alterations in central axon sorting and target patterning (Imai et al., 2009). In the peripheral gustatory system, Sema-3A and Sema-3F are present in the embryonic tongue and act to suppress and repel neurite outgrowth from the geniculate ganglion in a stage-dependent manner; this effectively prevents geniculate ganglion axons from entering the tongue epithelium until later stages of development when gustatory papillae are well formed (Rochlin et al., 2000; Dillon et al., 2004; Vilbig et al., 2004). Sema-3F mRNA is also present in the epithelium of the developing tongue and in the geniculate ganglion (Vilbig et al., 2004) and co-culture studies demonstrate a stage-dependent sensitivity of geniculate axon outgrowth to Sema-3A and Sema-3F (Vilbig et al., 2004).
Additionally, the neuropilins can function as receptors for vascular endothelial growth factors (VEGFs) and are involved in vessel formation and guidance. Npn-1 can bind VEGF by acting as a co-receptor with VEGF Receptor 2 (Carmeliet and Tessier-Lavigne, 2005) and Npn-2 plays a role in lymphatic vessel sprouting (Xu et al., 2010). Npn-1 knockout mice display defects in blood vessel branching, whereas Npn-2 knockout mice display defects in blood vessel formation (Carmeliet and Tessier-Lavigne, 2005).
It is apparent, therefore, that there are multiple neuron and neuron-related effects of Npn-1 and Npn-2 and their associated receptors. Since there is evidence for neuropilin/semaphorin signaling in the peripheral gustatory system, and in the peripheral and central olfactory systems, we examined the location of Npn-1 and Npn-2 in the developing ST. We found that fibers of the ST express both Npn-1 and Npn-2 in embryonic development, and that the expression levels of these proteins decrease as embryos develop. Additionally, Npn-1 is also expressed in fibers of the developing trigeminal tract, whereas Npn-2 is expressed in radially oriented tuft-like structures located medial to the developing ST. These associations suggest potential roles for Npn-1 and Npn-2 in directing formation of the ST. Of note, in other sensory systems, the concurrent expression of both Npn-1 and Npn-2 has not previously been examined in a single neural region. By documenting the appearance of a calbindin-positive cluster of neurons that may represent the presumptive rNST, we also demonstrate potential projections of ST fibers into the developing second order nucleus.
2. Experimental Procedures
2.1 Animal Care and Use
Animal experiments were approved by the University Committee on Use and Care of Animals at the University of Michigan and were carried out in accordance with National Institutes of Health Guide for the Care and Use of Laboratory Animals. Timed pregnant Sprague Dawley rats were obtained from Charles River Laboratories (Wilmington, MA, USA) and were housed in the vivarium of the University of Michigan School of Dentistry. The day on which the dams were sperm positive was designated as embryonic day zero (E0). Dams were deeply anesthetized at E14, E16 or E18 with an intraperitonal injection of sodium pentobarbital (60 mg/kg). The embryos were surgically removed from the dam, placed on ice and transcardially perfused with 0.1M phosphate buffered saline (PBS, pH 7.4). The embryos were then decapitated and heads were postfixed for 24 hours in 4% buffered paraformaldehyde (PFA) at 4°C.
2.2 DiI Tract Labeling
After fixation, the heads were embedded in 4% agarose and were dissected to expose the geniculate ganglion. A crystal of 1,1'-dioctadecyl- 3,3,3',3'-tetramethylindocarbocyanine perchlorate (DiI; Invitrogen, Carlsbad, CA, USA) was placed into the ganglion, and the preparation was then immersed in 4% PFA and incubated at 37°C for 4 to 8 weeks. At least 3 embryos were prepared for each stage examined.
2.3 Immunofluorescence
Brainstems were dissected and sectioned in either the horizontal or coronal plane at 100 μm thickness using a vibratome. The sections were blocked for 1 hour at room temperature in 10% normal donkey serum in PBS containing 0.1% Triton-X. Sections were then incubated overnight at 4°C in primary antibody (1:500 Neuropilin-1, Cat No AF566, R&D, Minneapolis, MN, USA or 1:200 Neuropilin-1, Cat No AB1321, AbCam, Cambridge, MA, USA; 1:200 Neuropilin-2, Cat No 3366, Cell Signaling, Danvers, MA, USA; 1:400 Calbindin, Cat No AB1778, Millipore, Billierica, MA, USA), rinsed and incubated in appropriate secondary antibodies (all 1:200, anti-goat Rhodamine, anti-rabbit Rhodamine, anti-rabbit AlexaFluor488, Jackson Immunoresearch, West Grove, PA, USA) for 2 hours at room temperature.
Sections were imaged on a confocal microscope (Nikon Instruments, Melville, NY, USA). The brainstem yielded three to four 100 μm sections for each embryo and each of these sections was examined to determine regions of ST and/or emerging rNST locations. These regions were then imaged in detail, in 0.5 μm Z steps. At least 5 embryos were studied at each stage.
2.4 Western Blots
Whole brainstems were collected in ice-cold PBS at E14, E16 and E18 (n=8 per age group). The tissue was lysed using RIPA buffer (Cell Signaling) containing 1 mM phenylmethanesulfonyl fluoride (Sigma-Aldrich, St. Louis, MO, USA). Proteins were separated by gel electrophoresis (20 μg protein per lane) and transferred to a polyvinylidene difluoride membrane. Membranes were blocked for 1 hour in 5% bovine serum albumin in Tris buffered saline with Tween20 and incubated overnight at 4°C in primary antibody (1:5000 Neuropilin 1, Cat No AB1321, AbCam; 1:1000 Neuropilin 2, Cat No 3366, Cell Signaling; 1:1000 Semaphorin 3A, Cat No AB23393, AbCam; 1 μg/mL Semaphorin-3F, Cat No AB39956, AbCam; 1:2500 GAPDH, Cat No AB9485, AbCam). Membranes were rinsed and incubated in secondary antibody for 2 hours at room temperature (1:20,000 Perox-AffiniPure donkey anti-rabbit, Jackson Immunoresearch). Bands were visualized using an enhanced chemiluminescence detection kit (Invitrogen). The same neuropilin antibodies were used in immunoreactions and Western blots. Four replicate gels were run.
3. Results
3.1 ST Formation and Extension
To establish when ST projections appear in the prenatal brainstem, DiI was applied to the geniculate ganglion of staged rat embryos. At E14, two tightly fasciculated bands of fibers were labeled with DiI; the more medial band is the ST (Figure 1A, arrow). At this stage, no radially oriented fibers appeared to originate from the ST (Figure 1A, inset). The more lateral band contains labeled fibers of the trigeminal tract (Figure 1A), fibers that are presumably the processes of geniculate ganglion neurons associated with innervation of the tympanic membrane and the skin of the external ear.
Figure 1. DiI labeled ST fibers.

A-C DiI placed into the geniculate ganglia labeled fibers of the developing ST at E14 (A), E16 (B) and E18 (C) and identified the ST trajectory in the brainstem. Arrows point to ST fibers at each stage. The more lateral set of fibers is the trigeminal tract. Dashed lines demarcate the edge of the brainstem/border of the 4th ventricle (4V). For each stage the boxed region of the ST is shown in an inset. At E14 (A) the ST extends over several hundred μm in the brainstem. There are no obvious collaterals from the ST (inset). At E16 (B) a more distributed ST is apparent in medial-lateral orientation. The inset illustrates growth cone-like puncta at higher magnification. By E18 (C) the fibers seem less densely bundled and there are numerous collateral branches from the ST. Scale bars = 100 μm. Bar in A applies to B also. Width of insets = 100 μm.
Multiple, single fiber collaterals branched from the ST by E16 (Figure 1B, arrow indicates ST). In addition to branched collaterals, some of these single fiber projections exhibited growth cone-like puncta which extended to the surface of the 4th ventricle, reminiscent of radial glia guide processes (Figure 1B, inset). At E18, the ST fibers had numerous collaterals that branched to form terminal fields (Figure 1C and inset). The collaterals no longer extended to the surface of the 4th ventricle, but puncta remained on the ends of the collaterals.
Overall, the developing prenatal ST is well established along the rostral-caudal extent as early as E14 in the rat. From E16, collaterals extend from the tract and by E18 form extensive terminal field regions.
3.2 Neuropilin-1 Is Expressed In Developing Brainstem Tracts
At E14, Npn-1 label was intense throughout the rostral-caudal extent of the ST (Figure 2A, arrows) and the trigeminal tract (Figure 2A, arrowheads). Within the ST, higher magnification images revealed that entering Npn-1 fibers were tightly fasciculated, without apparent radially oriented collaterals (Figure 2B, arrowhead indicates entering fibers). The general pattern of Npn-1 expression was continued at E16 (Figure 2C, arrows indicate ST, arrowheads point to the trigeminal tract). The ST became broader at this stage and fibers appeared as multiple, tight bundles within the ST (Figure 2D). Npn-1 expression in the ST was negligible by E18, although the trigeminal tract continued to express Npn-1 (data not shown). Therefore, although intense in early ST projections, at E18, when ST collaterals and terminal fields are observed, Npn-1 expression is greatly diminished.
Figure 2. Neuropilin-1 is expressed in the ST and trigeminal tract in embryonic brainstem.
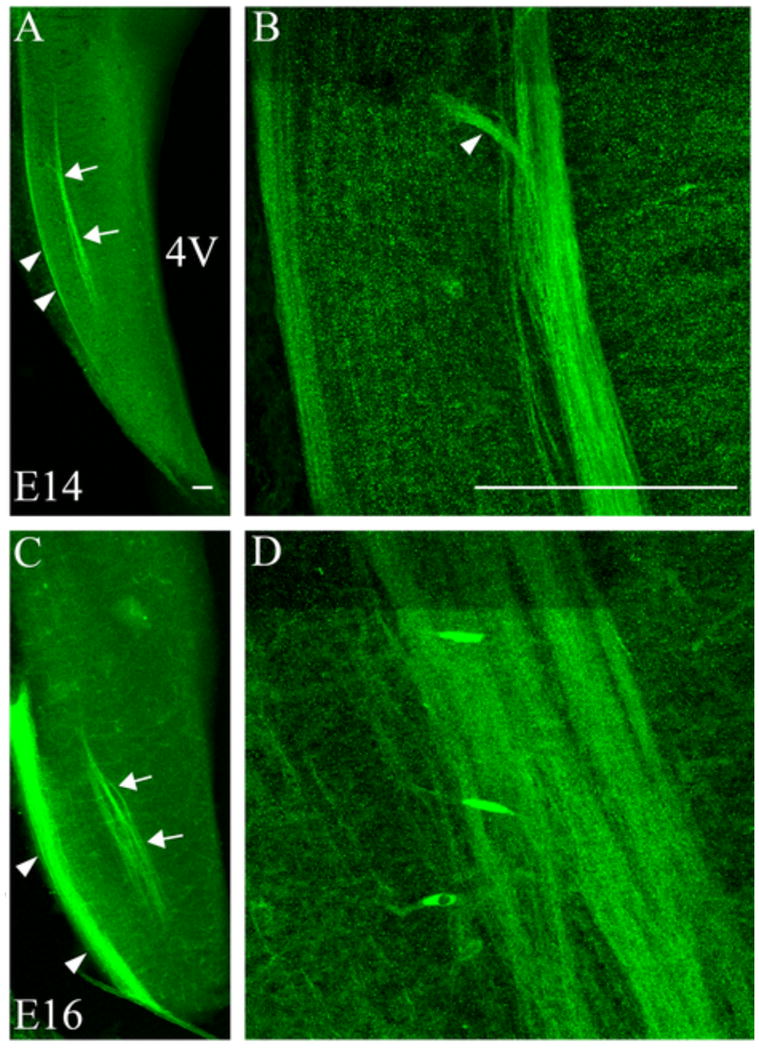
Neuropilin-1 expressing fibers were observed in the ST at E14 and E16. A. At E14, a low magnification image shows Npn-1 positive fibers in the ST (arrows) and in the more lateral trigeminal tract (arrowheads). B. At higher magnification, clear fasciculation of the ST fibers is apparent (arrowhead indicates entering ST fibers). C. The same pattern of Npn-1 expression in the ST is observed at E16 in a low magnification image of the brainstem (arrows indicate ST; arrowheads indicate trigeminal tract). D. The higher magnification image illustrates fasciculation of the ST fibers at E16. 4V = 4th ventricle. Scale bars = 100 μm.
3.3 Neuropilin-2 Is Expressed In Multiple Structures Within the Developing Brainstem
Npn-2 was also expressed in the brainstem of the developing rat embryo. At E14, Npn-2 label was intense in the developing ST (Figure 3A,B), but notably not in the trigeminal tract (Figure 3B inset). Interestingly, Npn-2 was expressed in radially oriented, tuft-like structures along the rostral-caudal extent of the ST (Figure 3A arrowheads and Figure 3B with inset). However, following analysis of individual confocal z-step images, it was concluded that these tufts did not originate from extensions of the ST, seen at higher magnification in Figure 3B. At E16, Npn-2 continued to be expressed in the ST and in the radially oriented, tuft-like structures (Figure 3C,D). The tuft-like structures extended to the surface of the 4th ventricle at this stage (Figure 3C). At E18, Npn-2 exhibited the same pattern of expression seen at E16 (data not shown).
Figure 3. Neuropilin-2 is expressed in the ST and associated tuft-like structures.
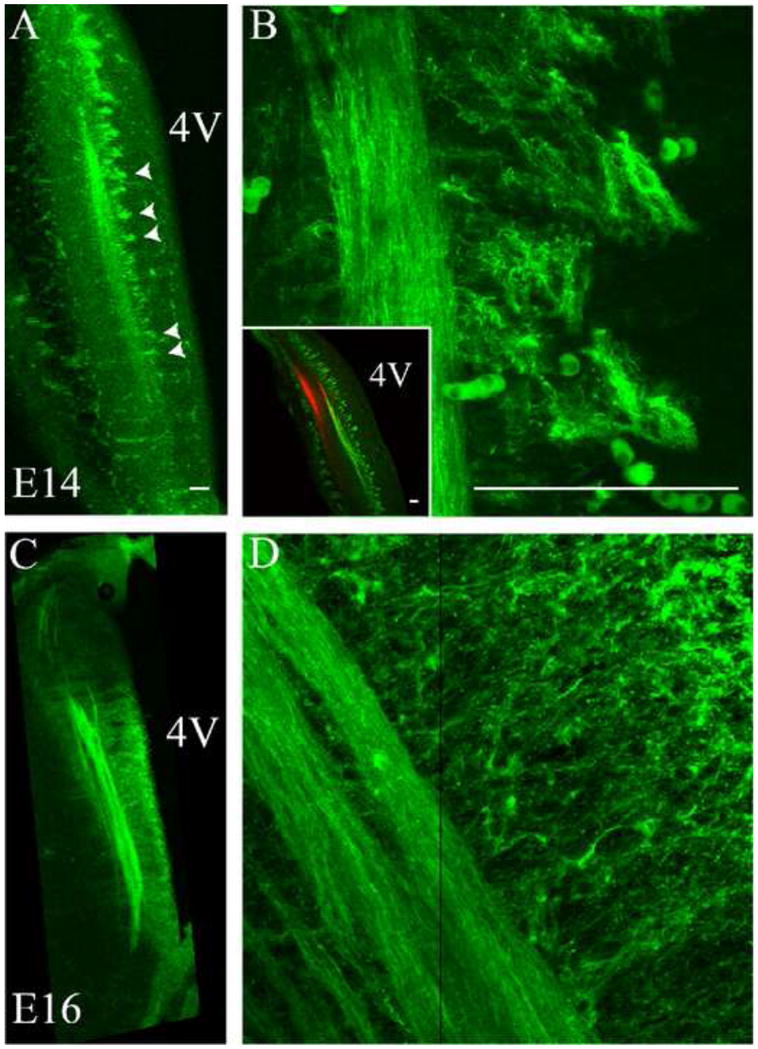
Neuropilin-2 expressing fibers and associated tuft-like structures were observed in the ST at E14 and E16, not in the trigeminal tract. A. At E14, the Npn-2 expressing ST and tuft-like structures are seen medial to the ST (arrowheads), extending towards the 4th ventricle. B. Higher magnification shows the tuft-like structures in detail. The inset emphasizes the highly patterned nature of the tufts, parallel to the ST. The inset also can be directly compared to Figure 1A and illustrates that Npn-2 is within the ST only, not in the trigeminal tract, labeled here with DiI (red). C. At E16, Npn-2 continues to be expressed in the developing ST and associated tuft-like structures. D. Higher magnification images show a more mesh-like network of fibers and tuft-like structures extending towards the 4th ventricle. A vertical black line in panel D is the border where two images were aligned in a montage to form one image. 4V = 4th ventricle. Scale bars = 100 μm.
3.4 Neuropilin-1 and Neuropilin-2 Are Expressed In Distinct Populations of Fibers In the Brainstem, But in Overlapping Populations Within ST
At both E14 and E16, Npn-1 (Figure 4A, D) and Npn-2 (Figure 4B, E) are expressed in the brainstem. We clarified potential overlap between neuropilin expression patterns within the brainstem using confocal microscopy. Merged confocal images revealed that the tuft-like structures only expressed Npn-2 at E14 and E16 (Figure 4C, F) and that Npn-2 did not label any fibers of the trigeminal tract (shown in Figure 3). In contrast, the tuft-like structures did not express Npn-1 at any time point examined and the trigeminal tract was exclusively labeled with Npn-1 (shown in Figure 2). Fibers of the ST did, however, co-express Npn-1 and Npn-2 (Figure 4C, F).
Figure 4. Neuropilin-1 and Neuropilin-2 are expressed in distinct populations of fibers within the brainstem, but overlap in the ST.
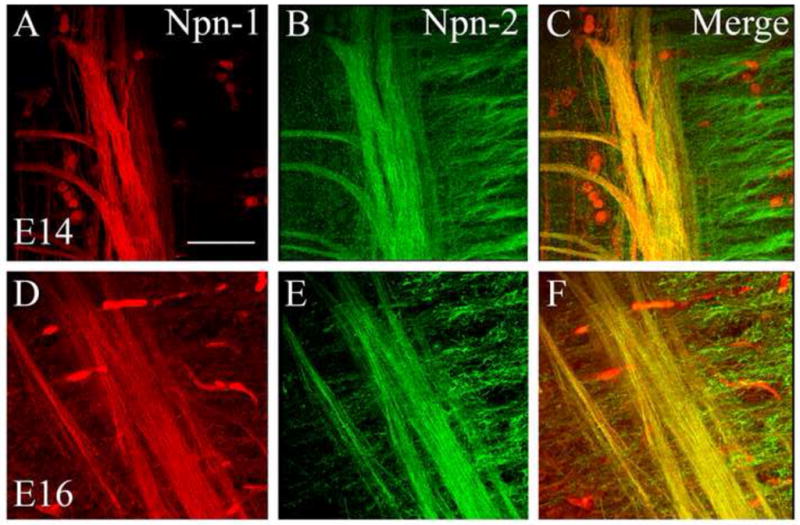
Npn-1 (A, D) and Npn-2 (B, E) are expressed in distinct, and overlapping, populations of fibers at E14 and E16. Merged images (C, F) highlight the tuft-like structures that exclusively express Npn-2 at both stages of embryonic development, and demonstrate that ST fibers express both Npn-1 and Npn-2. Scale bar = 50 μm.
3.5 Neuropilin-1 and Neuropilin-2 Expression In the Brainstem and Entering ST Fibers
Npn-1 and Npn-2 were visualized in the coronal plane for examination of gustatory nerve entry into the brainstem and potential patterns of expression in rNST subdivisions (Corson et al., 2012). The expression patterns confirmed results seen in the horizontal plane. Npn-1 was expressed in branches of the VII cranial nerve, the nerve that is composed of fibers from the chorda tympani (VII) and greater superficial petrosal (VII) nerves, as they entered the brainstem and in the trigeminal fibers of the lateral brainstem (Figure 5A, arrows). Npn-2 was also expressed in the VII cranial nerve (Figure 5B, arrows) and in an area that correlated with the tuft-like structures that were observed in the horizontal plane (Figure 5B, dashed lines). The merged image confirmed that Npn-1 and Npn-2 labeled distinct populations of fibers, tufts and trigeminal fibers, whereas the ST was labeled with both Npn-1 and Npn-2 (Figure 5C).
Figure 5. Neuropilin-1 and Neuropilin-2 expression in the coronal plane.
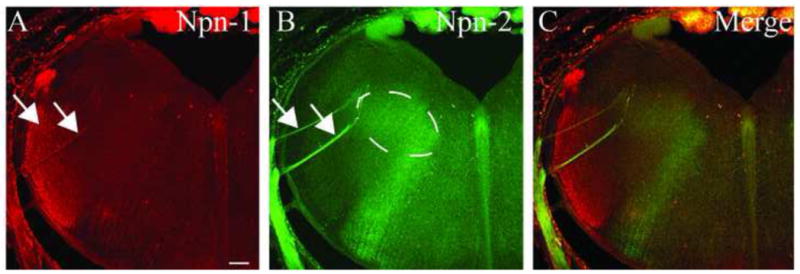
A, B. E16 coronal brainstem sections illustrating expression patterns of Npn-1 (A) and Npn-2 (B). The branches of cranial nerve VII are highlighted by arrows. The dashed line in B indicates the area of the Npn-2-labeled, tuft-like structures. C. A merged image details the distinct populations of tuft-like structures and trigeminal fibers, whereas the VII nerve projections express both Npn-1 and Npn-2. Scale bar = 100 μm.
3.6 Protein Expression Levels of Npn-1 and Npn-2 In the Brainstem Decrease Through Development
Western blot analysis of Npn-1 expression in the brainstem demonstrated a quantitative decrease in Npn-1 expression as development progressed (Figure 6A), consistent with the immunostaining results in the ST. Bands were seen as expected for Npn-1 (~103 kDa). Additionally, the expression levels of Npn-2 (~130 kDa) also decreased as development progressed (Figure 6B). Interestingly, in contrast to decreasing protein levels of the neuropilins, we found that the protein expression levels of Sema-3A (~95 kDa) and Sema-3F (~120 kDa) increased during development (Figure 6C, D). Sema-3A expression bands appeared later in development than those for Sema-3F.
Figure 6. Protein expression levels of neuropilins and semaphorins In the brainstem.
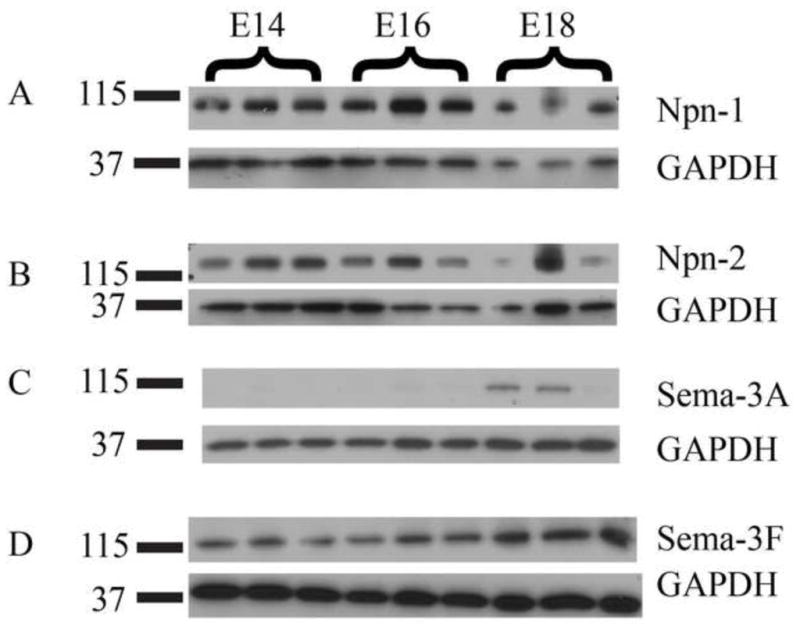
A, B. Protein expression levels of Npn-1 and Npn-2 at E14, E16 and E18 in the developing brainstem. Consistent with the immunohistochemical results, the protein expression levels decrease as development progresses. C, D. Protein expression levels of Sema-3A and Sema-3F. In contrast to neuropilin expression, semaphorin protein expression increases as development progresses. Sema-3A expression is seen later in development than Sema-3F. GAPDH was used as a loading control. Numbers at left of bands are in kDa.
3.7 Calbindin Positive Cells Form a Presumptive rNST
Calbindin immunoreactions were used to label cells in the putative, developing rNST. Calbindin expression is apparent in the emerging rNST at E14 and persists through E18. Calbindin expression was examined in conjunction with Npn-2 labeling of the ST to highlight anatomical arrangement of the ST fibers and calbindin-positive cells (Figure 7). At E14, calbindin-positive neurons represent a sparse group of cells medial to the ST that have a migratory appearance (Figure 7A), characterized by elongated somata and bipolar processes (Figure 7B, arrows). By E18, the medial rNST is obvious as a clustered group of calbindin positive neurons (Figure 7C, dashed lines), with somata that are more rounded than at E14 (Figure 7D, arrows). Although the form factor was not calculated for rNST neurons, numerous elongate somata, with bipolar processes, are obvious at E16 (Figure 7B) compared to E18 (Figure 7D).
Figure 7. Calbindin-positive cells form a presumptive rNST.
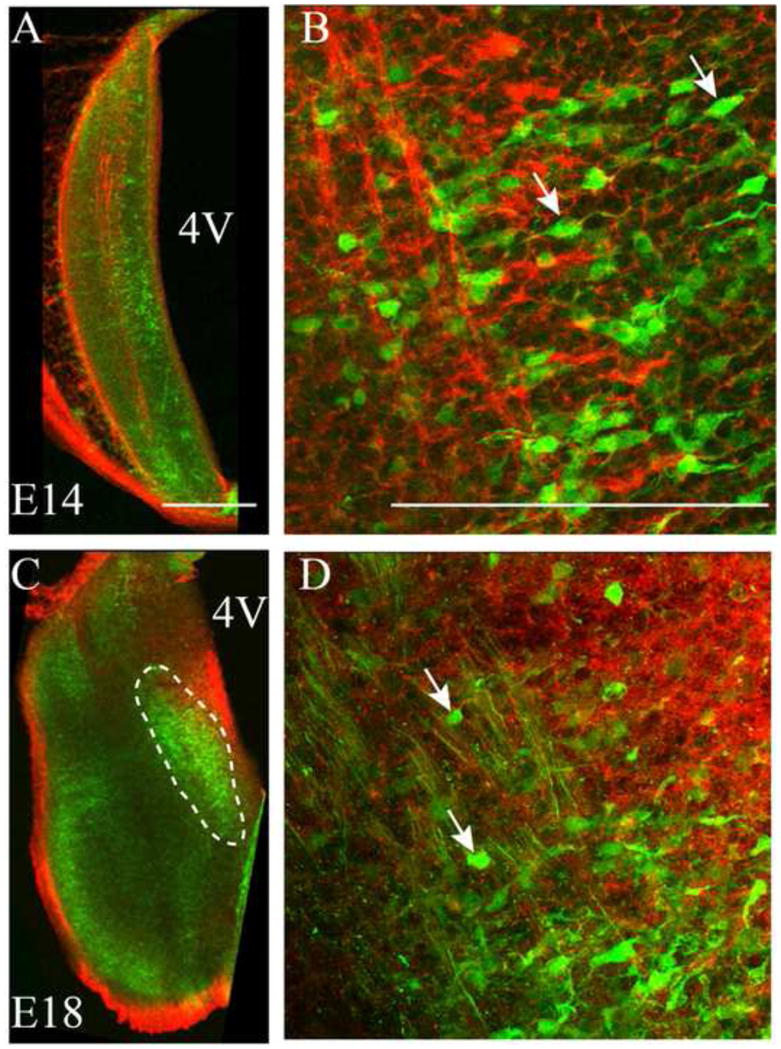
A. At E14, calbindin-positive cells (green) are present along the medial length of the ST. B. At E14, a migratory appearance, characterized by bipolar morphology and elongated soma shapes, is apparent for several neurons (arrows point to examples). The ST is labeled with Npn-2 (red) to highlight the relative location of calbindin-positive cells. C. At E18, the medial rNST is obvious as a group of green, clustered, calbindin-positive neurons located on the medial side of the ST, indicated by dashed lines. D. At E18 it is apparent that most neurons have lost their migratory appearance and most neuron somata are ovoid in shape (arrows point to examples). 4V = 4th ventricle; scale bars =100 μm.
4. Discussion
Timing of ST Fiber Entry Into the Brainstem Correlates With Timing of Peripheral Projection Entry Into the Tongue
The development of ST projections is accompanied by stage-specific expression of molecular factors that have potential roles in guidance and extension of the ST into the embryonic rat brainstem. DiI label of geniculate ganglion neurons revealed that ST fibers have entered the brainstem at least as early as E14 and that they continue to extend and branch throughout embryonic development. Radial projections from ST fibers extend to the surface of the 4th ventricle and exhibit growth cone-like morphology by E16.
The timing of the central projections reinforces data on entry of the peripheral projections of these neurons into the tongue where they innervate taste papillae, the sensory organs of the gustatory system (Altman and Bayer, 1982; Mbiene and Mistretta, 1997; Vilbig et al., 2004). It is likely that both the peripheral and central processes of geniculate ganglion neurons contain receptors and molecular machinery to regulate target innervation and path finding, although different sets of ligand molecules may be present in the target regions. However, there is sparse information about molecular expression in embryonic ST projections.
ST Projections to the Brainstem and Functional and Synaptic Development in Taste Neurons
To the best of our knowledge, there are few studies to determine functional aspects of prenatal development of ST and rNST in rat. Neuroanatomical characteristics in rNST of soma size, dendritic branch points, number of neurite endings and neurite length all increase from E14 through postnatal stages (Suwabe et al., 2011). The morphological maturation parallels changes in passive and action potential biophysical properties of the embryonic neurons. Voltage-gated, sodium channel properties alter dramatically with accompanying changes in discharge rate (Suwabe et al., 2011). In fact, ion channel function, albeit immature, is present before synaptic connections are detected and have proposed contributions to emerging central taste circuits (Suwabe et al., 2011). It is likely that there is an interactive modulation among afferent input and developing collaterals, directed by regulatory molecules including the neuropilins, and developing neuron channel properties that affect the input to emerging rNST.
Embryonic synapse receptor expression and function have been reported recently in rat rNST (Suwabe et al., 2013). Synaptic receptor responses were recorded from E14, a stage before we first noted extensive collateral projections, at E16. On the other hand, solitary tract stimulation first elicited postsynaptic excitatory and inhibitory potentials from E16 (Suwabe et al., 2013). Overall, there is a period of days for development of prenatal synaptic connections, in concert with the timing of ST collateral extension. In turn this coincides with the morphological appearance of synaptic thickenings in rNST (Zhang and Ashwell, 2001).
Synaptic activity in rat rNST has suggested roles in modifying terminal field organization (Mangold and Hill, 2007). Chemicals in the amniotic fluid could stimulate developing taste pathways when the embryo swallows (Bradley and Mistretta, 1973; 1975). Along with afferent neural activity, we propose that molecular regulation of incoming afferents, for timing and pattern of collateral extensions, can be important in circuit formation between ST and rNST.
Axon Guidance Molecules Are Expressed in the Developing ST in a Stage-Specific Manner
We examined early developmental stages of brainstem expression of the axon guidance molecules Npn-1 and Npn-2, whose binding partners, Sema-3A and Sema-3F, respectively, are known to be present in the tongue and geniculate ganglion (Dillon et al., 2004; Vilbig et al., 2004). Indeed, Npn-1 and Npn-2 were intensely expressed in the brainstem during embryonic development. In particular, immunohistochemical and protein expression analyses showed that whereas both of these molecules were expressed in the ST at E14, their expression decreased through E18.
In the rat, cells in the geniculate ganglion, which contribute a proportion of the fibers that make up the ST, undergo rapid proliferation around E12 (Altman and Bayer, 1982) and the peripheral fibers of the geniculate ganglia reach their targets, the taste papillae in the tongue, at around E15 (Altman and Bayer, 1982; Mbiene and Mistretta, 1997). Sema-3A and Sema-3F are known to be present and active in the developing tongue epithelium and it is thought that their expression regulates the timing of entry of geniculate and trigeminal axons into the tongue epithelium, through repulsion signals exerted on entering axons of sensory nerves (Dillon et al., 2004; Vilbig et al., 2004). In the brainstem, we demonstrated that Sema-3A and Sema-3F were expressed in a reciprocal manner to the neuropilins, i.e., their expression increased as development progressed. Overall, the timing of expression of neuropilin and semaphorin in the developing gustatory brainstem complements the timing of expression of these molecules in the peripheral gustatory system. It is reasonable that both ends of the pseudo-bipolar cells, with somata in the geniculate ganglion, can respond to these signals simultaneously.
It has been proposed that Sema-3A and Sema-3F are involved in developmental axon branching and retraction or pruning (Bagri et al., 2003; Gibson and Ma, 2011). The upregulation of semaphorin expression in the brainstem coincides with the time at which the fibers of the ST branch and begin to form terminal fields. As the ST is established, there is progressive fasciculation within the tract, and the fibers of the ST become more tightly bundled as they reach their mature organization. This process may be a result of the cell adhesion properties of Npn-1 (Neufeld et al., 2002; Schwarz and Ruhrberg, 2010) and the axon sorting properties of the semaphorins (Pasterkamp, 2012).
One potential explanation for the reciprocal timing in which the neuropilins and semaphorins are expressed may be that the neuropilins function to form the ST fibers into a tightly fasciculated tract. Once the tract is established, ST axons become responsive to semaphorins and the growing terminals are repelled away from the tract into the rNST where they form a terminal field. This hypothesis is not unreasonable because the permissiveness of brainstem substrate regulates the directional growth of developing fibers from the trigeminal ganglion (Miyahara et al., 2003).
Neuropilin-2 Positive Tuft-Like Structures in the Developing Brainstem
An interesting aspect of our data is the distinctive expression of Npn-1 and Npn-2 in particular populations of fibers in the brainstem. Both Npn-1 and Npn-2 labeled the developing ST, whereas only Npn-1 labeled fibers in the trigeminal tract and only Npn-2 labeled the tuft-like structures medial to the ST. This difference in distribution was observed in horizontal and coronal sectioning.
To understand the nature of the tuft-like structures, it is useful to consider non-neuronal expression of Npn-1 and Npn-2. It is known that VEGF can function as a binding partner for the neuropilins (Gerhardt et al., 2004; Xu et al., 2010), and neuropilin knock-out mice have defects in blood vessel development and branching (Carmeliet and Tessier-Lavigne, 2005). We propose that the Npn-2-labeled tuft-like structures observed in the embryonic brainstem may not be associated with development of the ST per se but rather are associated with developmental angiogenesis. With additional research, we can clarify the identity of these tufts and their possible role in development of the gustatory brainstem.
Summary
We have identified, for the first time, a set of molecular components associated with the development of the ST within the embryonic rodent brainstem. Npn-1 and Npn-2 are expressed by fibers of the ST in temporal associations that suggest roles in axon guidance and path finding. Our findings are summarized in Figure 8, which highlights the distinct and dynamic populations of Npn-1 and Npn-2 positive fibers in the developing brainstem and ST. Npn-1 expression in the ST and trigeminal tract is reduced through E18, whereas Npn-2 expression in the ST and tuft-like structures decreases from E14 to E16 but remains stable through E18.
Figure 8. Summary diagram.
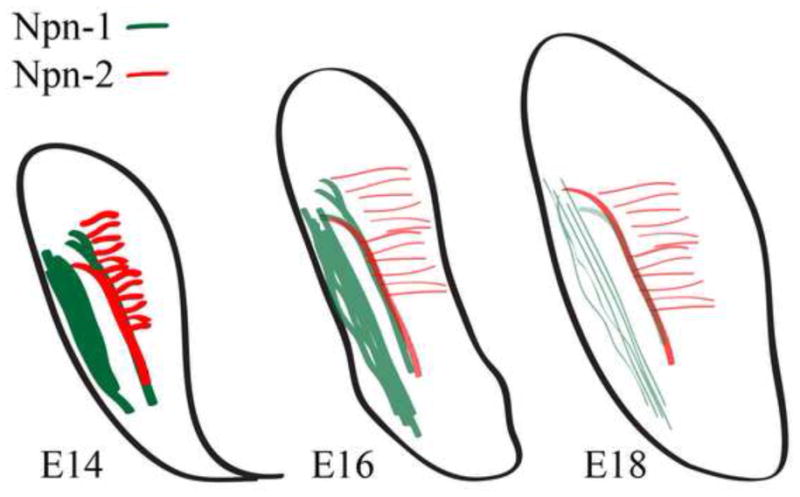
Summary diagram of Npn-1 and Npn-2 expression in developing brainstem. The diagram is to emphasize and summarize Npn-1 and -2 developmental expression, and does not directly reproduce DiI label data. Npn-1 positive fibers are green and Npn-2 positive fibers are red. The color intensity indicates protein expression level at each embryo stage. At E14 the ST expresses both Npn-1 and Npn-2; Npn-1 is expressed in the trigeminal tract; and, Npn-2 is expressed in the tuft-like structures medial to the ST. The same general pattern of expression continues at E16, but the overall protein levels of Npn-1 and Npn-2 decrease. By E18, Npn-1 expression (green) in the ST is negligible, but Npn-2 expression persists in both the ST and tuft-like structures.
It is clear that one set of signaling molecules will not regulate development of a complex projection, the ST. In particular, the role of plexins, neuropilin co-receptors, will need to be explored in greater detail to understand the functions of neuropilins and semaphorins in the ST. Other molecules, such as those in the Slit and Robo families, are integral to axon guidance and branching and their expression in the gustatory brainstem can be examined in future studies. Additionally, neurotrophin-4 and brain-derived neurotrophic factor, known to regulate development and numbers of geniculate ganglion cells and target innervation in the peripheral gustatory system (Patel and Krimm, 2012), might well have particular regulatory functions in brainstem taste circuits. Clarifying stage-specific molecules in taste projection circuits is understudied but can contribute to generating hypotheses about how the ST is established with particular topography and ultimately forms connections with the rNST.
Highlights.
Molecular components associated with solitary tract formation have been identified.
Neuropilin-1 labels solitary tract and trigeminal tract fibers.
Neuropilin-2 labels solitary tract fibers and radial tuft-like structures.
Neuropilin 1 and 2 expression decreases from E14 to E18.
Expression of neuropilin binding partners, semaphorins, increases from E14 to E18.
Acknowledgments
Supported by NIH NIDCD R01 DC009982, RMB.
Abbreviations
- ST
solitary tract
- rNST
rostral nucleus of the solitary tract
- Npn-1
neuropilin 1
- Npn-2
neuropilin 2
- PBS
phosphate buffered saline
- PFA
paraformaldehyde
- Sema-3A
semaphorin 3A
- Sema-3F
semaphorin 3F
- DiI
1,1'-dioctadecyl-3,3,3',3'-tetramethylindocarbocyanine perchlorate
- VEGF
vascular endothelial growth factor
Footnotes
AUTHOR CONTRIBUTIONS: SLC participated in the research and in article and figure preparation. MK participated in the research and figure preparation. CMM and RMB participated in research design, analysis and article and figure preparation. All authors have approved the final manuscript.
Publisher's Disclaimer: This is a PDF file of an unedited manuscript that has been accepted for publication. As a service to our customers we are providing this early version of the manuscript. The manuscript will undergo copyediting, typesetting, and review of the resulting proof before it is published in its final citable form. Please note that during the production process errors may be discovered which could affect the content, and all legal disclaimers that apply to the journal pertain.
References
- Altman J, Bayer SA. Development of the cranial nerve ganglia and related nuclei in the rat. Adv Anat Embryol Cell Biol. 1982;74:1–90. doi: 10.1007/978-3-642-68479-1. [DOI] [PubMed] [Google Scholar]
- Bagri A, Cheng HJ, Yaron A, Pleasure SJ, Tessier-Lavigne M. Stereotyped pruning of long hippocampal axon branches triggered by retraction inducers of the semaphorin family. Cell. 2003;113:285–299. doi: 10.1016/s0092-8674(03)00267-8. [DOI] [PubMed] [Google Scholar]
- Bradley RM, Mistretta CM. Swallowing in fetal sheep. Science. 1973;179:1016–1017. doi: 10.1126/science.179.4077.1016. [DOI] [PubMed] [Google Scholar]
- Bradley RM, Mistretta CM. Fetal sensory receptors. Physiolog Rev. 1975;55:352–382. doi: 10.1152/physrev.1975.55.3.352. [DOI] [PubMed] [Google Scholar]
- Carmeliet P, Tessier-Lavigne M. Common mechanisms of nerve and blood vessel wiring. Nature. 2005;436:193–200. doi: 10.1038/nature03875. [DOI] [PubMed] [Google Scholar]
- Corson J, Aldridge A, Wilmoth K, Erisir A. A survey of oral cavity afferents to the rat nucleus tractus solitarii. J Comp Neurol. 2012;520:495–527. doi: 10.1002/cne.22715. [DOI] [PMC free article] [PubMed] [Google Scholar]
- Dillon TE, Saldanha J, Giger R, Verhaagen J, Rochlin MW. Sema3A regulates the timing of target contact by cranial sensory axons. J Comp Neurol. 2004;470:13–24. doi: 10.1002/cne.11029. [DOI] [PubMed] [Google Scholar]
- Gerhardt H, Ruhrberg C, Abramsson A, Fujisawa H, Shima D, Betsholtz C. Neuropilin-1 is required for endothelial tip cell guidance in the developing central nervous system. Dev Dyn. 2004;231:503–509. doi: 10.1002/dvdy.20148. [DOI] [PubMed] [Google Scholar]
- Gibson DA, Ma L. Developmental regulation of axon branching in the vertebrate nervous system. Development. 2011;138:183–195. doi: 10.1242/dev.046441. [DOI] [PMC free article] [PubMed] [Google Scholar]
- Huettl RE, Huber AB. Cranial nerve fasciculation and Schwann cell migration are impaired after loss of Npn-1. Dev Biol. 2011;359:230–241. doi: 10.1016/j.ydbio.2011.08.019. [DOI] [PubMed] [Google Scholar]
- Huettl RE, Soellner H, Bianchi E, Novitch BG, Huber AB. Npn-1 contributes to axon-axon interactions that differentially control sensory and motor innervation of the limb. PLoS Biol. 2011;9:e1001020. doi: 10.1371/journal.pbio.1001020. [DOI] [PMC free article] [PubMed] [Google Scholar]
- Imai T, Yamazaki T, Kobayakawa R, Kobayakawa K, Abe T, Suzuki M, Sakano H. Pre-target axon sorting establishes the neural map topography. Science. 2009;325:585–590. doi: 10.1126/science.1173596. [DOI] [PubMed] [Google Scholar]
- Mangold JE, Hill DL. Extensive reorganization of primary afferent projections into the gustatory brainstem induced by feeding a sodium-restricted diet during development: less is more. J Neurosci. 2007;27:4650–4662. doi: 10.1523/JNEUROSCI.4518-06.2007. [DOI] [PMC free article] [PubMed] [Google Scholar]
- Mangold JE, Hill DL. Postnatal reorganization of primary afferent terminal fields in the rat gustatory brainstem is determined by prenatal dietary history. J Comp Neurol. 2008;509:594–607. doi: 10.1002/cne.21760. [DOI] [PMC free article] [PubMed] [Google Scholar]
- Mbiene JP, Mistretta CM. Initial innervation of embryonic rat tongue and developing taste papillae: nerves follow distinctive and spatially restricted pathways. Acta Anat (Basel) 1997;160:139–158. doi: 10.1159/000148006. [DOI] [PubMed] [Google Scholar]
- Miyahara M, Shirasaki R, Tashiro Y, Muguruma K, Heizmann CW, Murakami F. Pathfinding and growth termination of primary trigeminal sensory afferents in the embryonic rat hindbrain. J Comp Neurol. 2003;460:503–513. doi: 10.1002/cne.10650. [DOI] [PubMed] [Google Scholar]
- Neufeld G, Cohen T, Shraga N, Lange T, Kessler O, Herzog Y. The neuropilins: multifunctional semaphorin and VEGF receptors that modulate axon guidance and angiogenesis. Trends Cardiovasc Med. 2002;12:13–19. doi: 10.1016/s1050-1738(01)00140-2. [DOI] [PubMed] [Google Scholar]
- Pasterkamp RJ. Getting neural circuits into shape with semaphorins. Nat Rev Neurosci. 2012;13:605–618. doi: 10.1038/nrn3302. [DOI] [PubMed] [Google Scholar]
- Patel AV, Krimm RF. Neurotrophin-4 regulates the survival of gustatory neurons earlier in development using a different mechanism than brain-derived neurotrophic factor. Dev Biol. 2012;365:50–60. doi: 10.1016/j.ydbio.2012.02.008. [DOI] [PMC free article] [PubMed] [Google Scholar]
- Rochlin MW, O'Connor R, Giger RJ, Verhaagen J, Farbman AI. Comparison of neurotrophin and repellent sensitivities of early embryonic geniculate and trigeminal axons. J Comp Neurol. 2000;422:579–593. [PubMed] [Google Scholar]
- Schwarz Q, Gu C, Fujisawa H, Sabelko K, Gertsenstein M, Nagy A, Taniguchi M, Kolodkin AL, Ginty DD, Shima DT, Ruhrberg C. Vascular endothelial growth factor controls neuronal migration and cooperates with Sema3A to pattern distinct compartments of the facial nerve. Genes Dev. 2004;18:2822–2834. doi: 10.1101/gad.322904. [DOI] [PMC free article] [PubMed] [Google Scholar]
- Schwarz Q, Ruhrberg C. Neuropilin, you gotta let me know: should I stay or should I go? Cell Adh Migr. 2010;4:61–66. doi: 10.4161/cam.4.1.10207. [DOI] [PMC free article] [PubMed] [Google Scholar]
- Suwabe T, Mistretta CM, Bradley RM. Excitatory and inhibitory synaptic function in the rostral nucleus of the solitary tract in embryonic rat. Brain Res. 2013;1490:117–127. doi: 10.1016/j.brainres.2012.10.037. [DOI] [PMC free article] [PubMed] [Google Scholar]
- Suwabe T, Mistretta CM, Krull C, Bradley RM. Pre- and postnatal differences in membrane, action potential, and ion channel properties of rostral nucleus of the solitary tract neurons. J Neurophysiol. 2011;106:2709–2719. doi: 10.1152/jn.00178.2011. [DOI] [PMC free article] [PubMed] [Google Scholar]
- Taniguchi M, Yuasa S, Fujisawa H, Naruse I, Saga S, Mishina M, Yagi T. Disruption of semaphorin III/D gene causes severe abnormality in peripheral nerve projection. Neuron. 1997;19:519–530. doi: 10.1016/s0896-6273(00)80368-2. [DOI] [PubMed] [Google Scholar]
- Thomas JE, Hill DL. The effects of dietary protein restriction on chorda tympani nerve taste responses and terminal field organization. Neuroscience. 2008;157:329–339. doi: 10.1016/j.neuroscience.2008.09.013. [DOI] [PMC free article] [PubMed] [Google Scholar]
- Vilbig R, Cosmano J, Giger R, Rochlin MW. Distinct roles for Sema3A, Sema3F, and an unidentified trophic factor in controlling the advance of geniculate axons to gustatory lingual epithelium. J Neurocytol. 2004;33:591–606. doi: 10.1007/s11068-005-3329-8. [DOI] [PubMed] [Google Scholar]
- White FA, Behar O. The development and subsequent elimination of aberrant peripheral axon projections in Semaphorin3A null mutant mice. Dev Biol. 2000;225:79–86. doi: 10.1006/dbio.2000.9822. [DOI] [PubMed] [Google Scholar]
- Xu Y, Yuan L, Mak J, Pardanaud L, Caunt M, Kasman I, Larrivee B, Del Toro R, Suchting S, Medvinsky A, Silva J, Yang J, Thomas JL, Koch AW, Alitalo K, Eichmann A, Bagri A. Neuropilin-2 mediates VEGF-C-induced lymphatic sprouting together with VEGFR3. J Cell Biol. 2010;188:115–130. doi: 10.1083/jcb.200903137. [DOI] [PMC free article] [PubMed] [Google Scholar]
- Zhang LL, Ashwell KWS. The development of cranial nerve and visceral afferents to the nucleus of the solitary tract in the rat. Anat Embryol. 2001;204:135–151. doi: 10.1007/s004290100185. [DOI] [PubMed] [Google Scholar]


