Abstract
Background:
The blood pressure and anthropometric measurements are important for evaluating the health of children, adolescents as well as adults.
Aim:
The aim is to study the blood pressure and body dimensions and to find out the prevalence of overweight/obesity and hypertension among adults.
Materials and Methods:
A cross-sectional study was conducted of all the people belonging to the Punjabi community, residing in Roshanara area and Jaina building in Delhi, for the past 20 years and aged 18-50 years. The men were engaged in transport business and women were mainly housewives.
Results:
Mean values of all the measurements, that is, height, weight, upper arm circumference, pulse rate, systolic blood pressure (SBP), and diastolic blood pressure (DBP) were higher among males as compared with females, except skinfold thicknesses. Body mass index (BMI) and fat percentage was found to be higher among females as compared with males. There was a significant positive correlation between BMI, fat percentage, and blood pressure both SBP as well as DBP. Odds ratio showed that overweight/obese subjects were more likely to have hypertension than those with normal BMI.
Conclusion:
Prevalence of prehypertension among overweight/obese suggested an early clinical detection of prehypertension and intervention including life style modification, particularly weight management.
Keywords: Body mass index, Blood pressure (SBP and DBP), India, Punjabi adults, Obesity, Prehypertension
Introduction
Due to industrialization and urbanization, the standard of living continues to rise particularly in developing countries. This has led to weight gain and obesity, which are posing a threat to the health of citizens. Obesity is perhaps the most prevalent form of malnutrition in developing countries, both among adults and children. Studies have demonstrated that obesity is related to elevated systolic blood pressure (SBP) and diastolic blood pressure (DBP) elevation, dyslipidemia, diabetes, etc.[1,2,3]
Obesity, its attendant health consequences and consequent health burden, is expected to reach epidemic proportions in developing countries like India.[4] An increase in the dimension of this problem has been reported in the high socio-economic group in India. A study in Delhi revealed even higher prevalence (32-50%) of overweight (body mass index (BMI) >25) among adults belonging to high income group as compared with 16.2-20% in those belonging to middle income group.[5] BMI, calculated as weight in kg/height in meters squared, is most widely used to estimate the prevalence of obesity or underweight within a population. The relationship between BMI and blood pressure has long been the subject of epidemiological research. Positive association of BMI and blood pressure has also been reported among Asian populations. India in a process of rapid economic development and modernization with changing life style factors has an increasing trend of hypertension especially among urban population.[4] It is important from a public health perspective to have data on the characteristics and health of a population and of different subgroups in the population because of the racial/ethnic disparities in terms of long-term health consequences. It is necessary to identify individuals and populations at risk. The present study was therefore undertaken to examine the prevalence of overweight and obesity among Punjabi adults on the basis of BMI and to analyze the relation between anthropometric measures and blood pressure.
Materials and Methods
Cross-sectional survey of all the people belonging to Punjabi community residing in Roshanara Area and Jaina building in Delhi, for the past 20 years was conducted. A total of 117 males and 123 females aged from 18 to 50 years were included in the present study. Ethical approval for this study was taken from the ethical committee of the Department of Anthoropology, University of Delhi. Anthropometric measurements including height, weight, circumferences (upper arm, calf), skinfold thicknesses (at triceps, biceps, subscapular, and suprailiac) and physiological dimensions like blood pressure were taken on each subject. A standardized protocol was followed while taking measurements.[6] BMI (weight/height2 ) and fat percentage were calculated. BMI was classified according to the proposed criteria of World Health Organization (WHO) (CED III <16, CED II = 16-16.9, CED I = 17-18.49, underweight < 18.5, normal = 18.5-24.5, overweight = 25.0-29.9, and obese ≥30.00.[7] In the present study, all the subjects having BMI ≥30 were taken as obese. Normal blood pressure was taken as < 120 mmHg (SBP) and <80 mmHg (DBP). Blood pressure values of 120-139 mmHg (SBP) and 80-89 mmHg (DBP) were classified as prehypertensive. Stage-I hypertension was taken as 140-159 mmHg (SBP) and 90-99 mmHg (DBP), whereas blood pressure of >160 mmHg (SBP) and >100 mmHg (DBP) were classified as stage II hypertension (JNC2003). Body fat percentage was also computed. Body fat percentage is total body fat expressed as a percentage of total body weight. (Siri's equation). Body fat percentage = (4.95/D-4.50) × 100 where D = Density.
Statistical analysis
SPSS version 16.0 statistical software package was used to carry out statistical analysis. Descriptive statistics of mean and standard deviation, standard error were used to examine the data. Pearson moment correlation was used to find correlation between anthropometric measures and blood pressure. Regression analysis and cross tabulation was also carried out to see relationship between the variables.
The effect of age was controlled statistically to find out the relationship between blood pressure and other variables. Multiple linear regression was performed to quantify the effect of individual variables to SBP and DBP. SBP and DBP in separate models were the dependent variables; the independent variables were BMI, etc., (categorical), age (continuous).
Results
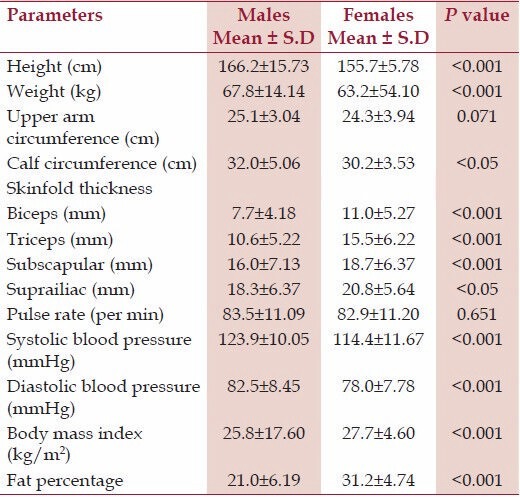
Table 1 shows the basic measurements of males and females and the difference between the two genders for the same. Mean values of height, weight, upper arm circumference, calf circumference, pulse rate, SBP, and DBP were found to be significantly higher in males as compared with females. The mean values of all the skinfold thicknesses, that is, biceps, triceps, subscapular, and suprailiac were higher among females than males. Similarly mean values of BMI and fat percentage were also higher among females.
Table 1.
Significance of the gender difference between various measurements

Age was found to have positive and statistically significant correlation with both SBP (r = 0.21, P < 0.01) and DBP (r = 0.18, P < 0.01) among males and for females the correlation between age and blood pressure (SBP and DBP) was r = 0.44, P < 0.01 and r = 0.27, P < 0.01, respectively. There was statistically significant positive correlation between blood pressure (both SBP and DBP) and anthropometric measurements, pulse rate, fat percentage, and BMI as shown in [Tables 2 and 3] among males and females, respectively.
Table 2.
Correlation between systolic and diastolic blood pressure with various anthropometric measurements, pulse rate, fat percentage and BMI. Males

Table 3.
Correlation between systolic and diastolic blood pressure with various anthropometric measurements, pulse rate, fat percentage, and BMI. Females

The prevalence of overweight/obesity is presented in Table 4. The prevalence of underweight was more in females as compared with males. More Punjabi females were obese as compared with males. The prevalence of overweight was higher among males as compared with females.
Table 4.
Age adjusted prevalence of overweight/obesity among Punjabi males and females

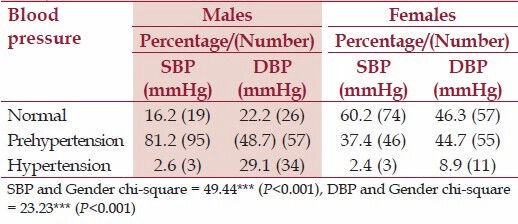
Table 5 shows the age adjusted prevalence of hypertension among adult Punjabi males and females. The prevalence of prehypertension as well as hypertension was higher in males as compared with females.
Table 5.
Prevalence of hypertension among adult Punjabi males and females

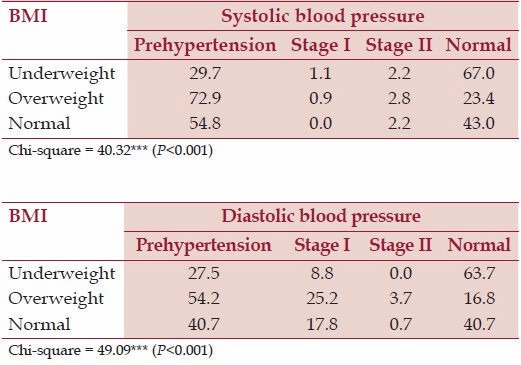
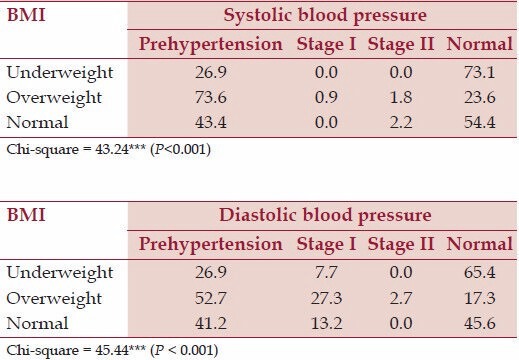
As assessed by SBP and DBP, maximum percentage of overweight males had prehypertension; for SBP it was 72.9% and for DBP it was 54.2%. Similarly when DBP is concerned, 25.2% of adult males had Stage I hypertension [Table 6]. Among females also, prehypertension was maximum in overweight females when SBP (73.6%) as well as DBP (52.7%) were considered. The differences in the various categories were found to be statistically significant (chi-square P < 0.001) [Table 7].
Table 6.
Distribution of systolic and diastolic blood pressure of adult Punjabi males (18-50 years) according to different BMI categories

Table 7.
Distribution of systolic and diastolic blood pressure of adult Punjabi females (18-50 years) according to different BMI Categories

The prevalence of prehypertension and stage-I hypertension increased 2.82 and 2.65 times, respectively, in overweight/obese males as compared with their nonobese counterparts. Almost 8.98 times higher rate of stage II hypertension was observed in overweight/obese males as compared with their nonobese counterparts [Table 8]. Among females also, the prevalence of prehypertension and hypertension increased more than 2 and 3.74 times, respectively, in overweight/obese subjects as compared with the nonobese females. Similar was the status of stage II hypertension. Almost 8.98 times higher rate of hypertension was observed as compared with those who were in normal BMI category [Table 9]. Those who were underweight were less likely to have higher SBP and DBP than those who were in other BMI category.
Table 8.
BMI as a risk factor for systolic and diastolic blood pressure (Males)

Table 9.
BMI as a risk factor for systolic and diastolic blood pressure (Females)

Discussion
Age was positively correlated with blood pressure (both SBP and DBP). The relationship between blood pressure and age was found to be significant and was stronger in women than men in the present study. Many studies have found the relationship between blood pressure and age (both SBP and DBP) to be significant among both males and females.[6,7,8] In general, blood pressure rises as people get older. Age is known risk factor for high blood pressure.[9,11,38] Both SBP and DBP were found to be significantly higher among men as compared with women in the present study. Gender differences in blood pressure are detectable during adolescence and persist through adulthood. In all ethnic groups, men tend to have higher mean SBP and DBP than women, and through middle age, the prevalence of hypertension is higher among men than women.[23] Premenopausal women have quantitatively more lipoprotein lipase (LPL) and higher LPL activity in gluteal and femoral subcutaneous regions, which contain fat cells larger than those in men but these differences disappear after menopause.[24] Men show minimal regional variation in fat cell size or LPL activity. These differences may explain the tendency for premenopausal women to deposit fat preferentially in lower body fat depots. The higher level of intraabdominal tissue found in men compared with premenopausal women seems to explain, in part, the greater prevalence of dyslipidaemia and Chronic Heart Disease (CHD) in men than in premenopausal women.
In the present study, we found statistically significant positive correlation between all the anthropometric measures and SBP and DBP. Studies in various populations also showed strong relationship between different anthropometric indicators and blood pressure levels.[9,10,11,12,13,14,15,16] Body composition variables such as weight, skinfold thicknesses, etc. have been shown to be significantly correlated with blood pressure in adults.[29] The significant association of BMI with SBP and DBP is also evident from the values of Pearson's correlation coefficient among males and females of the present study [Tables 2 and 3]. These findings are in agreement with other studies,[16,22] which support a strong relationship between BMI and blood pressure across developed and developing countries.[9,10,11,12,13,14,15] Strong relationship of fat percentage with both SBP and DBP among both males and females was also observed in the present study.
Several studies have been done in different parts of India on factors affecting cardiovascular functions.[4] Obesity or excess relative weight is found to be associated with increased risk of disease morbidity and mortality.[21]) BMI is widely accepted as one of the best indicator of nutritional status in adults.[25,26,27,28] The importance of BMI and skinfolds has been recognized for estimating cardiovascular disease (CVD) risk factors, particularly due to their positive association with hypertension.[31] Linear regression showed BMI and waist circumference (WC) as important predictors of hypertension.[17] Subcutaneous abdominal tissue was more consistently related to CVD risk than peripheral skinfolds. Linear correlations between both SBP and DBP for all anthropometric measurements among males were found to be significant in the adult Brazilian men and blood pressure increased with higher BMI, WC, and various skinfold locations.[29] Many investigators have earlier reported significant positive correlation of BMI with SBP and DBP.[17,18,31,32,33,34]
The prevalence of obesity was greater in adult females (18%) as compared with males (14.5%) in the present study. Similar gender differences in adiposity have been reported.[17,34] Greater responsiveness of blood pressure in women to gain in relative weight or abdominal deposition has also been documented.[18,33,35]
Our study documents the high prevalence of both hypertension and prehypertension, and their association with other cardiovascular risk factors, among the Punjabi adults of Delhi, India. The prevalence of obesity was higher among females, however, the prevalence of prehypertension and hypertension was higher among males. This has also been previously reported among Baniya population[22] and Jamaican population.[18] In addition, there was a high prevalence of prehypertension in our study (SBP 81.2%, DBP 48.7%), among males as well as females (SBP 37.4%, DBP 44.7%). This was similar to that reported from industrialized economies.[17,40] In Indians, among urban residents >18 years living in Chennai, the prevalence of prehypertension was reported as 47%.[16] Even in the rural population in Assam, 54% of subjects had prehypertension and one-third had hypertension.[39] The prevalence of prehypertension among Punjabis of the present study was higher as compared with other studies, 47.6% in the Baniyas of Delhi, 28.5% in Uruguay, 20.0% in Australia, 31% in the United States, and 34% in Taiwan.
In the present study, the males mostly belonged to businessmen category, involved in transport business. The higher prevalence of prehypertension and hypertension among Punjabis may be attributable to differences in dietary habits, socio-economic status, sedentary life style, intake of alcohol, and rates of obesity. They did jobs that involved more of mental strain in spite of the fact that they were more or less sedentary (they have drivers and helpers to carry out the various jobs), than the other categories of occupation such as professionals and those doing office work. They were also found to have higher mean values of weight, almost all anthropometric measurements and skinfold thicknesses.[30] The lower levels of blood pressure among women may be attributable to a protective effect of estrogen,[19] smoking, and alcoholic status; most of the women were premenopausal and all of them were nonsmokers and nondrinkers.
The prevalence of hypertension has been increasing in India, both in rural and in urban regions. The public health burden of people with prehypertension is worthy of serious evaluation as these subjects are unaware of their condition and if a population approach to disease prevention is applied, we could expect that a small reduction in mean population blood pressure will result in relatively large reduction in overall disease risk.
In the present study, prevalence of high blood pressure was greater in those with high BMI, which was also reported by other studies.[37,38] Relationship between prehypertension and overweight and obesity as observed in the present study has also been observed in other studies.[35,36] Individuals in the urban environment did not only show higher prevalence of obesity but also more elevated blood pressure level. Doll et al.[14] explained obesity-associated hypertension as an inadequate vasodilatation in the presence of increased blood volume and cardiac output, which are natural consequences of an increased mass. Among both males and females, overweight/obesity has been found to be risk factor, more for DBP, which is more dependent on peripheral resistance. Since, DBP is closely correlated with SBP, the factors that increase DBP may thereby also increase SBP.[20] Hypertension has been characterized as a “disease of civilization” resulting from an incompatible interaction between a modern affluent lifestyle and paleolithic genes.[33]
The overall findings suggest obesity to be important risk factor for prehypertension and hypertension as prehypertension and hypertension are more prevalent among overweight and obese subjects as compared with other categories.
Conclusion
Classification as “Prehypertensive” or even at risk for hypertension may cause obese subjects to take notice. As BMI is a reflection of life style, addressing it would be appropriate when subjects are in that range. An elevated BMI being associated with prehypertension may suggest that such individuals are at increased risk of progressing to frank hypertension. Therefore weight management programs are more important for these Punjabis than the life style modification programs targeted at hypertension. But we cannot draw causal relationships at this stage because of cross-sectional nature of our study.
Acknowledgments
The authors are thankful to all subjects. Suman Dua is greatfull to the University Grants Commission (UGC) for providing financial assistance through PDF(W).
Footnotes
Source of Support: Nil.
Conflict of Interest: None declared.
References
- 1.Freedman DS, Perry G. Body composition and health status among children and adolescents. Prev Med. 2000;31:34–53. [Google Scholar]
- 2.Sorof J, Daniels S. Obesity and Hypertension in children: A problem of epidemic proportions. Hypertension. 2002;40:441–7. doi: 10.1161/01.hyp.0000032940.33466.12. [DOI] [PubMed] [Google Scholar]
- 3.Yusuf S, Hawken S, Ounpuu S, Bautista L, Franzosi MG, Commerford P, et al. INTERHEART. Study Investigators. Obesity and risk of myocardial infarction in 27,000 participants from 52 different countries: A case control study. Lancet. 2005;366:1640–9. doi: 10.1016/S0140-6736(05)67663-5. [DOI] [PubMed] [Google Scholar]
- 4.Srikanth J, Jayant Kumar K, Narasimha NS. Factors influencing obesity among urban high school children Bangalore City. Indian J Nutr Dietet. 2011;48:8–17. [Google Scholar]
- 5.Nutrition Foundation of India . Obesity in urban middle class in Delhi. 1999 Scientific Report 15. [Google Scholar]
- 6.Weiner JS, Lourie JA. Practical human Biology Anthropometry. New York: Academic Press; 1981. p. 27.p. 54. [Google Scholar]
- 7.WHO expert consultation. Appropriate body mass index for Asian population and its implication for policy and intervention strategies. Lancet. 2004;363:157–63. doi: 10.1016/S0140-6736(03)15268-3. [DOI] [PubMed] [Google Scholar]
- 8.JNC 7. The seventh report of the joint national committee on prevention, detection, evaluation and treatment of high blood pressure. JAMA. 2003;289:2560–71. doi: 10.1001/jama.289.19.2560. [DOI] [PubMed] [Google Scholar]
- 9.Gardner AW, Poehlman ET. Predictors of age related increase in blood pressure in men and women. J Gerontol A Biol Sci Med Sci. 1995;50A:M1–6. doi: 10.1093/gerona/50a.1.m1. [DOI] [PubMed] [Google Scholar]
- 10.Kusuma YS, Babu BV, Naidu JM. Blood pressure levels among cross cultural/populations of Visakhapatnam district, Andhra Pradesh, India. Ann Hum Biol. 2002;29:502–12. doi: 10.1080/03014460110117876. [DOI] [PubMed] [Google Scholar]
- 11.Jervase E, Barnabas D, Emeka AG, Osondu N. Sex differences and Relationship between blood pressure and age among the Igbos of Nigeria. Internet J Biol Anthropol. 2009:3–2. [Google Scholar]
- 12.Gupta R, Mehrishi S. Waist-hip ratio and blood pressure correlation in an urban Indian population. J Indian Med Assoc. 1997;95:412–5. [PubMed] [Google Scholar]
- 13.Diet nutrition and the prevention of Chronic diseases. Report of WHO study group. Word Health Organisation. 1990. WHO Technical. [PubMed]
- 14.Doll S, Paccaud F, Bovet P, Burnier M, Wietlisbach V. Body mass index, abdominal adiposity and blood pressure: Consistency of their association across developing and developed countries. Int J Obes Relat Metab Disord. 2002;26:48–57. doi: 10.1038/sj.ijo.0801854. [DOI] [PubMed] [Google Scholar]
- 15.Bose K, Ghosh A, Roy S, Gangopadhyay S. Blood pressure and waist circumference: An empirical study of the effects of waist circumference on blood pressure among Bengalee male jute workers of Belur, West Bengal, India. J Physiol Anthropol Appl Hum Sci. 2003;22:169–73. doi: 10.2114/jpa.22.169. [DOI] [PubMed] [Google Scholar]
- 16.Shanthirani CS, Pradeepa R, Deepa R, Premalatha G, Saroja R, Mohan V. Prevalence and risk factors of hypertension in selected South Indian population – The Chennai Urban Population Study. J Assoc Physician India. 2003;51:20–7. [PubMed] [Google Scholar]
- 17.Wang H, Cao J, Li J, Chen J, Wu X, Duan X, et al. Blood pressure, body mass index and risk of cardiovascular disease in Chinese men and women. BMC Public Health. 2010;10:189. doi: 10.1186/1471-2458-10-189. [DOI] [PMC free article] [PubMed] [Google Scholar]
- 18.Ferguson TS, Younger NO, Tulloch-Reid MK, Wright MB, Ward EM, Ashley DE, et al. Prevalence of prehypertension and its relationship to risk factors for cardiovascular disease in Jamaica: Analysis from a cross- sectional survey. BMC Cardiovasc Disord. 2008;8:20. doi: 10.1186/1471-2261-8-20. [DOI] [PMC free article] [PubMed] [Google Scholar]
- 19.Mendelsohn ME, Karas RH. The protective effects of estrogen on the cardiovascular system. N Engl J Med. 1999;340:1801–11. doi: 10.1056/NEJM199906103402306. [DOI] [PubMed] [Google Scholar]
- 20.Bulpitt CJ, Hodes C, Everitt MG. The relationship between blood pressure and biochemical risk factors in a general population. Br J Prev Soc Med. 1976;30:158–62. doi: 10.1136/jech.30.3.158. [DOI] [PMC free article] [PubMed] [Google Scholar]
- 21.Tyagi R. Body composition and nutritional status of the institutionalised and non-institutionalised senior citizens. EAA Summer School eBook. 2007;1:225–2319. [Google Scholar]
- 22.Gupta S, Kapoor S. Sex differences in blood pressure levels and its association with obesity indices: Who is at greater risk. Ethn Dis. 2010;20:370–4. [PubMed] [Google Scholar]
- 23.Stamler J, Stamler R, Reidlinger WF, Algera G, Roberts RH. Hypertension screening of 1 million Americans. Community Hypertension Evaluation Clinic (CHEC) Program. JAMA. 1976;235:2299–306. doi: 10.1001/jama.235.21.2299. [DOI] [PubMed] [Google Scholar]
- 24.Rebuffle-Strive M, Bjorntopp P. Regional adipose tissue metabolism in man. In: Vague J, Bjorntopp P, Grey-Grand B, editors. Metabolic complications of human obesities. Amsterdam: Excerpta Medica; 1985. pp. 149–59. [Google Scholar]
- 25.James WP, Ferro-Luzzi A, Waterlow JC. Definition of chronic energy deficiency in adults. Eur J Clin Nutr. 1988;42:969–81. [PubMed] [Google Scholar]
- 26.Fe rro-Luzzi A, Sette S, Franklin M, James WP. A simplified approach of assessing adult energy deficiency. Eur J Clin Nutr. 1992;46:173–86. [PubMed] [Google Scholar]
- 27.Shetty PS, James WP. Food and Nutrition paper 56. Rome: Food and Agriculture Organisation; 1994. Body Mass Index: A measure of chronic energy deficiency in adults. [PubMed] [Google Scholar]
- 28.Kapoor S, Dhall M, Kapoor AK. Nutritional status and ageing among populations. Inhabiting varied geological regions in India. Biennial Book of EAA. 2010;6:85–100. [Google Scholar]
- 29.Cassani Roerta SL, Nobre F, Pazin-Fiho A, Schmidt A. Relationship between blood pressure and anthropometry in a cohort of Brazilian men: A cross-sectional study. Am J Hypertens. 2009;22:980–4. doi: 10.1038/ajh.2009.104. [DOI] [PubMed] [Google Scholar]
- 30.Pressure among Punjabi Khatris. Ph.D. thesis. (Unpublished) Delhi: University of Delhi; 1992. Dua (nee Verma) Suman. Anthropological study of Blood. [Google Scholar]
- 31.Dua S, Kapoor S. Blood pressure, waist to hip ratio and body mass index among affluent Punjabi girls of Delhi. Acta Med Auxol. 2000;32:153–7. [Google Scholar]
- 32.Okosun IS, Prewitt TE, Cooper RS. Abdominal obesity in the United States: Prevalence and attributable risk of hypertension. J Hum Hypertens. 1999;13:425–30. doi: 10.1038/sj.jhh.1000862. [DOI] [PubMed] [Google Scholar]
- 33.Weder AB. Membrane sodium transport. In: Izzo JL, Black HR, editors. Hypertension Primer. Dallas TX: American Heart Association; 1993. pp. 36–7. [Google Scholar]
- 34.Poulter NR, Khaw KT, Hopwood BE, Mugambi M, Peart WS, Rose G, et al. The Kenyan Luo migration study: Observations on the initiation of a rise in blood pressure. BMJ. 1990;300:967–72. doi: 10.1136/bmj.300.6730.967. [DOI] [PMC free article] [PubMed] [Google Scholar]
- 35.Greenlund KJ, Croft JB, Mensah GA. Prevalence of heart disease and stroke risk factors among adults in United States, 1991-1999. Arch Intern Med. 2004;164:181–8. doi: 10.1001/archinte.164.2.181. [DOI] [PubMed] [Google Scholar]
- 36.Rohrer JE, Anderson GJ, Furst JW. Obesity and prehypertension in family medicine: Implications for quality improvement. BMC Health Serv Res. 2007;7:212. doi: 10.1186/1472-6963-7-212. [DOI] [PMC free article] [PubMed] [Google Scholar]
- 37.Kannel WB. Risk stratification in hypertension: New insight from the Framingham study. Am J Hypertens. 2000;13:3S–10. doi: 10.1016/s0895-7061(99)00252-6. [DOI] [PubMed] [Google Scholar]
- 38.Mungreiphy NK, Kapoor S, Sinha R. Association between BMI, Blood Pressure and Age: Study among Tangkhul Naga Tribal Males of North east India. J Anthropol. 2011 Article ID 748147, 6 pages, 2011. doi:10.1155/2011/748147. [Google Scholar]
- 39.Hazarika NC, Narain K, Biswas D, Kalita HC, Mahanta J. Hypertension in the native rural population of Assam. Natl Med J India. 2004;17:300–4. [PubMed] [Google Scholar]
- 40.Wolf-Maier K, Cooper RS, Banegas JR, Giampaoli S, Hense HW, Joffres M, et al. Hypertension prevalence and blood pressure levels in 6 European countries, Canada, and the United States. JAMA. 2003;289:2363–9. doi: 10.1001/jama.289.18.2363. [DOI] [PubMed] [Google Scholar]


