Abstract
In this paper, we investigate the focalization properties of single-element transducers at low frequencies (300 to 1000 kHz) through primate and human skulls. The study addresses the transcranial targeting involved in ultrasound-induced blood-brain barrier (BBB) opening with clinically relevant targets such as the hippocampus and the basal ganglia, which are typically affected by early Alzheimer’s and Parkinson’s disease, respectively. A finite-difference, time-domain simulation platform is used to solve the 3-D linear acoustic wave equation with CT-based acoustic maps of the skulls. The targeted brain structures were extracted from 3-D brain atlases registered with the skulls and used to virtually position and orient the transducers. The effect of frequency is first investigated and the targeting of the different structures is then tested. The frequency of 500 kHz provided the best trade off between phase aberrations and standing wave effects in the human case, whereas the frequency of 800 kHz was most suitable in the case of the primate skull. A fast periodic linear chirp method was developed and found capable of reducing the standing wave effects. Such a simple, affordable, and convenient system is concluded to be feasible for BBB opening in primates and humans and could thus allow for its broader impact and applications.
I. Introduction
Microbubble-enhanced, transcranial focused ultrasound (FUS) is a promising, noninvasive technique shown to open the blood-brain-barrier (BBB) noninvasively, transiently, and locally [1]–[4]. By opening the BBB, it is possible to deliver larger compounds (>400 Da) that would not otherwise penetrate the brain tissue [5], [6]. Recently, the targeted delivery of potential therapeutic agents in small animals [8]–[11] has generated renewed interest in the delivery of new drugs in the treatment of neurodegenerative disease in humans. For example, Alzheimer’s and Parkinson’s treatment stand to benefit significantly from this new delivery technique for promising therapeutic agents such as growth factors (>15 kDa) [12]–[15] or adenoviruses in gene therapy [16]–[18].
On the other hand, scaling from small to large animals can be a difficult task because the ultrasound beam is greatly affected by the skull thickness. Phase aberrations caused by discrepancies in sound velocity as well as high absorption can rapidly yield poor focusing and higher energy loss, especially at higher ultrasound frequencies [19], [20].
For more than 15 years, researchers have worked on ways to overcome these effects and obtain a uniform focus through the skull [21]–[23]. However, most of those studies were designed for high-intensity focused ultrasound (HIFU) therapy, a promising technique used in noninvasive tumor ablation in the brain [24]. HIFU therapy relies on thermal effects, which are dependent on the beam intensity whereas FUS-induced BBB opening relies mostly on mechanical effects such as cavitation (be it stable or inertial) [25], [26], which is linked to the beam pressure and is thus inherently less concentrated than thermal effects.
Transcranial HIFU research has led to the development of complex and expensive but very efficient techniques based on multi-element arrays [27] and electronic phase correction techniques relying on prior knowledge of the skull geometry [28]–[30]. Using these techniques, a higher accuracy and a smaller focus compared with conventional focusing techniques could be achieved, two essential conditions given the destructive purpose of transcranial HIFU.
On the other hand, sonothrombolysis studies, which use ultrasound to dissolve clots in the brain, generally use lower frequencies, which are less prone to phase aberrations and absorption but enhance cavitational effects [31]–[33]. The beam is generally loosely focused to cover a large volume of the brain in each application. However, one of these studies led to large, secondary hemorrhaging [34], which has been hypothesized to be linked to unexpected enhanced cavitation effects caused by standing waves generated within the skull [35]–[37]. Standing waves are known to be capable of trapping microbubbles in antinodes and decreasing their inertial cavitation threshold [37], [38].
In this numerical study, we investigate the use of intermediate frequencies with single-element transducers for the targeting of clinically relevant targets involved in Parkinson’s and Alzheimer’s disease, i.e., the basal ganglia and the hippocampus, respectively [39], [40]. The study is based on numerical beam simulations at the steady state with emphasis on the targeted volume size, beam distortion, and attenuation as well as the contribution from standing waves. We will first introduce the method developed in this study: the CT acquisition, the hypotheses made, and the simulation software, backed by an experimental validation of the pressure field, the methodology used for the transducer design and position. The estimators used for the quantification of the different physical effects relevant for the blood-brain barrier opening will also be introduced and discussed. The results section will first present the results of the numerical simulation on the different potential targets in a human skull: the hippocampus, the putamen, and the caudate nucleus. The effects of frequency will also be shown on the targeting of the hippocampus. The second part of the results section will deal with the non-human primate case following a similar order. Finally, the last part of the results section will entail the results of a chirp-based method to reduce standing-wave formation in the human skull case.
The cross-species study, based on primate and human skulls described herein, is expected to shed light into how previous findings in mice translate to the human scale. The first step taken in that direction entails the understanding of the physics of transcranial ultrasound focalization in those species using practical and simple designs. The proposed designs and methods do not require electronic phase corrections and are thus low cost and simple to build. Additionally, depending on the final robustness of the targeting system, real-time MRI monitoring might not be necessary during each application, leading to a decreased treatment time, complexity, and cost.
II. Materials and Methods
This study is based on both numerical simulations and in vitro calibration and comparison. Its goal is to investigate the feasibility of transcranial focusing using a single low-frequency transducer for the BBB opening in deep-seated, sub-cortical structures such as the hippocampus or the basal ganglia (more precisely the putamen and the caudate nucleus) in non-human primates and humans.
Mice are currently the predominant model in neuroscience, because they are inexpensive and easy to handle and can serve as models for numerous diseases. Our group and others have conducted several studies on the mechanism, safety, optimization, and delivery of pharmacologically relevant drugs in the mouse [41]–[44]. However, the path to clinical applications is more complex and the need for studies on larger animals has not yet been as appropriately studied. Non-human primates are widely used as animal models in neuroscience and can serve as models for several neurodegenerative diseases [45]–[48]. Their similarity to humans in terms of the brain has rendered them a very important intermediate step toward human applications in terms of both safety and efficacy. They would also help identify how key parameters of the BBB-opening protocol found in mice could be scaled to large animals and humans. As such, a primate skull has been used in this study to investigate the possible use of a simple and convenient sonication scheme for future primate studies. Finally, as the ultimate and long-term goal of this research, the human skull was also included in the study.
A. CT Imaging
The primate skull used is from the Macaca mulatta species, also known as the rhesus monkey, one of the most common non-human primate species used for non-human primate research. The formalin-fixed skull is 145 mm long, 85 mm high, and 69 mm with a thickness of 2.6 ± 0.2 mm and a brain volume of 85 cm3. The foramen hole has a diameter of 15.2 ± 0.45 mm and was used for the in vitro pressure scans as well as the calibration of the acoustic parameters. The full 3-D CT scan of the skull was acquired on a GE LightSpeed VCT 64 scanner (GE Medical Systems, Milwaukee, WI) with a native 488-µm resolution and slice thickness of 625 µm.
The human skull was approximately 195 mm long, 145 mm high, and 148 mm wide with an average thickness of 5.75 ± 0.72 mm and a brain volume of 1500 cm3. The foramen hole had a diameter of approximately 21 ± 2.2 mm and was also used for the in vitro pressure scan and calibration. The same GE LightSpeed VCT 64 scanner with the same parameters was used for the full 3-D CT scan leading to an average of 16 samples of the CT density function through the skull thickness. A higher resolution would permit depiction of finer heterogeneities of the skull but was not supported by the clinical systems available.
B. Numerical Simulation
1) Acoustic Propagation Software
Numerical simulations are based on a linear full-wave 3-D finite-difference time-difference (FDTD) commercial package (Wave 3000, CyberLogic, New York, NY). The package solves the linear equation for the wave propagation [49]:
| (1) |
where ρ is the material density [kg·m−3], λ is the first Lame constant [N·m−2], φ is the bulk viscosity [N·s·m −2], and U is the 3-D vector displacement field [m·s−1]. All aforementioned properties correspond to the medium (e.g., water, brain, or skull), in which the wave propagates.
The linearity of the model was chosen primarily to limit the overall computation time of each simulation. It is also believed that the non-linear contribution will be low at the pressure threshold of BBB opening as shown by our group (0.3 MPa at 1.5 MHz) [50]. If the hypothesis that the BBB opening threshold is linearly correlated with the mechanical index holds true [26], the pressure required for BBB opening at lower frequencies will be even lower than those reported here.
In these simulations, viscoelasticity was not modeled because shear waves do not propagate in liquid media and the mode conversion from compressional to shear waves inside the skull is not significant at an incidence angle lower than 20° [50].
Finally, the simulation was carried out on a 64-bit workstation with 4-dual core, 2.3 GHz Xeon processors and 32 Gb of RAM (Precision WorkStation 690, Dell, Austin, TX).
2) Acoustic Properties Deduced From CT Imaging
Previously reported simulation studies of transcranial ultrasound have used different strategies for the modeling of the skull, from a simple homogeneous layer model with thickness assessed by CT scans [28], [51] to full 3-D heterogeneous maps of the skull based on the CT apparent density [29], [30], [52].
In this study, the latter model was selected that takes into account the heterogeneities inside the skull, because it theoretically provides better accuracy. In this model, the acoustic density ρ and velocity c maps are assumed to be proportional to the apparent CT density maps [29], [52], [53].
If ρCT is the normalized apparent CT density (0 ≤ ρCT ≤ 1), we have (inside the skull material only):
| (2) |
| (3) |
| (4) |
where ρ0 is the acoustic density of water, ρmax is the maximum acoustic density in the skull [kg·m−3], c0 is the water velocity, cmax is the maximum velocity in the skull [m·s−1], and αskull is the skull attenuation [dB·m−1].
Note that in our case, the attenuation was assumed to be homogeneous inside the skull to simplify the model. Most absorption models are complex and can be inconsistent [29], [52], [53] and additional uncertainties or instabilities in our model need to be avoided.
CT density maps of the human and primate skulls were respectively resampled to an isotropic 250-µm and 200-µm resolution using spline interpolation. This resolution provided the necessary stability for the FDTD algorithm but was not capable of modeling the finer heterogeneities. The time-step was automatically adapted by the software to satisfy the Courant stability [54] criterion in the absorbing media. To simplify the simulations, the higher spatial resolution was always used for the model so that the grid size was kept constant for all wavelengths used. However, because the points per wavelength ratio can change, this may introduce some numerical dispersion which could be dependent on each simulation and could affect the quality of the simulations. The software was tested by simulating plane waves in different media (brain and skull at 500 kHz, Table I) and was found to follow the correct attenuation values.
TABLE I.
Brain and Skull Parameters Used in the Numerical Study.
| Density (kg/m3) | Velocity (m/s) | ||||
|---|---|---|---|---|---|
| Max | Average | Max | Average | Attenuation | |
| Water | — | 1000 | — | 1540 | 2.5 Np/m/MHz |
| Human skull | 2190 | 1895 | 3100 | 2690* | |
| 300 kHz | No attenuation | ||||
| 500 kHz | 60 Np/m | ||||
| 550 kHz | 80 Np/m* | ||||
| 700 kHz | 130 Np/m | ||||
| Primate skull | 2190 | 1900 | 3100 | 2550* | |
| 600 kHz | 50 Np/m | ||||
| 800 kHz | 120 Np/m* | ||||
| 1 MHz | 190 Np/m | ||||
| Human brain | — | 1000 | — | 1560 | 10 Np/m/MHz (5 Np/m at 500 kHz) |
| Monkey brain | — | 1000 | — | 1560 | 10 Np/m/MHz |
3) Acoustic Tissue Parameters
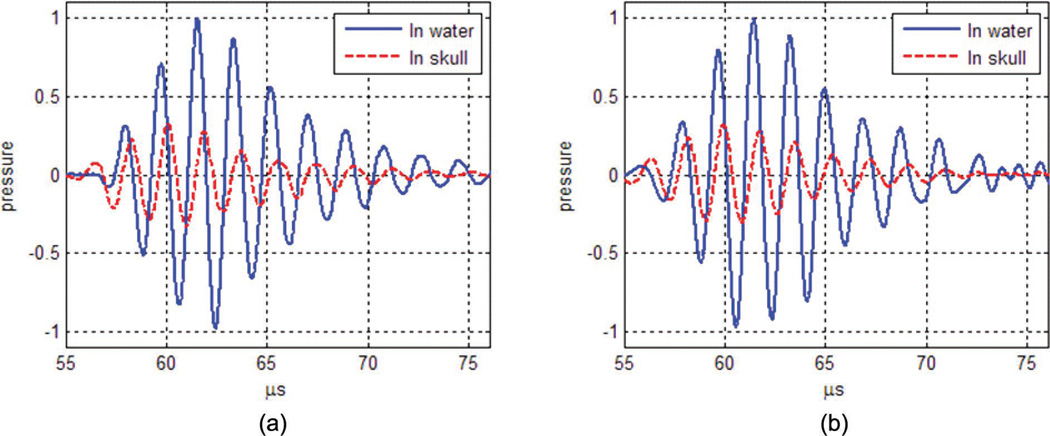
Most tissue parameters used were adapted from the literature [55], [56] and were assumed to be similar in the human and primate skulls. However, the attenuation and sound velocity were adjusted from the in vitro measurements described in the next section. Using a series of transient pulses, the time of flight and attenuation were measured and compared with simulations of the same transducer, positioning, and excitation pulse parameters. Values of skull attenuation αskull and maximum sound velocity cmax were then modified in (3) and (4) from their initial values to provide the best match between simulations and experiments. An example of pulses in the case of the human skull, after adjustment of the acoustic parameters, is presented in Fig. 1. The parameters used in the study are provided for both species in Table I. The use of the 550 and 800 kHz frequencies as references for the model and for the comparison was based on the expected tradeoff between standing waves and beam aberration, taking into account the thickness and brain volume difference between the primate and the human skulls. Other frequencies will be investigated in the numerical results section.
Fig. 1.
Nomalized pressure waveform in water (solid lines) and through the human skull (dashed lines). (a) In vitro human skull measurements. (b) Simulation after calibration of the maximum sound velocity and absorption of the human skull model.
Sound velocity was assumed to be frequency-independent [57] and attenuation was assumed to follow a linear relationship with frequency in the frequency range used here, a slope of 350 Np/m/MHz was assumed for both skulls based on Connor and Hynynen’s report on homogenized attenuation values [52].
Simulations were performed at different frequencies to estimate the correlation lengths of both skulls (through the parietal bone). The results (Table II) show a drop of the correlation length with the frequency, indicating an increase in beam aberration. The correlation lengths in the primate skull are larger than in the human skull because the skull is thinner; however, this is through the parietal bone, i.e., without taking into account higher incidence angle and specific bone structures.
TABLE II.
Correlation Lengths Through Both Skulls (mm).
| 300 kHz | 500 kHz | 600 kHz | 700 kHz | 800 kHz | 900 kHz | 1000 kHz | |
|---|---|---|---|---|---|---|---|
| Human skull | 47.5 | 27.4 | — | 18.2 | — | 10.6 | — |
| Primate skull | — | — | 34.3 | 27.8 | 20.3 | 17.9 | 13.4 |
Correlation lengths were estimated based on simulated data in the parietal bone. The correlation length decreases with frequency as the spatial variation of the skull thickness variation appears larger relatively to the wavelength; this is a sign of increased aberrations occurring with higher frequencies.
4) Acoustic Measurements
In vitro measurements were conducted with a 0.2-mm needle hydrophone (Precision Acoustics Ltd., Dorchester, Dorset, UK) and acquired on a PC workstation with an 80-MHz digital acquisition board (model 14200, Gage Applied Technologies Inc., Lachine, QC, Canada). The hydrophone was suspended from a linear 3-D axis positioning system (Velmex Inc., Bloomfield, NY) and used for raster scanning. Each skull was soaked in degassed water for several hours before all measurements. Two transducers were used. The first transducer (Imasonic, Tours, France) had a center frequency of 1.3 MHz (active diameter = 60 mm, inner hole diameter = 16.5 mm, focal distance = 60 mm, bandwidth at half-power = 43%) and was used for the monkey skull measurements and calibration using a frequency of 800 kHz. The second transducer (Riverside Institute, New York, NY) had a lower center frequency of 550 kHz (active diameter = 80 mm, inner hole diameter = 24 mm, focal distance = 90 mm, bandwidth at half-power = 15%) and was used for the human skull measurements and calibration at lower frequencies. The selection of these frequencies were based on some initial simulations and including taking into account beam aberrations and standing waves effects depending on the skull size and thickness. Additional frequencies (300 to 700 kHz and 600 to 1000 kHz for the human and monkey skull, respectively) were investigated numerically.
For all measurements, the highest pressure peak was first identified in water and a 3-D raster scan was successively performed. The skulls were then carefully positioned with the hydrophone kept centered inside the foramen magnum hole and the transducer facing the top of the skull at a controlled distance.
Pressure scans through the skull were acquired (30 × 10 × 10 mm at 550 kHz for the human skull, 15 × 6 × 6 mm at 800 KHz for the primate skull) and normalized by the peak pressure in water with all parameters kept identical. Pressure scans were deliberately centered below the focus point to avoid any possible contact between the hydrophone and the skull during scans. Additionally, a series of 30 transient pulses (4 cycles) were averaged and recorded at the acoustic focus, first in water and then in the presence of a skull. They were used as described previously for the calibration of the sound velocity and attenuation.
5) Comparison
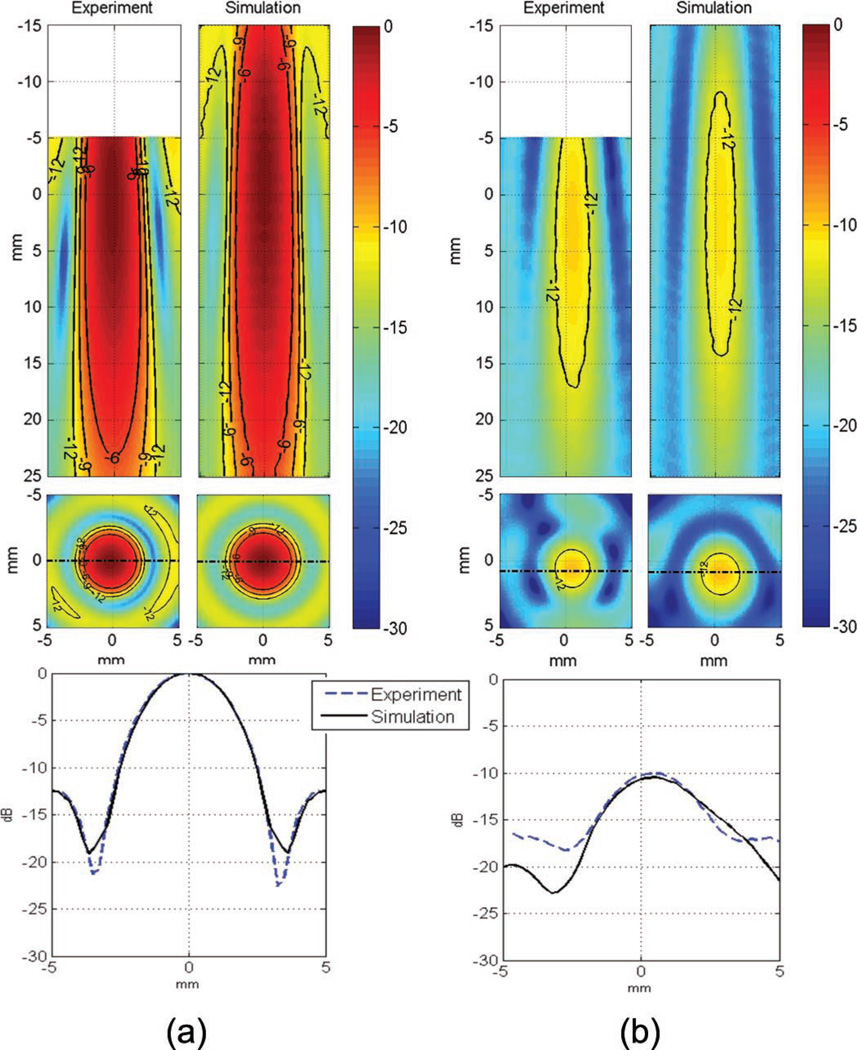
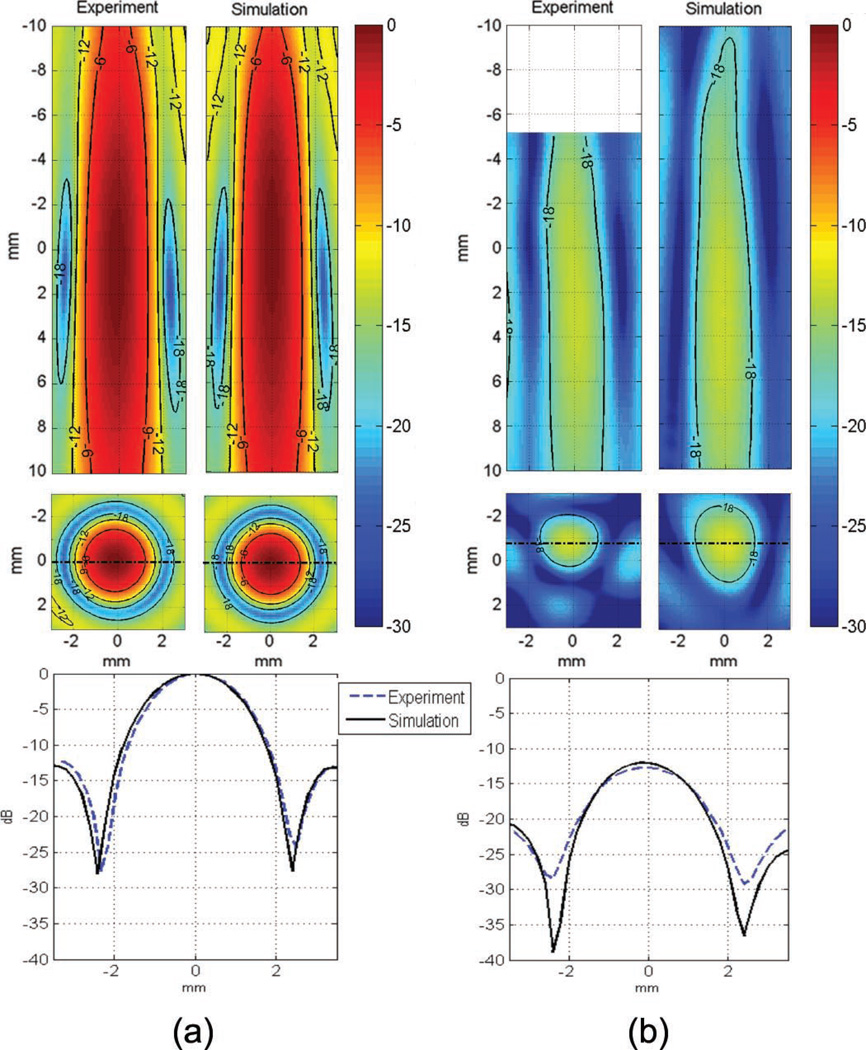
The peak pressure field was compared between the in vitro pressure scan and the simulated field for the primate and human skulls to estimate the simulation accuracy. As described previously, the transducer was positioned above the horizontally-oriented skull and the hydrophone was inserted through the foramen magnum hole. In experiments, the volume where the pressure field was acquired had to be limited, axially, to prevent any accidental contact between the hydrophone and the top of the skull (see the top of Figs. 2 and 3), and laterally, because of the limited size of the foramen magnum hole, which prevented the acquisition of the side lobes in vitro while preserving the entire structure of the skull, which was essential for accurately representing the in vivo transcranial case.
Fig. 2.
Comparison of experimental and simulated pressure scans in decibels (a) in water, (b) through the human skull at 550 kHz. The pressure was normalized to the peak value in water. Initial positioning error of the skull in the simulation model compared with the experiment is estimated to be a few millimeters. The pressure scan was not acquired close to the skull surface.
Fig. 3.
Comparison of experimental and simulated pressure scans in decibels (a) in water, (b) through the monkey skull at 800 kHz. The pressure was normalized to the peak value in water. As a precaution the pressure scan was not performed close to the skull surface (−5 to −10 mm in the axial profile of the experiment).
Despite these slight differences between the experimental and simulation results, the model was deemed suitable for studying the main characteristics of the field for our application and relevant for the comparison between different designs and targeting strategies.
6) Targeted Brain Regions
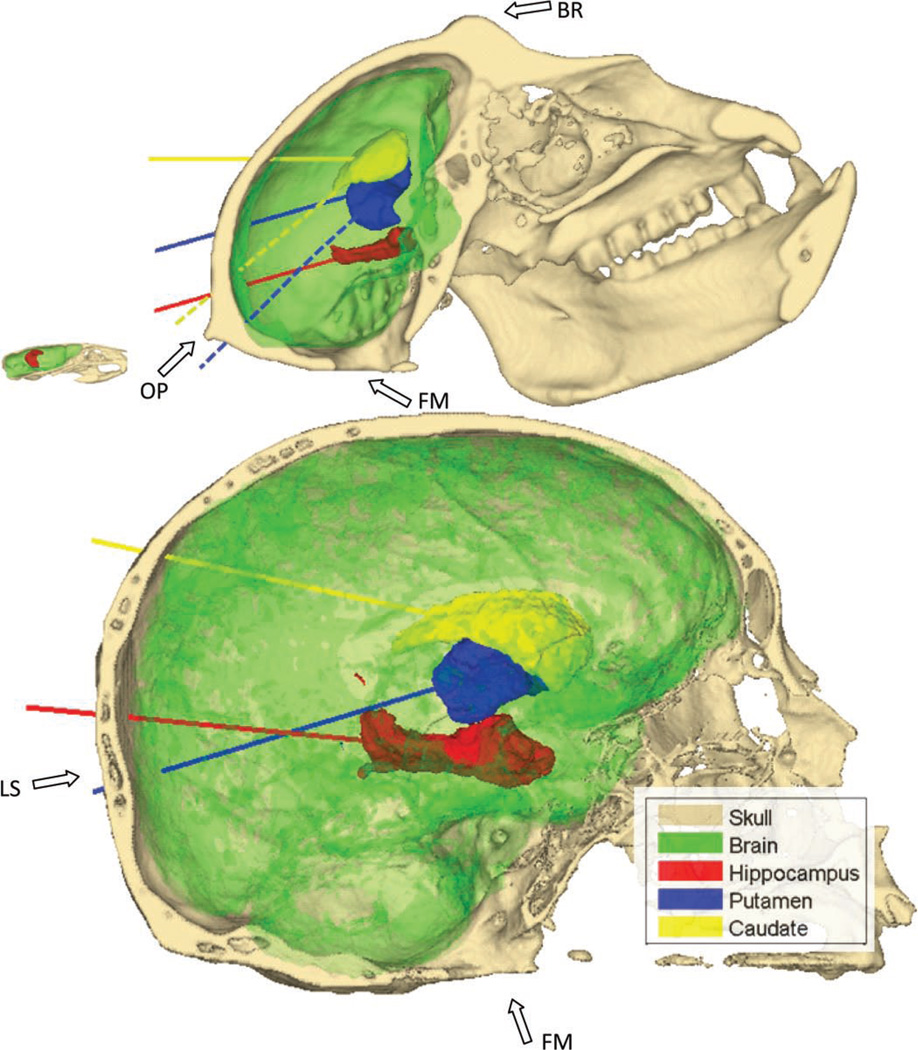
The study aims at investigating the use of single-element transducers for transcranial focusing in clinically relevant targets, especially those involved in Alzheimer’s and Parkinson’s disease. The hippocampus, highlighted in red in Fig. 4 (references to color refer to the online version of this figure), was chosen for its predominant role in Alzheimer’s disease [40]. The striatum, the predominant structure of the basal ganglia, which encompass the putamen (blue in Fig. 4) and the caudate nucleus (yellow in Fig. 4), was chosen because of its role in the dopamine pathway, a pathway severely altered by Parkinson’s disease [39]. The substantia nigra, a very small structure in the basal ganglia, is known to play an important role at the beginning of the dopamine pathway and could also be targeted depending on the drug used and the state of the disease.
Fig. 4.
Representations of the three targeted structures, the hippocampus (red) and the putamen (blue) and the caudate (yellow), both parts of the basal ganglia. The axes chosen for the orientation of the transducer in the simulation are also represented. The mouse skull is also represented and skulls are to scale. FM denotes the foramen magnum hole, LS the lambdoid suture, OP the occipital protuberance, and BR the brow ridge. The dashed lines (for the primate skull only) represent the main axes of the putamen (blue) and the caudate (yellow) that were not used because they pass through the occipital protuberance. References to color refer to the online version of this figure.
Those structures were identified for all species using 3-D brain atlases. The rhesus monkey atlas was provided by the University of North Carolina [58]. The human atlas used is the publicly available International Consortium for Brain Mapping (ICBM) template from the Laboratory of Neuro Imaging [59].
After segmentation of the intra skull volume based on the CT scans, the brain atlases were registered with respect to their respective skulls using affine transformation (translation, rotation, scaling, and shearing) in Matlab (R2008b, The Mathworks, Inc., Natick, MA). After registration of the atlases, the center of mass and long axis of each targeted structure were extracted using principal component analysis (PCA). Those features were used for the positioning and orientation of the virtual transducers to obtain good overlap between the expected focal spots and the targeted structures. The rounded dimensions of the structures are summarized in Table III.
TABLE III.
Dimensions of the Targeted Regions (mm).
| Mouse | Primate (Macaca mulatta) | Human | |||||
|---|---|---|---|---|---|---|---|
| Left hippocampus |
Left hippocampus |
Left putamen |
Left caudate |
Left hippocampus |
Left putamen |
Left caudate |
|
| Length | 2.8 | 18 | 17.5 | 19 | 46 | 35 | 43 |
| Diameter | 0.9 | 3.5 | 6 | 5.5 | 14.5 | 12.5 | 13 |
| Depth | 2.3 | 40 | 50 | 55 | 90 | 98 | 105 |
The average dimensions of the regions are later used to adapt the transducer design for each species. The mouse dimensions are provided here as a reference.
The beam axes traverse the parietal bone, close to the lambdoid suture (Fig. 4), in both the primate and human skulls cases for the hippocampus and the caudate targeting. The beam axes in the putamen targeting through the human skull will cross the occipital bone, below and next to the lambdoid suture. The rhesus monkey skull has a large occipital protuberance and brow ridge (Fig. 4) that cause high aberrations and attenuation on the ultrasound beam if found in its path, as shown later. The natural orientations of the putamen and the caudate in the primate skull render them difficult to target because their main axes, as found by the principal component analysis, would either directly pass through the occipital protuberance or yield a high incidence angle, potentially causing high aberration of the beam (see the dashed line in Fig. 4). Consequently, alternative orientations were also tested for those structures in the primate skull.
7) Transducer Design
The properties of the transducers were selected to provide a focal spot tailored to the targeted structure dimensions and with a focal length long enough to accommodate the brain structure dimensions. The active diameters of the transducers were also adapted for each frequency to provide comparable focal spot dimensions between the different cases considered. Prior estimations of the focal dimensions in water for each transducer design were computed with the Field II simulation software [60] using the conventional −3-dB definition.
For the simulated human study, a focal length of 140 mm was chosen to accommodate the depth of the targeted structures. For a 500 kHz center frequency, a focal/diameter number of 1.4 (diameter of 100 mm) was used because it provided, in water, a focal spot size of 42 mm in length and 4.5 mm in width, comparable with the sizes of the targeted brain regions. Its width is only one-third of the average diameter of the structures but it is expected that diffusion of smaller compounds inside the extracellular, extra vascular space would, eventually, help to reach a larger fraction of the targeted structure. Alternatively, for the delivery of larger compounds with a lower diffusion coefficient, it would still be possible to mechanically move the transducer and repeat the sonication, effectively covering the full targeted structure. At this frequency, the acoustic focus shift was estimated to be around 2 mm in water. A change in the frequency used required the use of a different diameter to maintain the same focal spot dimensions. Consequently, a 42 mm diameter was used at the frequency of 700 kHz (focal spot dimensions: 40 × 3.4 mm) and a 128 mm diameter at the frequency of 300 kHz (focal spot dimensions: 40 × 5.2 mm).
In the primate study, a transducer with a focal length of 90 mm was simulated. An f-number of 1.25 (diameter of 72 mm) was chosen at 800 kHz, corresponding to a focal size of 2.4 × 22.2 mm in water. As in the human study, we expect diffusion effects to expand the effective drug de-livery region within the targeted structure. Frequencies of 600 kHz and 1 MHz correspond to a transducer diameter of 64 mm at 1 MHz (focal spot dimensions: 19.5 × 2 mm) and a diameter of 80 mm at 600 kHz (20.4 × 2.6 mm). These values are summarized in Table IV.
TABLE IV.
Transducer Parameters (mm).
| Primate study | Human study | |||||
|---|---|---|---|---|---|---|
| 600 kHz | 800 kHz | 1 MHz | 300 kHz | 500 kHz | 700 kHz | |
| Focal length | 90 | 90 | 90 | 140 | 140 | 140 |
| Diameter | 80 | 72 | 64 | 140 | 100 | 84 |
| Expected focal size | 21 × 2.8 | 22 × 2.4 | 22 × 2 | 40 × 5.2 | 42 × 4.5 | 42 × 3.6 |
The focal size is kept constant at all frequencies by adjusting the diameter of the transducer.
Because of the modification of the active transducer diameter, a separate simulation was performed at each frequency. The frequency study was thus performed only in the hippocampus for each skull case and was assumed to yield similar behavior in other regions.
C. Maximum Pressure Field Simulation and Analysis
The maximum pressure field was computed using 20 samples over a single period in the assumed stationary state. The simulation durations were set to 200 µs for the human skull and 150 µs for the monkey skull corresponding to a propagation distance of 30 cm and 24 cm, respectively, i.e., at least twice the brain dimension in the beam direction. For the 300 kHz frequency in the human case, a longer time of propagation, 300 µs, was simulated to compensate for the lower attenuation. Longer durations did not yield significant changes in the pressure field but required lengthy computations. The combination of successive reflections (reflection coefficient on the brain/skull interface estimated to be 0.7), attenuation in the brain (10 Np/m/MHz) and the diffraction of the reflected wave on the non-planar skull interface significantly reduces the contribution of the wave after the simulation time. As shown in Fig. 7(b), the standing waves, related to the incident and reflected waves amplitudes, decrease rapidly upon a first reflection at the brain-skull interface.
Fig. 7.
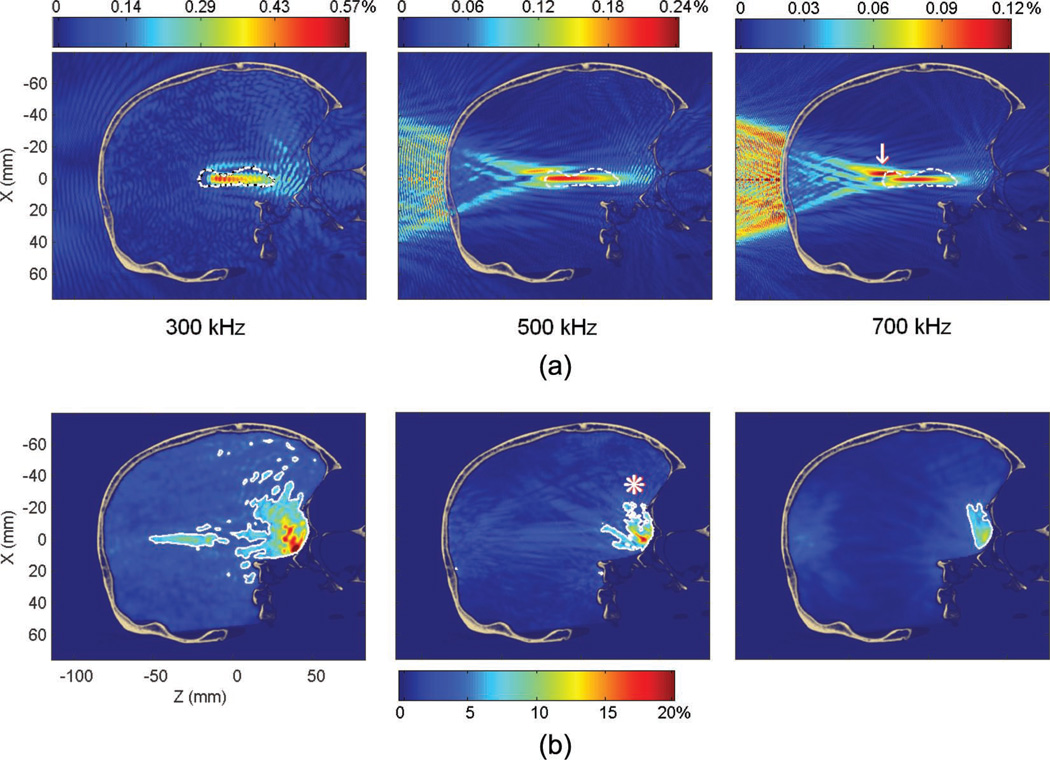
(a) Pressure fields at 300, 500, and 700 kHz (in percent of the peak pressure in water for the same frequency). The dashed line denotes the contour of the hippocampus. The white arrow indicates the secondary peak at the 700 kHz frequency. (b) Standing wave amplitude (in percent of the peak pressure through the skull at a given frequency). The white contour denotes the volume where the modulation amplitude is higher than 5% of the peak pressure through the skull. This volume decreases with the frequency from 3.7% (at 300 kHz) to 0.23% (at 700 kHz) of the brain volume. The white asterisk indicates the primary brain-skull interface where most of the standing wave effects are concentrated.
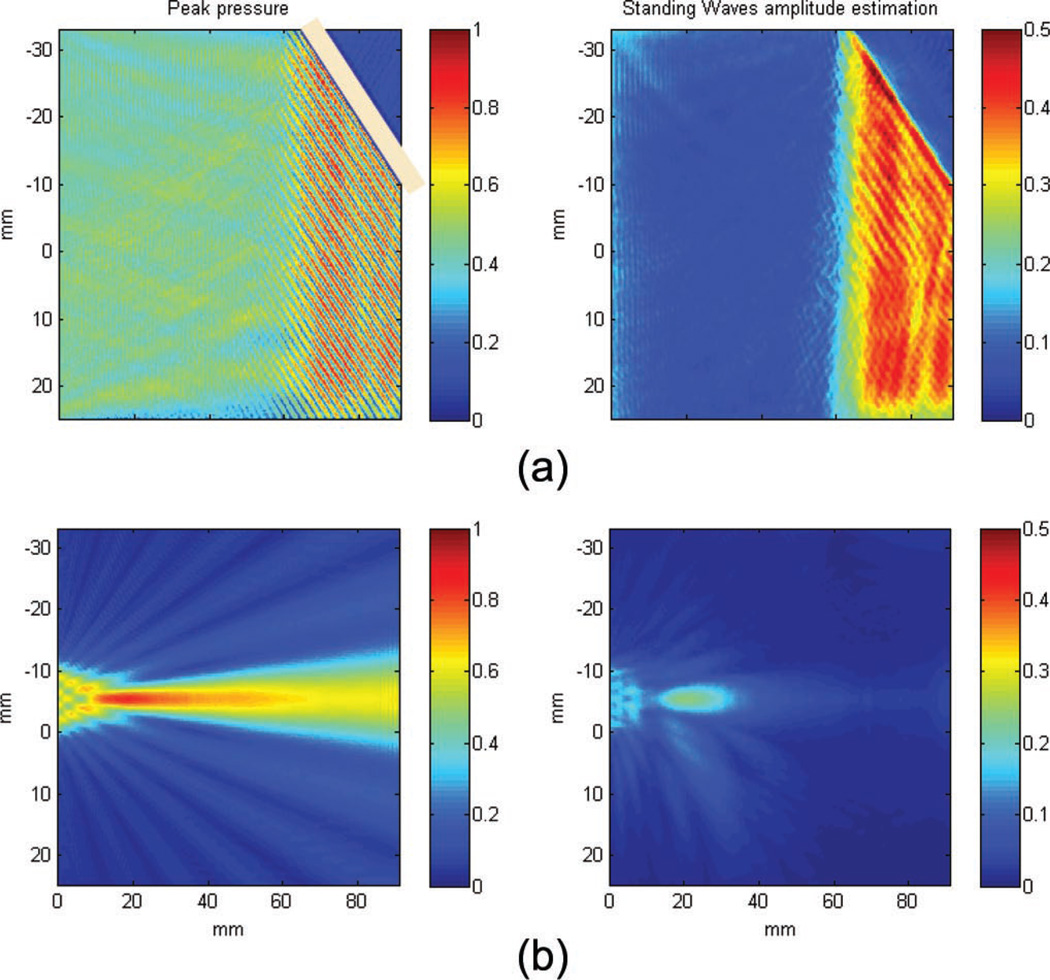
Standing waves were estimated using a filter designed to quantify a characteristic pattern: the spatial modulation of the pressure field caused by constant constructive and destructive interferences [36], [37]. The filter consists of three parts: first, the fast oscillations of the field are extracted along each dimension by a high-pass spatial filter (11th-order Butterworth filter) with a cut-off frequency of 2/λ. A Hilbert transform is then applied to obtain the envelope of these high frequency modulations, the results is a low-frequency field whose amplitude is equal to the amplitude of the high frequency component of the peak pressure field along one dimension. Finally, the maximum of the three components x, y, and z is taken to provide a single map. The resulting field estimates the maximum of the spatial modulation pattern which is, in most cases, associated with the presence of a standing wave. An example of the filter on simulated data is given in Fig. 5(a), a plane wave reflected on a 45° interface (with the same impedance as the skull) will yield a stationary wave caused by the interferences between the incident and reflected fields with constant phase difference. A focused wave can generate some slight artifacts caused by high spatial frequencies of the focal spot in the transverse direction [see Fig. 5(b)].
Fig. 5.
Standing waves amplitude estimation examples. (a) Plane wave reflected on a 45° interface; the interference of the incident and reflected waves yield a stationary wave with a typical spatial modulation which is detected by the filter. (b) In the case of a focused wave, the high spatial frequencies occurring around the focal spot can yield small artifacts in the detection.
For every case, peak attenuation and peak displacements compared with water are provided. A rough quantification of the targeting properties is performed. The percent-of-target-overlapped parameter estimates the percent volume of the target above the half-pressure threshold, i.e., a 100% value indicates the best case, in which the beam encompasses the entire volume of the targeted structure with a pressure higher than half of the peak pressure. Note again that the diffusion effect will allow delivered drugs to cover a larger volume ratio than the beam itself. The percent-of-beam-overlapping-target parameter estimates the volume fraction of the beam above half of the peak pressure that falls inside the targeted region. A 100% value thus indicates the best case, where the beam does not overlap with any collateral structure. Values for targeting in water (i.e., without the skull in place) are also provided to better assess the skull effects. Standing wave effects are estimated by calculating the ratio of their maximum amplitude to the peak pressure with skull (standing-wave-maximum-amplitude-to-peak ratio) as well as the percent volume of the brain where the standing wave amplitude is higher than 5% of the peak pressure through the skull (percent of standing wave volume in brain). This arbitrary threshold was chosen to be high enough so as to yield nonzero values and low enough so as to ensure that most regions where standing wave formation could occur were taken into account; the threshold is fixed for all simulations to facilitate comparison.
D. Standing Wave Reduction
Avoidance of standing wave full formation could be necessary to limit the probability of enhanced cavitation effects caused by microbubbles trapped in antinodes [38], [60]. Additionally, standing waves between the transducer and the skull can lead to inconsistently transmitted pressures, depending on whether constructive or destructive interferences occur.
In one simulation case, we investigated the use of fast periodic linear chirp waveforms to limit the standing wave effects. The use of chirps is a common technique to reduce the standing wave pattern [61], [62]: by varying the frequency of the signal in time, a time-dependent phase difference between the incident and reflected waves appears. Another technique proposes the use of random frequency modulation [60] but is more difficult to test in simulations. It is important to note that the amplitude of the reflected wave is not modified, however, the constructive and destructive interferences of the waves change position over time. A standing wave interference pattern may always be present but would change localiztion between time steps. Considering a longer time scale, the effects of constructive and destructive interference will even out and the summation of both waves will appear to be incoherent.
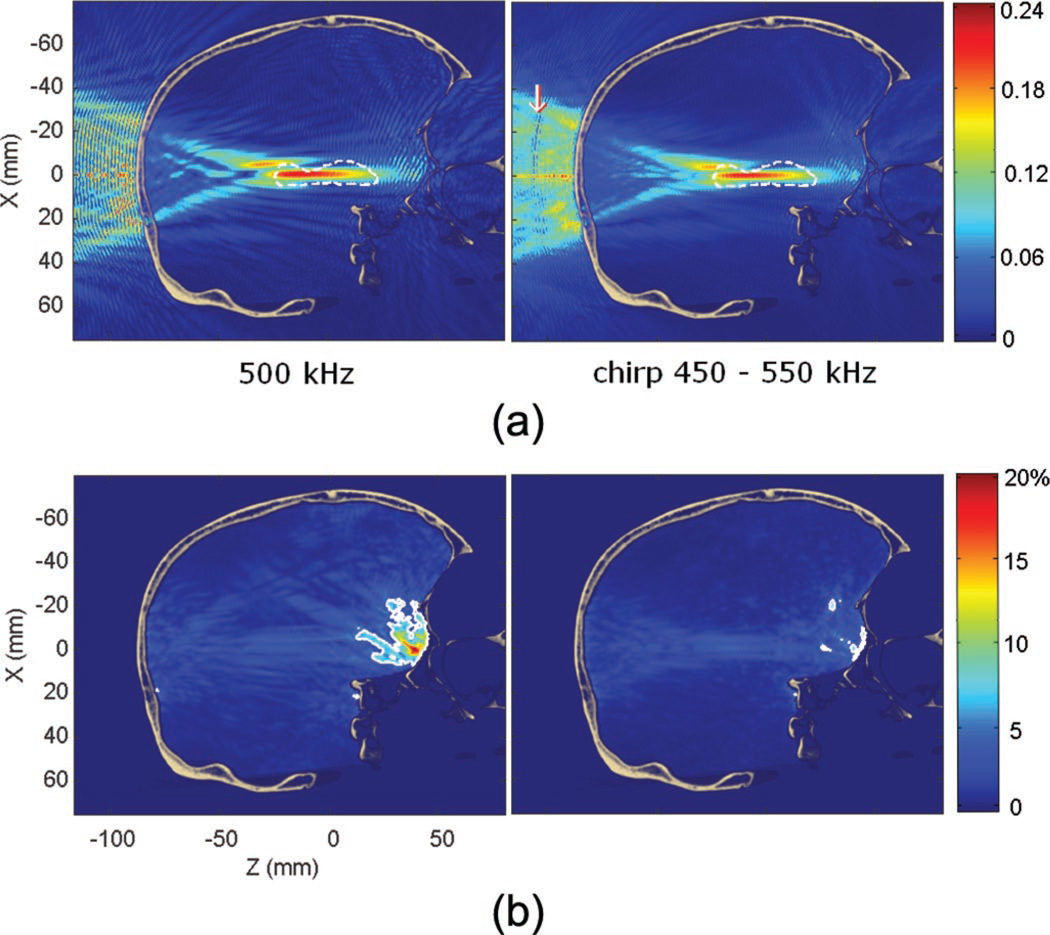
In this simulation, a fast linear chirp was selected with a period of 23 µs between 450 and 550 kHz. A periodic chirp has the drawback of leading to periodical standing wave fronts when the travel time difference between the incident and reflected waves is equal to a multiple of the period of the chirp because the wave’s frequencies will be identical (every 38.5 mm as seen in Fig. 15). However, this effect is limited because of the attenuation of the reflected wave after such a propagation distance. Moreover, a short period has the advantage of requiring only a short averaging time to suppress the standing wave. In practice, all biological or physical effects with a time-scale larger than 23 µs would be insensitive to standing waves.
Fig. 15.
(a) Pressure fields with a 500 kHz monochromatic beam and with a 450 to 550 kHz linear chirp (ratio to the peak pressure in water). Interference patterns are largely reduced by the use of the chirp. The white arrow indicates the constructive interferences every 38.5 mm caused by the duration of the chirp used. (b) Standing wave amplitude with a 500 kHz monochromatic beam and with a 450 to 550 kHz linear chirp (in percent of the peak pressure through the skull at a given frequency). The maximum is found over the entire duration of the chirp, i.e., 23 µs. The white contour denotes the volume where the modulation amplitude is higher than 5% of the peak pressure through the skull. This volume decreases from 0.87% to 0.17% of the brain volume when using a chirp.
III. Results
A. Human Skull
1) Targeting of the Hippocampus at 500 kHz Through the Human Skull
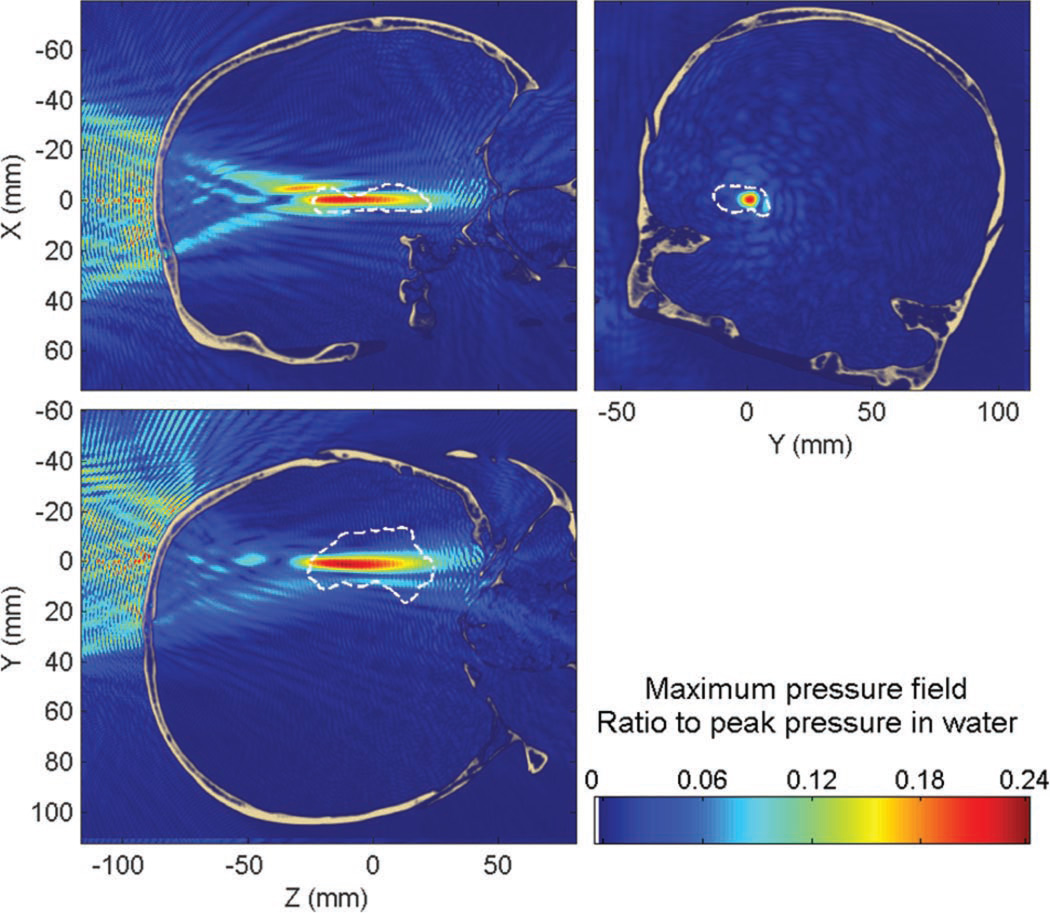
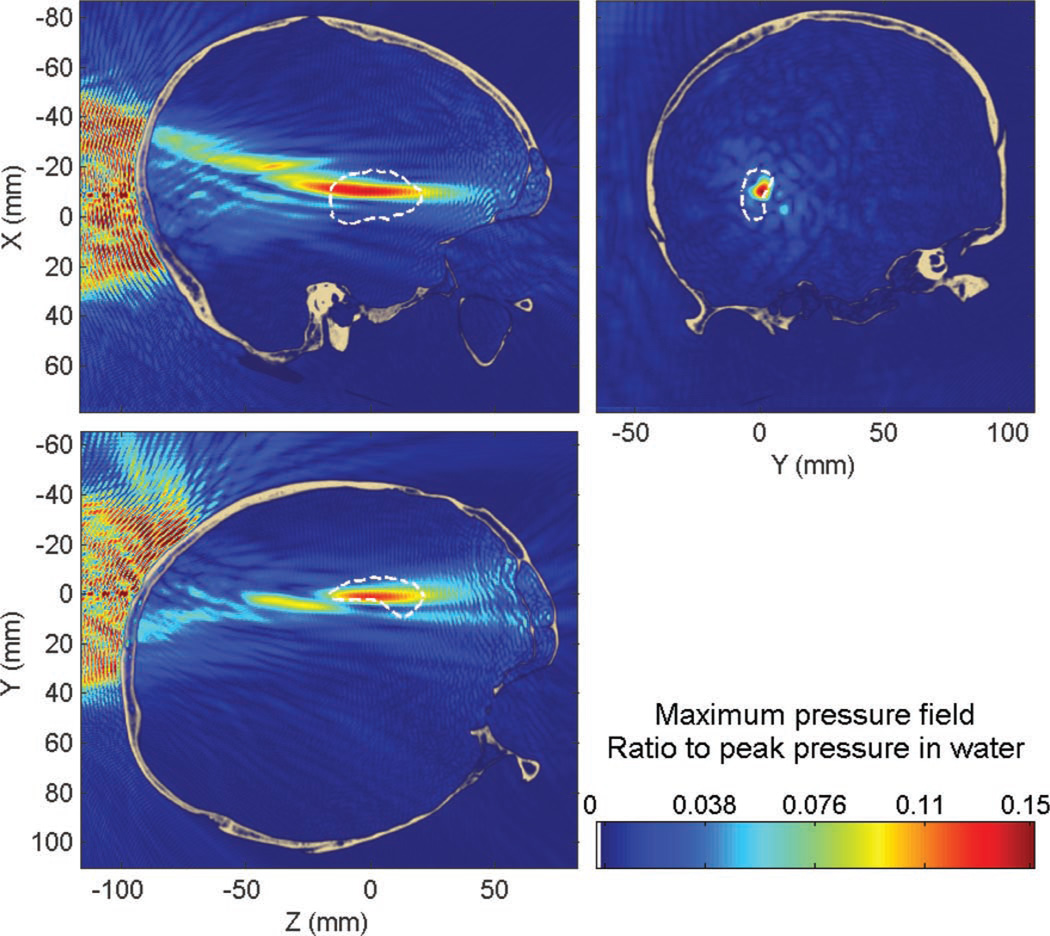
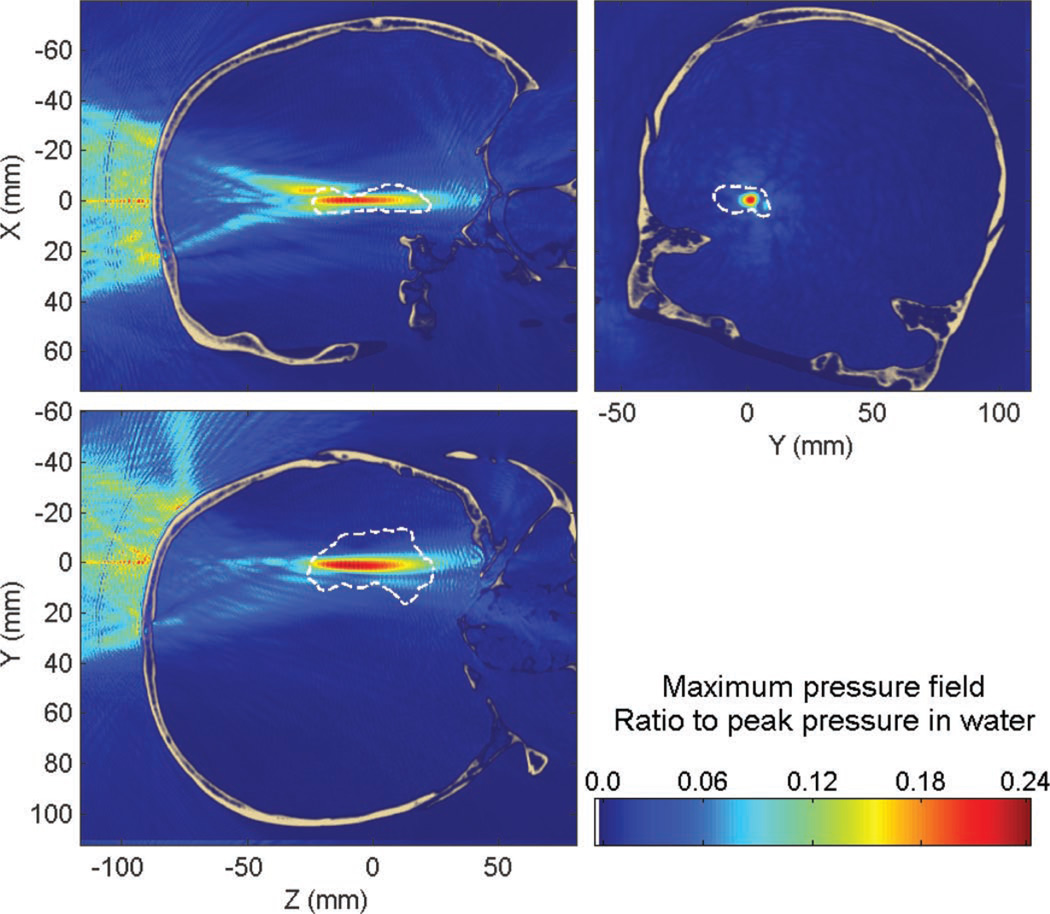
The peak pressure attenuation through the skull was found to be approximately 76% (−12 dB) compared with that in water; the peak position was displaced by approximately 13 mm (13 mm along the beam axis and 1.1 mm in the transverse plane). The percent-of-target-overlapped parameter is estimated to be around 11% (14% without the skull) and the percent-of-beam-overlapping-target parameter is around 69% (76% without the skull). These values appear to be low, although expected by the focal spot dimensions obtained in water, but diffusion of the compounds will help to reach a larger volume of the targeted structure and additional sonications can be used to increase the BBB-opened region. Overall, the targeting properties are very similar whether in the absence of in the presence of the skull (except for the attenuation of the beam) and prototyping of the focal spot dimensions in water can thus be reasonable while allowing future research to concentrate on homogenizing the pressure field within the target volume. Some typical standing wave interference patterns are visible (Fig. 6), both between the skull and the transducer, but also inside the brain close to the skull interface, which is visible in Fig. 7.
Fig. 6.
Maximum pressure field at 500 kHz while targeting the hippocampus through the human skull. Dashed white line denotes the contour of the hippocampus.
Standing waves are concentrated close to the skull interface (Fig. 6), where both incident and reflected waves have high amplitudes, and slowly decrease away from this region. The peak amplitude of standing waves was found to be 19% of the peak pressure in the presence of the skull. Only 0.87% of the brain volume was found to have a significant standing wave effects, higher than 5% of the maximum peak pressure through the skull.
2) Targeting of the Hippocampus at 300, 500, and 700 kHz Through the Human Skull
The 300 and 700 kHz frequencies were investigated using the parameters shown in Table IV. The results of the simulations are summarized in Table V.
TABLE V.
Targeting Features for the Hippocampus Through the Human Skull at Different Frequencies.
| 300 kHz | 500 kHz | 700 kHz | |
|---|---|---|---|
| Peak attenuation | 42% | 76% | 88% |
| Peak displacement | 8.3 mm axial + 1.8 mm lateral | 13 mm axial + 1.1 mm lateral | 28 mm axial + 3.8 mm lateral |
| Percent of target overlapped | 13% (21% without the skull) | 11% (14% without the skull) | 10% (12% without the skull) |
| Percent of beam overlapping target | 91% (85% without the skull) | 69% (76% without the skull) | 56% (84% without the skull) |
| Standing waves maximum amplitude | 26% | 19% | 14% |
| Standing waves volume | 3.7% | 0.87% | 0.23% |
At 700 kHz, the secondary peak, already visible at 500 kHz (Fig. 6), had higher amplitude than the main lobe, leading to very large peak displacement (28 mm axially). The volume of standing waves (where the spatial modulation amplitude is higher than 5% of the peak pressure through the skull at the same frequency) is further reduced with frequency. Because of the very low attenuation in the 300 kHz case, the steady state was assumed to be at 300 µs instead of 200 µs. By taking into account the tradeoff between beam attenuation, aberration, and standing waves, the 500 kHz frequency was used for the other targeted structures through the human skull for the remaining of this study.
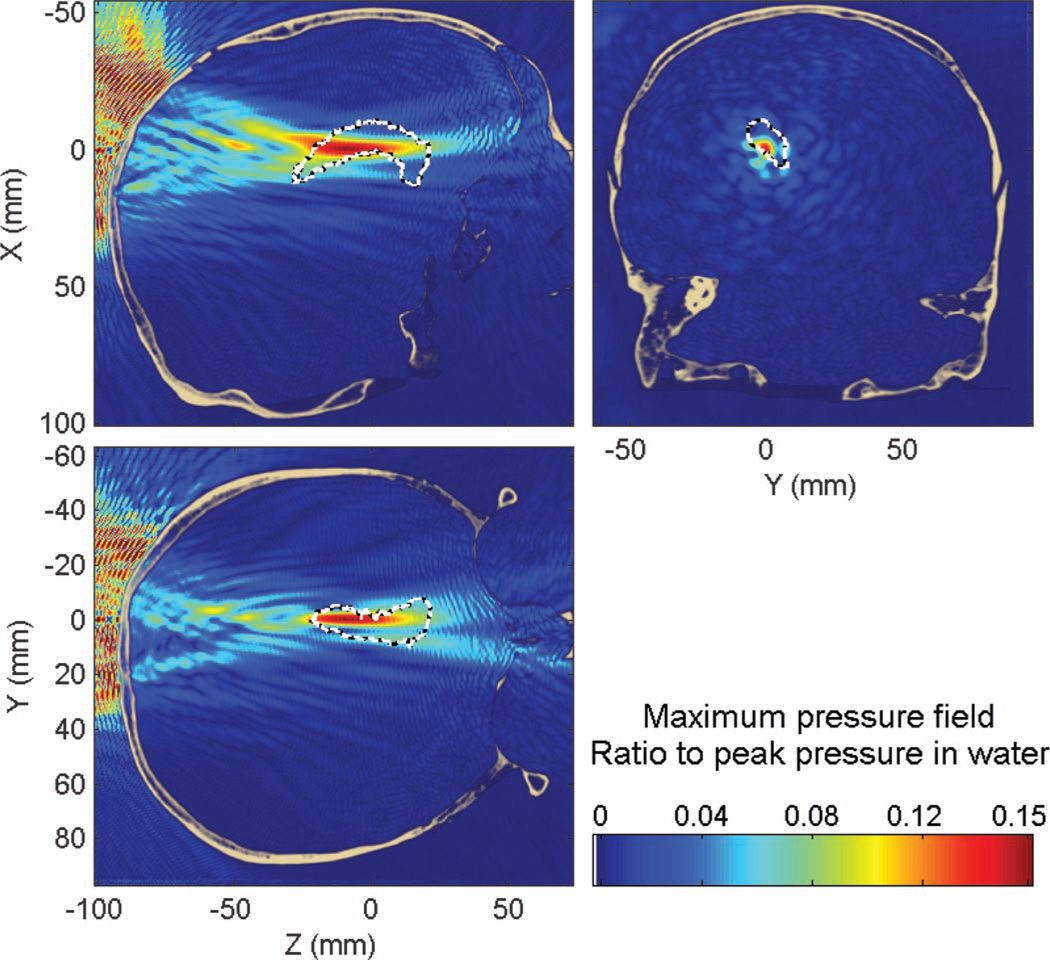
3) Targeting of the Putamen at 500 kHz Through the Human Skull
When targeting the putamen at 500 kHz, the peak pressure was attenuated by approximately 85% (−16 dB) compared with that in water, the peak position was displaced by approximately 3.9 mm (3.5 mm along the beam axis and 1.8 mm in the transverse plane). The percent-of-target-overlapped parameter was estimated to be around 22% (19% without the skull) and the percent-of-beam-overlapping-target parameter around 28% (69% without the skull). The maximum pressure field can be seen in Fig. 8. The higher attenuation (76% for the hippocampus targeting to 85% for the putamen targeting), and the larger decrease of the percent-of-beam-overlapping-target parameter compared with water (69% in water compared with 28% through the skull) exhibit a stronger defocusing skull effect than in the targeting of the hippocampus.
Fig. 8.
Maximum pressure field at 500 kHz while targeting the putamen through the human skull. Dashed white line denotes the contour of the putamen.
The peak amplitude of standing waves was found to be 17% of the peak pressure through the skull. 1.5% of the brain was found to have a standing-wave component higher than 5% of the maximum peak pressure with the skull; this volume was also concentrated around the beam-skull interface as seen in Fig. 8.
4) Targeting of the Caudate at 500 kHz Through the Human Skull
When targeting the caudate (see Fig. 9), the peak pressure was attenuated by approximately 84% (−16 dB) compared with that in water, the peak position was displaced by approximately 8.8 mm (8.8 mm along the beam axis and 0.8 mm in the transverse plane). The percent-of-target-overlapped parameter was estimated to be around 24% (17% without the skull) and the percent-of-beam-overlapping-target parameter around 36% (68% without the skull). The targeting of the caudate is thus very similar to the targeting of the putamen, with a defocusing effect a bit stronger than for the targeting of the hippocampus.
Fig. 9.
Maximum pressure field at 500 kHz while targeting the caudate through the human skull. Dashed white line denotes the contour of the caudate.
The peak amplitude of standing waves was found to be 20% of the peak pressure through the skull. 1.1% of the brain was found to have a standing wave component higher than 5% of the maximum peak pressure with the skull. Those values are comparable to the standing wave effects estimated in the case of the putamen and hippocampus targeting at the same frequency.
B. Primate Skull
1) Targeting of the Hippocampus at 800 kHz Through the Primate Skull
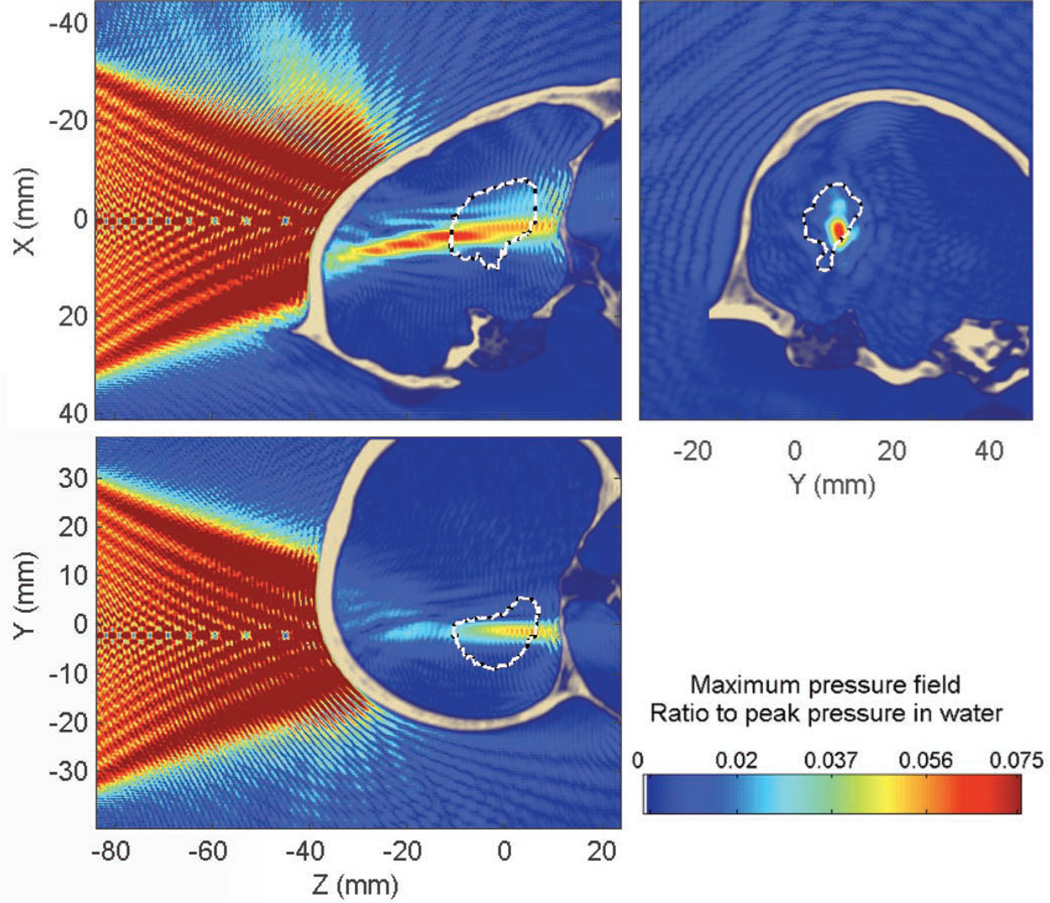
This section shows the results obtained with targeting of the hippocampus through the primate skull at 800 kHz. Attenuation through the primate skull was approximately 80% (−14 dB) compared with water, the peak position was displaced by approximately 6.4 mm (6.2 mm along the beam axis and 1.6 mm in the transverse plane). The percent-of-target-overlapped parameter was estimated to be around 18% (17% without the skull) and the percent-of-beam-overlapping-target parameter (target volume with pressures above 50% of the peak) was around 31% (72% without the skull). In that case, the percent-of-beam-overlapping-target parameter, through the primate skull, was halved. Here, most of the BBB-opened volume would be in the collateral structure surrounding the hippocampus. This is probably due to the aberrations and attenuation caused by the occipital protuberance (Fig. 4) and illustrates some of the challenges specific to the primate skull and not present in the human skull.
Similar to the human skull case, standing waves are concentrated close to the skull interface (Figs. 10 and 11). The maximum amplitude of the standing waves was found to be 13% of the peak pressure through the skull. A volume of 1.4% of the brain was found to have a standing wave component higher than 5% of the maximum peak pressure within the skull.
Fig. 10.
Maximum pressure field at 800 kHz obtained when targeting the hippocampus through the primate skull. White dashed line denotes the hippocampus contour. Part of the beam is absorbed when passing through the occipital protuberance (see Fig. 4).
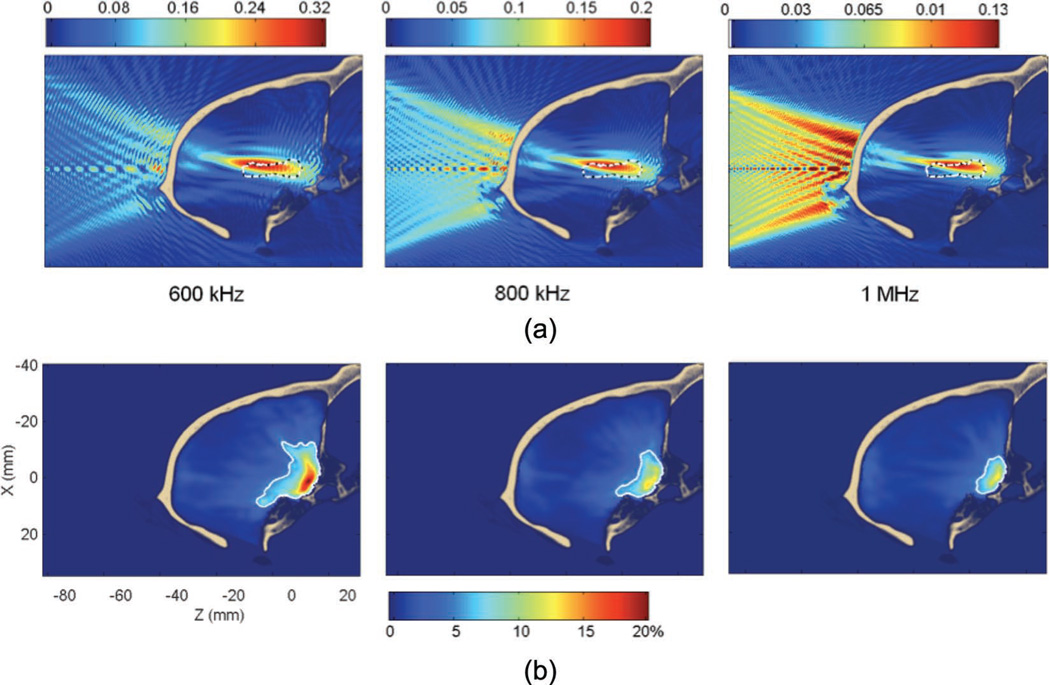
Fig. 11.
Standing wave amplitude at 600, 800, and 1000 kHz (in percent of the peak pressure through the skull at a given frequency). The white contour denotes the volume where the modulation amplitude is higher than 5% of the peak pressure through the skull. This volume decreases with the frequency from 3 to 0.64% of the brain volume.
2) Targeting of the Hippocampus at 600 kHz, 800 kHz, and 1 MHz Through the Primate Skull
The 600-kHz and 1-MHz frequencies were investigated using the parameters shown in Table IV. The results of the simulations are summarized in Table VI. When increasing the frequency from 600 kHz to 1 MHz, the attenuation increased from 68 to 87%, whereas the peak displacement remained constant (around 5 mm). The standing wave volume decreased from 3 to 0.64% of the brain volume, the interference patterns can be seen in Fig. 11 to disappear progressively with the frequency. Throughout the rest of this study, 800 kHz was used because it provided lower standing waves than the 600 kHz frequency. The 1-MHz frequency was not used, in an attempt to avoid larger aberrations for the targeting of the putamen and the caudate through the primate skull.
3) Targeting of the Putamen at 800 kHz Through the Primate Skull
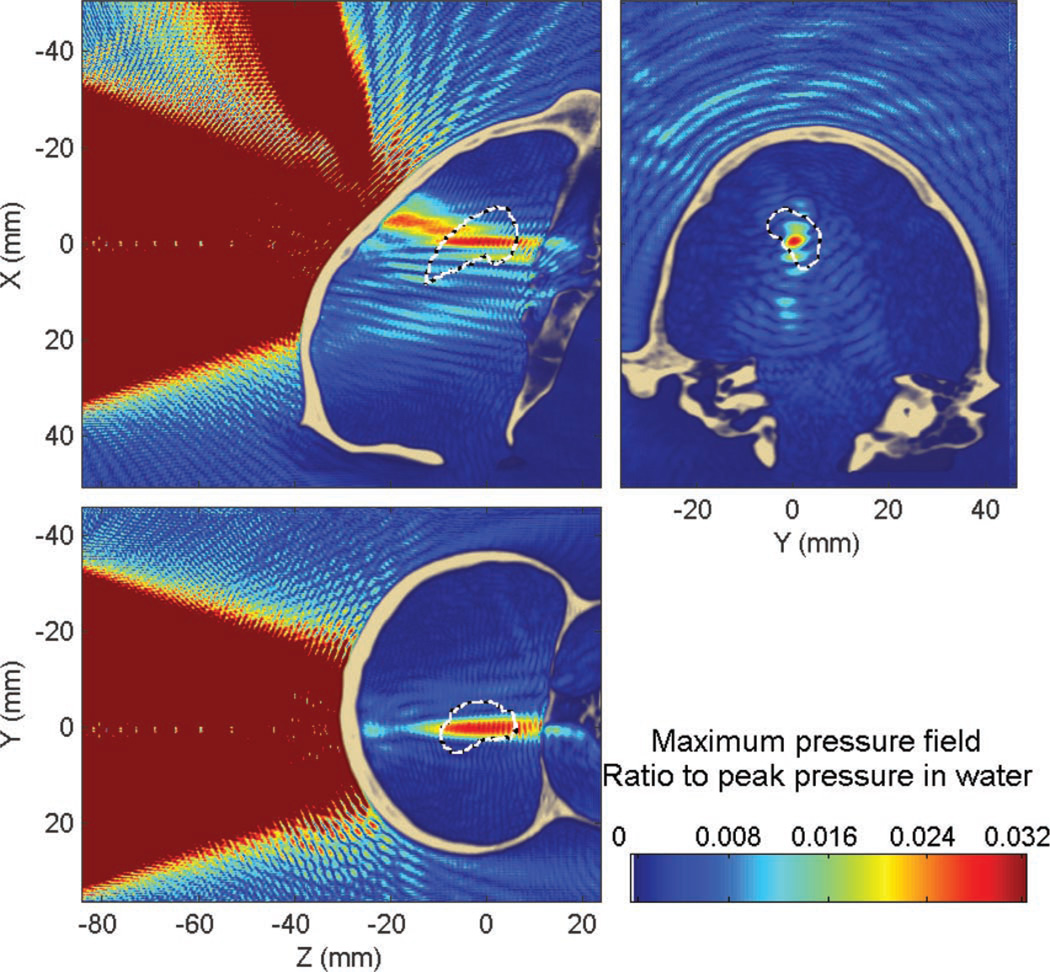
When targeting the putamen at 800 kHz, the peak pressure was attenuated by 93% (−23 dB) compared with that in water, the peak position was displaced by approximately 9.5 mm (9 mm along the beam axis and 3.1 mm in the transverse plane). The percent-of-target-overlapped parameter was estimated to be around 12% (10% without the skull) and the percent-of-beam-overlapping-target parameter around 22% (74% without the skull). The maximum pressure field can be seen in Fig. 12.
Fig. 12.
Maximum pressure field at 800 kHz obtained when targeting the putamen through the primate skull. White dashed line denotes the putamen contour. Compared with the more favorable targeting of the hippocampus, the attenuation increases from 80% to 93% with strong secondary peaks.
The peak amplitude of the standing waves was found to be 24% of the peak pressure through the skull. 1.9% of the brain was found to have a standing wave component higher than 5% of the maximum peak pressure with the skull. The overall poor results of the targeting of the putamen compared with the hippocampus are thought to be due to the geometry of the primate skull and the higher incident angle of the beam in that case (Fig. 12).
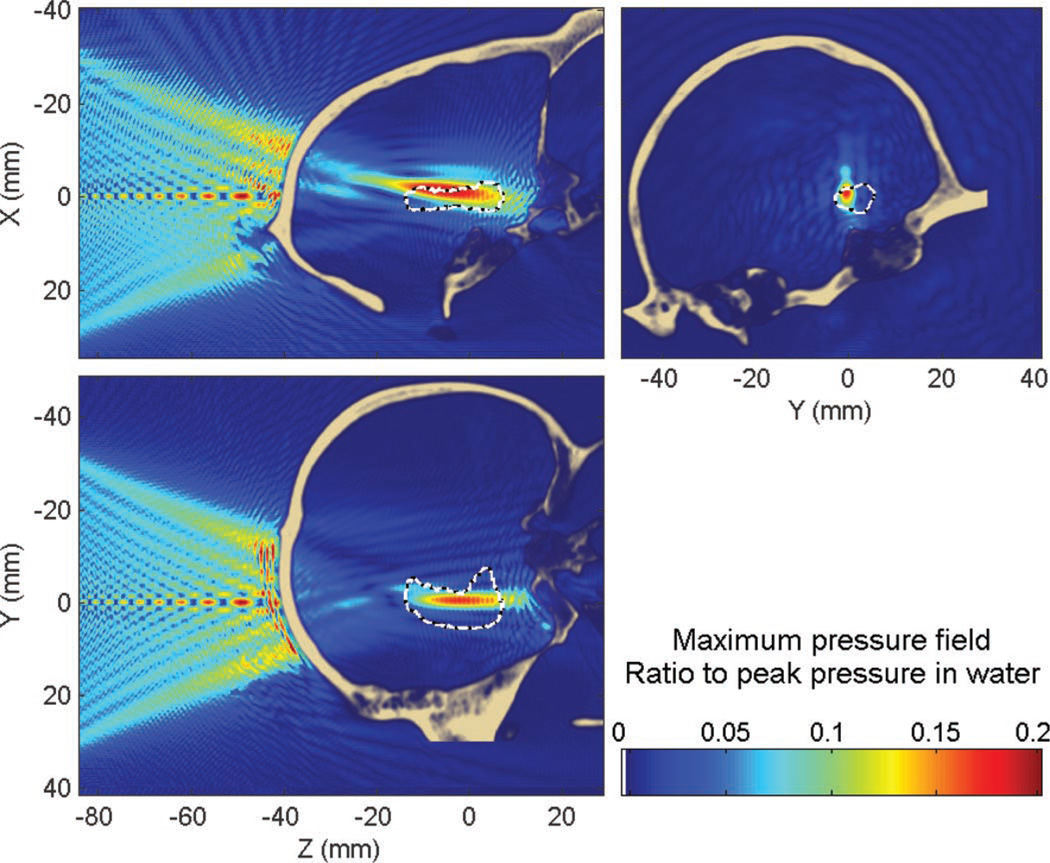
4) Targeting of the Caudate at 800 kHz Through the Primate Skull
When targeting the caudate (see Fig. 13), the peak pressure was attenuated by approximately 97% (−30 dB) compared with that in water, the peak position was displaced by approximately 0.69 mm (0.4 mm along the beam axis and 0.57 mm in the transverse plane). The percent-of-target-overlapped parameter was estimated to be around 14% (10% without the skull) and the percent-of-beam-overlapping-target parameter around 36% (70% without the skull). The peak amplitude of standing waves was found to be 19% of the peak pressure through the skull. 2.2% of the brain was found to have a standing wave component higher than 5% of the maximum peak pressure obtained with the skull in place. Those results are comparable to those obtained in the case of the putamen targeting with a very high attenuation due to the high incident angle and large reflected components (Fig. 13). In those cases, alternative beam paths need to be identified.
Fig. 13.
Maximum pressure field at 800 kHz obtained when targeting the caudate through the primate skull. White dashed line denotes the caudate contour. The large incidence angle caused by the primate skull curvature leads to a strong reflected wave and an extremely high attenuation (97%).
C. Standing Wave Reduction
This section shows the results of the targeting of the hippocampus through the human skull using a linear chirp to reduce the standing wave effects.
In Fig. 14, standing wave interference patterns were nearly entirely eliminated from the maximum pressure field compared with Fig. 6. Their maximum amplitude was found to be 12% of the peak pressure through the skull. Only 0.17% of the brain volume was found to have a significant standing wave component (higher than 5% of the maximum peak pressure through the skull). The reduction is thus significantly reduced by a factor of five compared with the monochromatic case, where this volume was estimated around 0.87%. However, regarding the standing wave amplitude (see Fig. 15), the reduction is not as significant (1.5 times reduction). This is probably because, close to the skull interface, the time delay between the incident and reflected waves is so small that the frequency shift is not as significant. The overall feasibility and physiological relevance of the chirp method is discussed in the next section.
Fig. 14.
Maximum pressure field while targeting the hippocampus through the human skull with a linear chirp (450 to 550 kHz). Dashed white line denotes the contour of the hippocampus.
IV. Discussion
The study presented in this paper showed that focusing through the skull with a single spherical transducer at relatively low frequencies (500 to 800 kHz) is suitable for BBB opening because a well-formed focal spot can be obtained in all regions targeted. As expected, aberrations by the skull generate a displacement of the pressure peak, estimated here to be less than 2 mm laterally and around 1 cm in the axial direction. The displacement increases with frequency, as aberrations effects increase because the spatial variation of the skull thickness appears to be greater relative to the wavelength. This is consistent with the estimation of the correlation lengths, presented in Table II, which decrease with frequency. The correlation length is computed by estimating the average distance L between two points of the skull, so that the correlation value of the two signals passing through those points decreases to 0.5, the smaller it is and the more aberrating the medium is. Although the correlation lengths were found to be larger in the case of the primate skull than in the human skull at the same frequency, the overall aberrations are nonetheless higher in the case of the primate skull. This is due to the higher incidence angle and the beam passing close to the highly aberrating structures such as the occipital protuberance, which was not the case through the parietal bone.
Using a threshold for the half-pressure, it was possible to estimate the targeting efficiency using the percent-of-target-overlapped parameter, which indicates the percent volume of the targeted structure reached by the beam. The percent-of-target-overlapped parameter was found, in most of the cases, to be comparable to what it would be without the skull, which shows that the targeting is barely affected by the presence of the skull at these frequencies. However, with the transducer design tested, a single sonication location could cover only between 11% and 30% of the targeted volume, thus requiring mechanical movement of the transducer to cover a larger proportion of the target in the case where the diffusion would be insufficient or in the case where the entire structure would have to undergo BBB opening, depending on the treatment used.
The percent-of-beam-overlapping-target parameter indicated the proportion of the field above the half-pressure threshold that is in the targeted structure. In the human case, it was around 75%, thus comparable to the case without the skull, indicating that most of the blood-brain-barrier opening would occur within the targeted structure. However, in the case of the primate skull, where the skull geometry is more complex, the percent-of-beam-overlapping-target parameter decreased significantly. This indicates that a larger blood-brain-barrier opened region may occur in a proximal region rather than inside the intended target. The beam path should avoid thick bone structures (Occipital protuberance and brow ridge) as well as high incident angles, which was not satisfied in the case of targeting of the putamen and the caudate nucleus through the primate skull (see Fig. 4). Also, albeit counter-intuitively, the primate skull appears to be more challenging than the human skull for the targeting of the putamen and the caudate nucleus because of its complex geometry and a less favorable natural orientation of the basal ganglia.
Attenuation has been found to vary between 65% and 97% (−10 and −30 dB) compared with water depending on the geometry and frequency. For the same skull and frequency, the attenuation can vary greatly (76% to 85% (−12 to −16 dB) in the human skull and 80% to 97% (−14 to −30 dB) in the primate skull) with the region targeted depending on the geometry of the skull that lies in the beam path, affecting thus the blood-brain-barrier opening consistency. The heat deposition associated with those high attenuation values will be concentrated in the skull, where both absorption and pressure amplitude are high. Our hope is that, despite the low efficiency of the method compared with aberration-corrected HIFU devices, the need for lower pressure at the focus and shorter duration to induce BBB opening, will lead to similar or lower temperature elevation. The accuracy of this hypothesis will need to be investigated in future work with a non-linear propagation code that will take into account thermal diffusion and validated with experiments.
Based on the results obtained, several design improvements are identified. First, more suitable beam orientations can be implemented to avoid both higher incident angles and specific bone structures known to cause higher aberration such as the occipital protuberance in the primate (see Fig. 4). This selection might not be trivial, because the beam axis will still need to take into account the orientations and shapes of the targeted regions. Limiting those geometrical effects will help to reduce the attenuation effect and its variation. Second, the beam dimensions can be adjusted to overlap with those of the targeted structures, especially laterally. As proposed in this study, it is still possible to use two or three successive sonications to cover the targeted volume by mechanically moving the transducer. Additionally, defocusing approaches, such as the off-axis rotation of the transducer or the use of a toroid-shaped transducer [63], could be used to widen the focal region. Unlike transcranial HIFU, the formation of a wide focal region with low but uniform and consistent pressure will be ideally suited to the blood-brain-barrier opening method.
A method to estimate the standing wave effect based on the analysis of the interference pattern of the pressure field was implemented and illustrated on simple test simulations. In all cases, the maximum amplitude of the standing waves was under 20% of the peak pressure through the skull. Using a relatively low threshold of 5% of the maximum peak pressure through the skull, it is possible to assess the extent of the standing waves. This region, where the standing wave effect may be significant, was small in all skull and orientation cases, i.e., less than 2% of the brain volume and decreasing with frequency, as the tissue absorption increased. However, the implication of these values is difficult to interpret, as there is currently no way to relate them quantitatively to physiological effects and safety. Large standing-wave amplitudes during long application times are believed to increase the risk of hemorrhage as illustrated by the TRUMBI sonothrombolysis study with a total cumulative active sonication duration longer than 4 min at 300 kHz [34], [36]. It is not known, however, if any effects occur at the shorter sonication durations used in BBB-opening studies (12 s of cumulated active sonication duration in our case [10]). Moreover, in BBB-opening studies, injected microbubbles lower the pressure cavitation threshold [1], [64] inside the brain capillary network, whereas the brain parenchyma, because of its lack of microbubbles, should remain relatively more resistant to mechanical effects and their possible damage. Ultimately, in vivo physiological effects of standing waves with short sonication times and microbubbles will need to be assessed and quantified to answer this question.
Acknowledging the uncertainties surrounding in vivo standing wave effects, we tried to further reduce their formation using fast linear chirps. Interferences appear to be no longer stationary and the brain volume with significant standing wave amplitude, i.e., greater than 5% of the peak pressure through the skull, is reduced by a factor of five. The standing wave maximum amplitude only decreased from 19% to 12% because of the localization of the maximum close to the skull interface where the chirp method is less efficient because the frequency shift between the reflected and incident waves is not significant. Generally, the technique will smooth out the nodes and antinodes for all physical or physiological effects slower than 20 µs. However, whether all mechanical effects such as inertial cavitation or trapping of microbubbles at the antinodes are slow enough for the technique to be effective remains to be investigated. This interaction can be very complex because microbubbles, confined in the brain capillary network, may not be free to follow the antinode locations.
Finally, following this preliminary feasibility study, a preliminary protocol for BBB opening with a single-element transducer can now be proposed. Several strategies might be used for the localization of the targeted structures. Tabulated values for the coordinates and orientation of the structures based on the average over a population could be used. If necessary, some a priori mechanically based corrections could also be applied based on the head size to improve accuracy. Finally, for best accuracy, true automatic segmentation of the targeted structures using prior MRI data of each subject could be used to find the structures and determine the best sonication path for each case. Because MRI is typically performed in the case of Alzheimer’s and Parkinson’s diagnosis and monitoring, such data will be readily available. Rough mechanical compensations for the focus displacement, such as the skull lens effect, could thus also be implemented with MRI guidance. Using a stereotactic frame, the transducer would then be positioned and aligned with the structure’s main axis; such a mechanical device could be very similar to that used for the positioning and guidance of direct injection needle in deep-seated structures [65]. Additionally, if the internal pressure cannot be accurately predicted, a progressive increase of the pressure could be used together with a monitoring technique such as passive cavitation detection [42], [66] or gadolinium imaging by MRI [43]. Finally, as suggested previously, the transducer could be moved laterally to increase the targeted volume and cover the entire region that needs to be treated, depending on the extent of the disease. This system can thus remain low cost and simple to implement and applied in the clinic where repeated applications in conjunction with systemic drug delivery are needed.
V. Conclusion
Using numerical simulations, we proposed a possible setup for the transcranial ultrasound focusing to induce opening of the blood-brain barrier through the human and primate skulls. With a single-element spherically focused transducer, driven at the intermediate frequencies of 500 to 800 kHz, we were able to target, in silico and for both skulls, clinically relevant deep-seated structures: the hippocampus and the basal ganglia, involved in Alzheimer’s and Parkinson’s disease, respectively. In all cases tested, a sufficiently large, uniform focal spot was formed within the targeted structures, thus demonstrating the capability of this simple system to induce, at a suitable pressure, a localized blood-brain-barrier opening at the center of the targeted brain region. The BBB-opened-region could then be further increased by using multiple sonication locations or investigating slightly defocused transducer geometries. Standing wave contributions were also estimated, a standing wave reduction method was proposed and its feasibility was demonstrated in simulations. Therefore, because of the simple and cost-efficient design of the proposed setup, a single-element transducer, enabled by the physics behind the BBB opening and the size of the targeted brain regions, may eventually ease the implementation of BBB opening clinically for recurrent drug delivery not only in Alzheimer’s and Parkinson’s disease, but also other central nervous system diseases.
TABLE VI.
Targeting Features for the Hippocampus in the Monkey Skull for Different Frequencies.
| 600 kHz | 800 kHz | 1 MHz | |
|---|---|---|---|
| Peak attenuation | 68% | 80% | 87% |
| Peak displacement | 5.8 mm axial + 1.4 mm lateral | 6.2 mm axial + 1.3 mm lateral | 5.2 mm axial + 1.3 mm lateral |
| Percent of target overlapped | 24% (29% without the skull) | 18% (17% without the skull) | 16% (11% without the skull) |
| Percent of beam overlapping target | 36% (73% without the skull) | 31% (76% without the skull) | 26% (67% without the skull) |
| Standing waves maximum amplitude | 22% | 13% | 13% |
| Standing waves volume | 3% | 1.4% | 0.64% |
Acknowledgments
The authors thank Dr. R. De La Paz from the Columbia University Radiology department for helping with the CT scans, as well as Dr. E. Guo and Dr. X. Liu from the Bone Bioengineering Laboratory of Columbia University. We acknowledge Dr. S. Small from the Columbia Neurology department for fruitful discussion on the treatment of Parkinson’s and Alzheimer’s diseases. We also thank Dr. J. Mamou and Dr. P. Chitnis from the Riverside Institute, NY, for their help and for kindly providing us with the 500-kHz transducer. We also acknowledge the CyberLogic company for providing support and additional functionalities to their Wave 3000 software when needed.
This study was supported in part by the National Institutes of Health (R01EB009041).
Biographies
Thomas Deffieux received his Ph.D. degree in 2009 from the University Paris-Diderot in Paris, France, for his work, directed by Mickael Tanter, on ultrafast imaging and quantitative elastography techniques such as shear wave imaging and shear wave spectroscopy at the Laboratoire Ondes et Acoustique (ESPCI, Paris, France). He has since been working on numerical simulations of new transcranial focalization schemes specifically applied to the blood-brain barrier opening at the Ultrasound and Elasticity Imaging Laboratory (UEIL) at Columbia University, New York, NY.

Elisa E. Konofagou received her B.S. degree in chemical physics from Université de Pierre et Marie Curie, Paris VI in Paris, France, and her M.S. degree in biomedical engineering from Imperial College of Physics, Engineering and Medicine in London, UK, in 1992 and 1993, respectively. In 1999, Dr. Konofagou received her Ph.D. degree in biomedical engineering from the University of Houston, Houston, TX, for her work on multidimensional elastography for breast cancer diagnosis at the University of Texas Medical School, Houston, TX, then pursued her postdoctoral work in elasticity-based monitoring of ultrasound therapy at Brigham and Women’s Hospital, Harvard Medical School, Boston, MA.
Dr. Konofagou is currently an associate professor of biomedical engineering and radiology and Director of the Ultrasound and Elasticity Imaging Laboratory at Columbia University, New York. Her main interests are in the development of novel elasticity imaging techniques and therapeutic ultrasound methods, such as myocardial elastography, breast elastography, ligament elastography, harmonic motion imaging, and ultrasound-induced brain drug delivery, with several clinical collaborations in the Columbia Presbyterian Medicine Center, New York. Dr. Konofagou is a technical committee member of the Acoustical Society of America and a technical standards committee member of the American Institute of Ultrasound in Medicine. She has served on peer-review committees for the National Institutes of Health, the National Aeronautics and Space Administration, and the National Science Foundation. She also serves as an associate editor for the journal Medical Physics and as an editorial board member of the Ultrasound in Medicine and Biology journal, and is recipient of several awards, including from the Acoustical Society of America, the American Heart Association, the American Institute of Ultrasound in Medicine, the National Institutes of Health, the National Science Foundation, the Radiology Society of North America, and the Wallace H. Coulter Foundation. She is also a member of the IEEE Ultrasonics, Ferroelectrics and Frequency Control Society, the International Society of Therapeutic Ultrasound, the Acoustical Society of America, the American Institute of Ultrasound in Medicine, and the American Heart Association.
Contributor Information
Thomas Deffieux, Department of Biomedical Engineering, Columbia, University, New York, NY.
Elisa E. Konofagou, Email: ek2191@columbia.edu, Department of Biomedical Engineering, Columbia, University, New York, NY; E. E. Konofagou is also with the Department of Radiology, Columbia, University, New York, NY.
References
- 1.Mychaskiw G, Badr AE, Tibbs R, Clower BR, Zhang JH. Optison (FS069) disrupts the blood-brain barrier in rats. Anesth. Analg. 2000;vol. 91(no. 4):798–803. doi: 10.1097/00000539-200010000-00007. [DOI] [PubMed] [Google Scholar]
- 2.Hynynen K, McDannold N, Vykhodtseva N, Jolesz FA. Noninvasive MR imaging-guided focal opening of the blood-brain barrier in rabbits. Radiology. 2001;vol. 220(no. 3):640–646. doi: 10.1148/radiol.2202001804. [DOI] [PubMed] [Google Scholar]
- 3.Choi JJ, Pernot M, Small SA, Konofagou EE. Noninvasive, transcranial and localized opening of the blood-brain barrier using focused ultrasound in mice. Ultrasound Med. Biol. 2007;vol. 33(no. 1):95–104. doi: 10.1016/j.ultrasmedbio.2006.07.018. [DOI] [PubMed] [Google Scholar]
- 4.McDannold N, Vykhodtseva N, Hynynen K. Use of ultrasound pulses combined with definity for targeted blood-brain barrier disruption: A feasibility study. Ultrasound Med. Biol. 2007;vol. 33(no. 4):584–590. doi: 10.1016/j.ultrasmedbio.2006.10.004. [DOI] [PMC free article] [PubMed] [Google Scholar]
- 5.Pardridge WM. The blood-brain barrier: bottleneck in brain drug development. NeuroRx. 2005;vol. 2(no. 1):3–14. doi: 10.1602/neurorx.2.1.3. [DOI] [PMC free article] [PubMed] [Google Scholar]
- 6.Pardridge WM. Drug targeting to the brain. Pharm. Res. 2007;vol. 24(no. 9):1733–1744. doi: 10.1007/s11095-007-9324-2. [DOI] [PubMed] [Google Scholar]
- 7.Choi JJ, Pernot M, Small SA, Konofagou EE. Feasibility of transcranial, localized drug-delivery in the brain of Alzheimer’s-model mice using focused ultrasound; Proc. IEEE Int. Ultrasonics Symp; 2005. pp. 988–991. [Google Scholar]
- 8.Kinoshita M, McDannold N, Jolesz FA, Hynynen K. Noninvasive localized delivery of Herceptin to the mouse brain by MRI-guided focused ultrasound-induced blood-brain barrier disruption. Proc. Natl. Acad. Sci. USA. 2006;vol. 103(no. 31):11719–11723. doi: 10.1073/pnas.0604318103. [DOI] [PMC free article] [PubMed] [Google Scholar]
- 9.Kinoshita M, McDannold N, Jolesz FA, Hynynen K. Targeted delivery of antibodies through the blood-brain barrier by MRI-guided focused ultrasound. Biochem. Biophys. Res. Commun. 2006;vol. 340(no. 4):1085–1090. doi: 10.1016/j.bbrc.2005.12.112. [DOI] [PubMed] [Google Scholar]
- 10.Choi JJ, Wang S, Brown TR, Small SA, Duff KE, Konofagou EE. Noninvasive and transient blood-brain barrier opening in the hippocampus of Alzheimers double transgenic mice using focused ultrasound. Ultrason. Imaging. 2008;vol. 30(no. 3):189–200. doi: 10.1177/016173460803000304. [DOI] [PMC free article] [PubMed] [Google Scholar]
- 11.Raymond SB, Treat LH, Dewey JD, McDannold NJ, Hynynen K, Bacskai BJ. Ultrasound enhanced delivery of molecular imaging and therapeutic agents in Alzheimers disease mouse models. PLoS One. 2008;vol. 3(no. 5):e2175. doi: 10.1371/journal.pone.0002175. art. no. [DOI] [PMC free article] [PubMed] [Google Scholar]
- 12.Siegel GJ, Chauhan NB. Neurotrophic factors in Alzheimer’s and Parkinson’s disease brain. Brain Res. Brain Res. Rev. 2000;vol. 33(no. 2–3):199–227. doi: 10.1016/s0165-0173(00)00030-8. [DOI] [PubMed] [Google Scholar]
- 13.Tuszynski MH, Thal L, Pay M, Salmon DP, U HS, Bakay R, Patel P, Blesch A, Vahlsing HL, Ho G, Tong G, Potkin SG, Fallon J, Hansen L, Mufson EJ, Kordower JH, Gall C, Conner J. A phase 1 clinical trial of nerve growth factor gene therapy for Alzheimer disease. Nat. Med. 2005;vol. 11(no. 5):551–555. doi: 10.1038/nm1239. [DOI] [PubMed] [Google Scholar]
- 14.Patel NK, Gill SS. GDNF delivery for Parkinsons disease. Acta Neurochir. Suppl. 2007;vol. 97(pt. 2):135–154. doi: 10.1007/978-3-211-33081-4_16. [DOI] [PubMed] [Google Scholar]
- 15.Tuszynski MH. Nerve growth factor gene therapy in Alzheimer disease. Alzheimer Dis. Assoc. Disord. 2007;vol. 21(no. 5):179–189. doi: 10.1097/WAD.0b013e318068d6d2. [DOI] [PubMed] [Google Scholar]
- 16.Korecka JA, Verhaagen J, Hol EM. Cell-replacement and gene-therapy strategies for Parkinsons and Alzheimers disease. Regen. Med. 2007;vol. 2(no. 4):425–446. doi: 10.2217/17460751.2.4.425. [DOI] [PubMed] [Google Scholar]
- 17.Schenk D, Barbour R, Dunn W, Gordon G, Grajeda H, Guido T, Hu K, Huang J, Johnson-Wood K, Khan K, Kholodenko D, Lee M, Liao Z, Lieberburg I, Motter R, Mutter L, Soriano F, Shopp G, Vasquez N, Vandevert C, Walker S, Wogulis M, Yednock T, Games D, Seubert P. Immunization with amyloid-beta attenuates Alzheimer-disease-like pathology in the PDA PP mouse. Nature. 1999;vol. 400(no. 6740):173–177. doi: 10.1038/22124. [DOI] [PubMed] [Google Scholar]
- 18.Fiske BK, Frasier MA, Sherer TB. Special focus section: Gene therapy for Parkinsons disease. Exp. Neurol. 2008;vol. 209(no. 1):28–29. doi: 10.1016/j.expneurol.2007.09.006. [DOI] [PubMed] [Google Scholar]
- 19.Fry FJ. Transkull transmission of an intense focused ultrasonic beam. Ultrasound Med. Biol. 1977;vol. 3(no. 2–3):179–184. doi: 10.1016/0301-5629(77)90069-2. [DOI] [PubMed] [Google Scholar]
- 20.Fry FJ, Sanghvi NT, Morris RF, Smithson S, Atkinson L, Dines K, Franklin T, Hastings J. A focused ultrasound system for tissue volume ablation in deep seated brain sites; Proc. IEEE Ultrasonics Symp; 1986. pp. 1001–1004. [Google Scholar]
- 21.Tanter M, Thomas JL, Fink M. Focusing and steering through absorbing and aberrating layers: Application to ultrasonic propagation through the skull. J. Acoust. Soc. Am. 1998;vol. 103(no. 5, pt. 1):2403–2410. doi: 10.1121/1.422759. [DOI] [PubMed] [Google Scholar]
- 22.Hynynen K, Jolesz FA. Demonstration of potential noninvasive ultrasound brain therapy through an intact skull. Ultrasound Med. Biol. 1998;vol. 24(no. 2):275–283. doi: 10.1016/s0301-5629(97)00269-x. [DOI] [PubMed] [Google Scholar]
- 23.Clement GT, Sun J, Giesecke T, Hynynen K. A hemisphere array for non-invasive ultrasound brain therapy and surgery. Phys. Med. Biol. 2000 Dec.vol. 45:3707–3719. doi: 10.1088/0031-9155/45/12/314. [DOI] [PubMed] [Google Scholar]
- 24.Jagannathan J, Sanghvi NT, Crum LA, Yen CP, Medel R, Dumont AS, Sheehan JP, Steiner L, Jolesz F, Kassell NF. High-intensity focused ultrasound surgery of the brain: Part 1—A historical perspective with modern applications. Neurosurgery. 2009;vol. 64(no. 2):201–210. doi: 10.1227/01.NEU.0000336766.18197.8E. [DOI] [PMC free article] [PubMed] [Google Scholar]
- 25.McDannold N, Vykhodtseva N, Hynynen K. Targeted disruption of the blood-brain barrier with focused ultrasound: Association with cavitation activity. Phys. Med. Biol. 2006;vol. 51(no. 4):793–807. doi: 10.1088/0031-9155/51/4/003. [DOI] [PubMed] [Google Scholar]
- 26.McDannold N, Vykhodtseva N, Hynynen K. Blood-brain barrier disruption induced by focused ultrasound and circulating preformed microbubbles appears to be characterized by the mechanical index. Ultrasound Med. Biol. 2008;vol. 34(no. 5):834–840. doi: 10.1016/j.ultrasmedbio.2007.10.016. [DOI] [PMC free article] [PubMed] [Google Scholar]
- 27.Lu M, Wan M, Xu F, Wang X, Chang X. Design and experiment of 256-element ultrasound phased array for noninvasive focused ultrasound surgery. Ultrasonics. 2006;vol. 44(suppl. 1):325–330. doi: 10.1016/j.ultras.2006.07.015. [DOI] [PubMed] [Google Scholar]
- 28.Hynynen K, Sun J. Trans-skull ultrasound therapy: The feasibility of using image-derived skull thickness information to correct the phase distortion. IEEE Trans. Ultrason. Ferroelectr. Freq. Control. 1999;vol. 46(no. 3):752–755. doi: 10.1109/58.764862. [DOI] [PubMed] [Google Scholar]
- 29.Aubry JF, Tanter M, Pernot M, Thomas JL, Fink M. Experimental demonstration of noninvasive transskull adaptive focusing based on prior computed tomography scans. J. Acoust. Soc. Am. 2003;vol. 113(no. 1):84–93. doi: 10.1121/1.1529663. [DOI] [PubMed] [Google Scholar]
- 30.Marquet F, Pernot M, Aubry JF, Montaldo G, Marsac L, Tanter M, Fink M. Non-invasive transcranial ultrasound therapy based on a 3D CT scan: Protocol validation and in vitro results. Phys. Med. Biol. 2009;vol. 54(no. 9):2597–2613. doi: 10.1088/0031-9155/54/9/001. [DOI] [PubMed] [Google Scholar]
- 31.Behrens S, Daffertshofer M, Spiegel D, Hennerici M. Low-frequency, low-intensity ultrasound accelerates thrombolysis through the skull. Ultrasound Med. Biol. 1999;vol. 25(no. 2):269–273. doi: 10.1016/s0301-5629(98)00158-6. [DOI] [PubMed] [Google Scholar]
- 32.Everbach EC, Francis CW. Cavitational mechanisms in ultrasound-accelerated thrombolysis at 1 MHz. Ultrasound Med. Biol. 2000;vol. 26(no. 7):1153–1160. doi: 10.1016/s0301-5629(00)00250-7. [DOI] [PubMed] [Google Scholar]
- 33.Datta S, Coussios CC, McAdory LE, Tan J, Porter T, De Courten-Myers G, Holland CK. Correlation of cavitation with ultrasound enhancement of thrombolysis. Ultrasound Med. Biol. 2006;vol. 32(no. 8):1257–1267. doi: 10.1016/j.ultrasmedbio.2006.04.008. [DOI] [PMC free article] [PubMed] [Google Scholar]
- 34.Daffertshofer M, Gass A, Ringleb P, Sitzer M, Sliwka U, Els T, Sedlaczek O, Koroshetz WJ, Hennerici MG. Transcranial low-frequency ultrasound-mediated thrombolysis in brain ischemia: Increased risk of hemorrhage with combined ultrasound and tissue plasminogen activator: Results of a phase II clinical trial. Stroke. 2005;vol. 36(no. 7):1441–1446. doi: 10.1161/01.STR.0000170707.86793.1a. [DOI] [PubMed] [Google Scholar]
- 35.Aubry JF, Fink M. Transcranial ultrasound-mediated thrombolysis: Safety issue; Proc 7th Int. Symp. Therapeutic Ultrasound; 2007. [Google Scholar]
- 36.Baron C, Aubry JF, Tanter M, Meairs S, Fink M. Simulation of intracranial acoustic fields in clinical trials of sonothrombolysis. Ultrasound Med. Biol. 2009;vol. 35(no. 7):1148–1158. doi: 10.1016/j.ultrasmedbio.2008.11.014. [DOI] [PubMed] [Google Scholar]
- 37.Azuma T, Kawabata K, Umemura S, Ogihara M, Kubota J, Sasaki A, Furuhata H. Bubble generation by standing wave in water surrounded by cranium with transcranial ultrasonic beam. Jpn. J. Appl. Phys. 2005;vol. 44:4625–4630. [Google Scholar]
- 38.Crum LA. Bjerknes forces on bubbles in a stationary sound field. J. Acoust. Soc. Am. 1975;vol. 57(no. 6):1363–1370. [Google Scholar]
- 39.Brundin P, Olanow CW. Restorative Therapies in Parkinsons Disease. New York, NY: Springer Verlag; 2006. [Google Scholar]
- 40.Giacobini E. Alzheimer disease, from molecular biology to therapy. Adv. Exp. Med. Biol. 1997;vol. 429:235–245. [PubMed] [Google Scholar]
- 41.Choi JJ, Wang S, Tung YS, Morrison B, Konofagou EE. Molecules of various pharmacologically-relevant sizes can cross the ultrasound-induced blood-brain barrier opening in vivo. Ultrasound Med. Biol. 2009;vol. 36(no. 1):58–67. doi: 10.1016/j.ultrasmedbio.2009.08.006. [DOI] [PMC free article] [PubMed] [Google Scholar]
- 42.Tung YS, Choi J, Wang S, Feshitan J, Borden M, Konofagou E. Identifying the inertial cavitation threshold in a vessel phantom using focused ultrasound and microbubbles. J. Acoust. Soc. Am. 2008;vol. 124(no. 4):2486. [Google Scholar]
- 43.Choi JJ, Pernot M, Brown TR, Small SA, Konofagou EE. Spatio-temporal analysis of molecular delivery through the blood-brain barrier. Phys. Med. Biol. 2007;vol. 52:5509–5530. doi: 10.1088/0031-9155/52/18/004. [DOI] [PubMed] [Google Scholar]
- 44.Konofagou EE, Choi JJ, Baseri B, Tung Y-S. Mechanism and safety of FUS-induced BBB opening; 9th Int. Society Therapeutic Ultrasound; 2009. p. 103. [Google Scholar]
- 45.DeLong MR. Primate models of movement disorders of basal ganglia origin. Trends Neurosci. 1990;vol. 13(no. 7):281–285. doi: 10.1016/0166-2236(90)90110-v. [DOI] [PubMed] [Google Scholar]
- 46.Wenk GL. A primate model of Alzheimers disease. Behav. Brain Res. 1993;vol. 57(no. 2):117–122. doi: 10.1016/0166-4328(93)90127-c. [DOI] [PubMed] [Google Scholar]
- 47.Chan AW. Transgenic nonhuman primates for neurodegenerative diseases. Reprod. Biol. Endocrinol. 2004;vol. 2:39. doi: 10.1186/1477-7827-2-39. [DOI] [PMC free article] [PubMed] [Google Scholar]
- 48.Philippens IH. Non-human primate models for Parkinsons disease. Drug Discov. Today Dis. Models. 2008;vol. 5(no. 2):105–111. [Google Scholar]
- 49.Kaufman JJ, Luo G, Siffert RS. Ultrasound simulation in bone. IEEE Trans. Ultrason. Ferroelectr. Freq. Control. 2008;vol. 55(no. 6):1205–1218. doi: 10.1109/TUFFC.2008.784. [DOI] [PubMed] [Google Scholar]
- 50.White PJ, Clement GT, Hynynen K. Longitudinal and shear mode ultrasound propagation in human skull bone. Ultrasound Med. Biol. 2006;vol. 32(no. 7):1085–1096. doi: 10.1016/j.ultrasmedbio.2006.03.015. [DOI] [PMC free article] [PubMed] [Google Scholar]
- 51.Yin X, Hynynen K. A numerical study of transcranial focused ultrasound beam propagation at low frequency. Phys. Med. Biol. 2005;vol. 50(no. 8):1821–1836. doi: 10.1088/0031-9155/50/8/013. [DOI] [PubMed] [Google Scholar]
- 52.Connor CW. Ph.D. thesis. Harvard University-MIT Division of Health Sciences and Technology; 2005. Simulation methods and tissue property models for non-invasive transcranial focused ultrasound surgery. [Google Scholar]
- 53.Connor CW, Clement GT, Hynynen K. A unified model for the speed of sound in cranial bone based on genetic algorithm optimization. Phys. Med. Biol. 2002;vol. 47(no. 22):3925–3944. doi: 10.1088/0031-9155/47/22/302. [DOI] [PubMed] [Google Scholar]
- 54.Kunz KS, Luebbers RJ. The Finite Difference Time Domain Method for Electromagnetics. Boca Raton, FL: CRC Press; 1993. [Google Scholar]
- 55.Duck F. Physical Properties of Tissue: A Comprehensive Reference Book. London, UK: Academic Press; 1990. [Google Scholar]
- 56.Kremkau FW, Barnes RW, McGraw CP. Ultrasonic attenuation and propagation speed in normal human brain. J. Acoust. Soc. Am. 1981;vol. 70(no. 1):29–38. [Google Scholar]
- 57.Pichardo S, Hynynen K. Multi frequency characterization of speed of sound for longitudinal transmission on freshly excised human skulls; 9th Int. Symp. Therapeutic Ultrasound; 2009. p. 136. [DOI] [PMC free article] [PubMed] [Google Scholar]
- 58.Styner M, Knickmeyer R, Joshi S, Coe C, Short SJ, Gilmore J. Automatic brain segmentation in rhesus monkeys. Proc. SPIE. 2007;vol. 6512:65122L. art. no. [Google Scholar]
- 59.Mazziotta JC, Toga AW, Evans A, Fox P, Lancaster J. A probabilistic atlas of the human brain: Theory and rationale for its development the international consortium for brain mapping (ICBM) Neuroimage. 1995;vol. 2(no. 2):89–101. doi: 10.1006/nimg.1995.1012. [DOI] [PubMed] [Google Scholar]
- 60.Jensen JA, Svendsen NB. Calculation of pressure fields from arbitrarily shaped, apodized, and excited ultrasound transducers. IEEE Trans. Ultrason. Ferroelectr. Freq. Control. 1992;vol. 39(no. 2):262–267. doi: 10.1109/58.139123. [DOI] [PubMed] [Google Scholar]
- 61.Tang SC, Clement GT. Standing-wave suppression for transcranial ultrasound by random modulation. IEEE Trans. Biomed. Eng. 2010;vol. 57(no. 1):203–205. doi: 10.1109/TBME.2009.2028653. [DOI] [PMC free article] [PubMed] [Google Scholar]
- 62.Mitri FG, Greenleaf JF, Fatemi M. Chirp imaging vibroacoustography for removing the ultrasound standing wave artifact. IEEE Trans. Med. Imaging. 2005;vol. 24(no. 10):1249–1255. doi: 10.1109/TMI.2005.854518. [DOI] [PubMed] [Google Scholar]
- 63.Erpelding TN, Hollman KW, O’Donnell M. Bubble-based acoustic radiation force using chirp insonation to reduce standing wave effects. Ultrasound Med. Biol. 2007;vol. 33(no. 2):263–269. doi: 10.1016/j.ultrasmedbio.2006.07.039. [DOI] [PMC free article] [PubMed] [Google Scholar]
- 64.Melodelima D, N’Djin WA, Parmentier H, Chesnais S, Rivoire M, Chapelon JY. Thermal ablation by high-intensity-focused ultrasound using a toroid transducer increases the coagulated volume. Results of animal experiments. Ultrasound Med. Biol. 2009;vol. 35(no. 3):425–435. doi: 10.1016/j.ultrasmedbio.2008.09.020. [DOI] [PubMed] [Google Scholar]
- 65.Unger EC, Porter T, Culp W, Labell R, Matsunaga T, Zutshi R. Therapeutic applications of lipid-coated microbubbles. Adv. Drug Deliv. Rev. 2004;vol. 56(no. 9):1291–1314. doi: 10.1016/j.addr.2003.12.006. [DOI] [PubMed] [Google Scholar]
- 66.Lee JD, Huang CH, Lee ST. Improving stereotactic surgery using 3-D reconstruction. IEEE Eng. Med. Biol. Mag. 2002;vol. 21(no. 6):109–116. doi: 10.1109/memb.2002.1175146. [DOI] [PubMed] [Google Scholar]


