Abstract
There is great interest to use magnetic resonance imaging (MRI) for non-invasive assessment of myocardial disease in ischemic and non-ischemic cardiomyopathies. Recently, there has been a renewed interest to use a magnetic resonance imaging (MRI) technique utilizing spin locking radiofrequency (RF) pulses, called T1ρ MRI. The spin locking RF pulse creates sensitivity to some mechanisms of nuclear relaxation such as 1H exchange between water and amide, amine and hydroxyl functional groups in molecules; consequently, there is the potential to non-invasively, and without exogenous contrast agents, obtain important molecular information from diseased myocardial tissue. The purpose of this article is to review and critically examine the recent published literature in the field related to T1ρ MRI of myocardial disease.
Keywords: Ischemic, Non-ischemic, Heart disease, Magnetic resonance imaging, T1ρ relaxation, Spin lock radiofrequency pulse
Introduction
The purpose of this article is to critically examine and discuss recent developments in spin lock or T1ρ (“T1-rho”) MRI for assessing myocardial disease. While a considerable amount of published work on spin locking exists in medical research related to osteoarthritis [1, 2], acute cerebral ischemia [3], cancer [4], and liver fibrosis [5], there are very few studies reporting the use of spin locking in diseases of the myocardium. This is somewhat surprising since, in particular, osteoarthritis is partially a disease affecting the normal molecular structure of cartilage, a tissue containing few chondrocytes supporting a dense extracellular matrix of collagen and proteoglycan; likewise, ischemic heart disease post-myocardial infarction (MI) is characterized by cardiomyocyte replacement with fibrotic tissue abundant in collagen. Yet despite this similarity, there remains little research - but nevertheless a strong expectation - that the nanoscopic magnetic environment of 1H nuclei is sufficient to generate endogeneous MRI contrast in diseases of the myocardium. From this perspective, it seems logical that T1ρ MRI would be useful for imaging of fibrotic scar tissue in the heart. Although non-ischemic myocardial diseases such as left ventricular hypertrophy are also sometimes characterized by increased tissue fibrosis, at this time, there is currently no published research of T1ρ MRI in this area and therefore we will focus this report exclusively on recent work involving T1ρ MRI of acute and chronic ischemic heart disease.
An Overview of Spin Locking and T1ρ MRI
Spin locking is used primarily as a contrast-generating mechanism in cardiovascular MRI. We use spin locking to non-invasively study molecular changes in diseased myocardial tissue, differentiate normal and diseased myocardial tissue and potentially determine myocardial area-at-risk. Unlike contrast agents, like gadolinium chelates in MRI or radioactive tracers in positron emission tomography (PET), the contrast in T1ρ MRI arises from the interaction between tissue water 1H nuclear intrinsic angular momentum (spin), an applied radiofrequency (RF) field called the spin lock field and the local (nanoscopic) magnetic environment of the nucleus. Since contrast is generated through a RF field, spin locking can be used safely in humans without concern for contrast agent toxicity or radioactivity, as long as the RF fields do not cause excess tissue heating.
Although this report describes MRI methods, spin locking has historical roots in nuclear magnetic resonance (NMR) spectroscopy [6]. In the NMR literature, spin locking is most commonly used for the determination of low frequency (Hz-kHz) chemical exchange rates in small molecules and proteins [7]. While spin–lattice (T1) relaxation is sensitive to intermediate (kHz-MHz) exchange rates, low frequency exchange rates are not easily analyzed by T1 relaxation because of the low polarizability of the nuclear spin system at requisite low magnetic field strengths. Spin locking avoids this restriction using a radiofrequency (RF) field instead of the static field to probe the effect of exchange rate on nuclear relaxation. In these experiments, the spin lock amplitude is varied and the exchange rate is indirectly measured through its effect on the rotating frame relaxation time T1ρ; this is called a rotating frame NMR dispersion experiment.
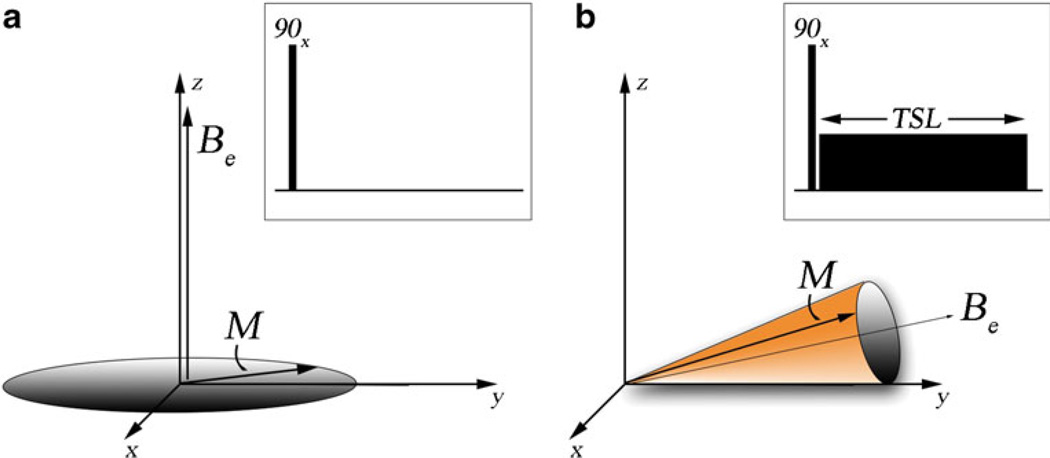
The term “spin locking” provides a helpful visual description of the dynamics of the nuclear spin system. A simple spin lock experiment is shown in Fig. 1, as seen from a frame of reference rotating at the Larmor frequency (ω0 = γB0). The net magnetization is excited from equilibrium using a 90° pulse and nutated into the transverse plane. A continuous RF pulse is then applied with a phase and frequency so that the effective magnetic field remains nearly parallel to the net nuclear spin magnetization for a suitably long duration (several tens to hundreds of milliseconds). In the absence of this continuous RF pulse, the nuclear spin magnetization would ordinarily dephase (contributing to T2* relaxation) and undergo both T2 and T1 relaxation. However, the RF pulse locks the magnetization so that dephasing is hindered. This can be seen by direct inspection of the equations of motion for the nuclear spin system, the Bloch equations
Fig. 1.
The dynamics of the nuclear spin magnetization with and without a spin locking pulse in a frame of reference rotating at the Larmor frequency. The figure insert is the pulse sequence for each situation. (a) Dynamics of the net magnetization M without a spin locking pulse. The magnetization is nutated into transverse plane with an initial 90°x RF pulse. The magnetization then proceeds to rotate around the effective magnetic field Be. For a large number of isochromats, it can be shown that this process results in dephasing of the net magnetization and T2* relaxation. (b) Dynamics of the net magnetization with a spin locking pulse. The magnetization is again nutated into the transverse plane with an initial 90°x RF pulse. However, now the spin locking pulse constrains the motion of the net magnetization around the effective field in a cone. Dephasing is limited and T1ρ relaxation occurs
In the rotating frame, the time dependence of the magnetization is related to the cross-product between the effective magnetic field Be, the net magnetization M, and gyromagnetic ratio γ. The effective magnetic field is the sum of the RF field amplitude and the residual component of the static field
When the two vectors M and Be are closely aligned, the overall motion of M is constrained to a narrow cone around Be. Furthermore, although T1 and T2 nuclear relaxation still occur, if the RF field is sufficiently strong, magnetization is continuously disturbed by the RF field and will not return to the initial equilibrium condition, but instead reach a steady-state in a time on the order of T1ρ and not the usual spin–lattice relaxation time T1. With RF fields appropriate for in vivo imaging, T1ρ is always longer than T2, but not as long as T1. As a point of terminology, T1ρ MRI refers to imaging methods as a whole that exhibit T1ρ relaxation-time contrast, whereas spin locking refers directly to the locking RF field itself.
Cardiac T1ρ MRI Contrast
T1ρ Image Contrast and Tissue Fibrosis
Post-infarction cardiomyocytes undergo cell necrosis and are partially replaced by inflammatory cells, neutrophils and macrophages within the first 24 hours. Within 6–8 weeks, infarcted tissue is almost entirely composed of a vast network of type I and III collagen, supported by myofibroblasts and neovasculature.
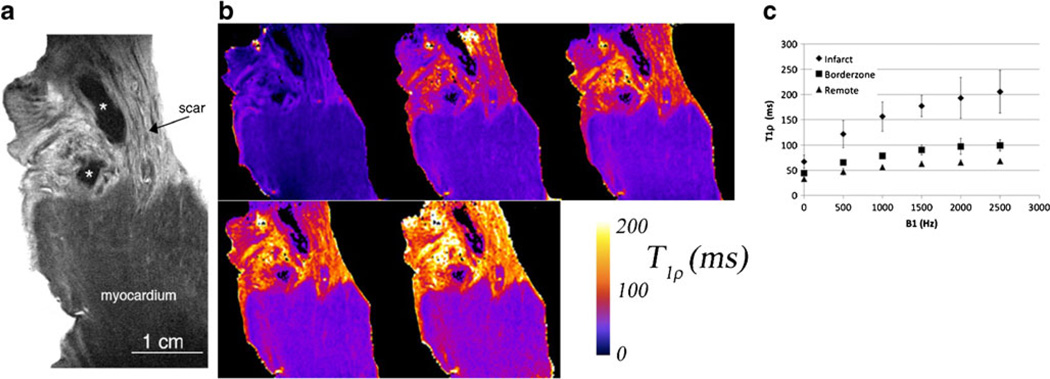
We initially explored the relationship between T1ρ MRI contrast and the tissue composition of fibrosis and myocardium in ex vivo experiments on heart tissue dissected from pigs 8 weeks post-infarction. In these experiments, segmental, transmural tissue sections containing visible scar and adjacent myocardium were prepared for high resolution T1ρ MRI. The scarred tissue was found to have greater signal intensity than remote and adjacent normally perfused borderzone myocardium (Fig. 2a).We also observed that there was heterogeneity in the scar appearance in T1ρ images, which may result from heterogeneous collagen fiber orientation in scar.
Fig. 2.
High resolution T1ρ MRI of ex vivo heart tissue from a pig 8 weeks post-infarction. The resolution is 50 µm × 50 µm × 1 mm. (a) Myocardium has lower T1ρ signal intensity (dark gray) compared to fibrotic tissue (light gray). * indicates a possible residual blood clot from dissection and may appear black because of strong magnetic susceptibility gradients from iron and hemoglobin, greatly reducing T1ρ signal intensity. (b) T1ρ parametric maps at five different spin lock amplitudes B1 = 0, 500 Hz, 1, 1.5, and 2.5 kHz. Note that B1 = 0 is a T2 map obtained using a spin echo sequence with a single refocusing RF pulse. (c) T1ρ relaxation times in infarcted, borderzone and remote myocardial tissue (n = 5). The variation in T1ρ relaxation times at different spin lock amplitudes is the T1ρ dispersion. Improved contrast-to-noise ratio at higher spin lock amplitudes is a consequence of increased ΔT1ρ between infarcted and normal myocardium
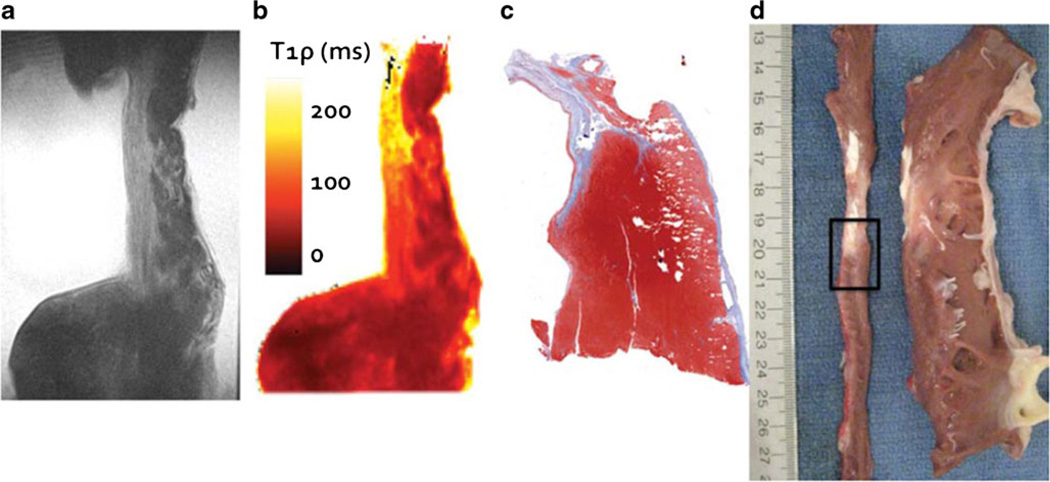
To further validate that the difference in T1ρ MRI signal was a result of differences in tissue composition between scar and cardiomyocytes, we correlated T1ρ images with histology [8••]. Heart sections containing both scar and cardiomyocytes were dissected into 80 mm (circumferential) × 20 mm (radial) × 10 mm (longitudinal) sections. The tissue was further divided along the longitudinal axis and contiguous 5 mm sections were separated for ex vivo MRI and histology; these sections were thin enough to preserve the overall scar geometry and size. We then obtained T1ρ images (spin lock time, TSL = 50 ms) and T1ρ maps and correlated these images with Masson’s trichrome stain of the adjacent tissue section (Fig. 3). There was wall thinning in the infarcted region and subendocardial scar can be seen, although we also observed areas with normal appearing myocytes. The overall shape and size of the fibrotic area resembled the adjacent trichrome-stained histological section (compare Fig. 3a, b, and c).
Fig. 3.
Correlation between T1ρ MR images and histology. (a) A single T1ρ image (TSL = 48 ms). (b) T1ρ relaxation time parametric map for the same slice as (a). (c) Masson’s trichrome stain of an adjacent tissue section. Notice that the relaxation time enhancement in (b) corresponds with fibrotic tissue. (d) photograph of the same region immediately after left ventricular dissection. The left ventricle has been sliced along the vertical long axis, unwrapped, and sliced again along the short axis (narrow thin strip of tissue on the left). The interface between infarct and borderzone tissue identified for ex vivo imaging is outlined (black rectangle)
Origins of T1ρ Contrast in Cardiac Muscle
From the previously described ex vivo experiments, we established that T1ρ contrast was sensitive to tissue composition, but we did not yet know what specific tissue components of cardiac muscle structure contributed to 1H T1ρ nuclear relaxation and how they would ultimately affect the T1ρ signal. There are several potential mechanisms for this effect, such as water molecular motion, 1H chemical exchange, molecular diffusion, magnetization transfer, residual dipolar interactions, and nuclear Overhauser effects. The relative size of these contributions is not known for cardiac muscle.
The usual way to untangle the various exchange contributions to T1ρ in solutions is to measure the T1ρ dependence on the spin lock amplitude or dispersion. The spin locking pulse will effectively quench low frequency contributions to T1ρ when the spin lock amplitude ω1 greatly exceeds their rate k (ω1 = γB1≫k), reducing the relaxation rate R1ρ = 1/T1ρ. For diffusion, this occurs when the spin lock amplitude exceeds any magnetic field gradients through which water molecules travel. For 1H chemical exchange, this occurs when the spin lock amplitude exceeds the exchange rate kex. A suitable model for the observed T1ρ dispersion is used to determine the contribution of individual relaxation mechanisms.
Without determining yet what the specific mechanisms of T1ρ dispersion were, we hypothesized there would nonetheless be significant nuclear relaxation dispersion in cardiac muscle. Figure 2b and c show the results of a T1ρ dispersion experiment performed over RF amplitudes 0–2.5 kHz in ex vivo heart tissue dissected from pigs 6–8 weeks following direct ligation of the left anterior descending coronary artery (n = 5). We quantified relaxation rates in the infarct, borderzone and remote myocardium distant to the infarcted area and observed significant relaxation dispersion in all three types of tissue (Fig. 2c). Overall, there was good correspondence between the infarcted area on MRI and the fibrosis on histology.
We fit the T1ρ dispersion data to a model with two mechanisms for T1ρ relaxation: one contribution from all sources of 1H chemical exchange and another contribution from molecular tumbling. In this experiment, we found it was not possible to isolate individual 1H exchange contributions to T1ρ in cardiac muscle because there were many contributions and the dispersion curve itself had few features. Despite these challenges, there is a strong dispersion with clinical implications regardless of their origins.
One important clinical implication of this experiment is that compared to T2 MRI (single spin echo, compare Fig. 2b with spin lock amplitude B1 = 0 Hz and 500 Hz), there was an almost two-fold increase in the 1H relaxation times at spin lock amplitudes appropriate for clinical use (B1 = 500 Hz). This significantly increases contrast between fibrotic tissue and myocardium. Although it has long been known that T2 increases with myocardial fibrosis, mixed reports in vivo are likely related to inadequate contrast-to-noise ratio (CNR) in routine clinical MRI, especially when compared to late gadolinium enhanced (LGE) MRI.
Potential Contributions of 1H Chemical Exchange to T1ρ Relaxation Dispersion
For chemical exchange in which there is 1H transfer between water and another molecule, there are a large number of potential candidates that might contribute to T1ρ dispersion in myocardium. The main candidates are organic acids, such as amino acids or their derivatives, with amine, amide and hydroxyl functional groups including the main backbone of proteins and the side chains of charged amino acid residues. The important properties that determine whether there will be chemical exchange contrast are the exchange rate and contributions to the exchange rate, such as pH and temperature, and overall abundance of the exchanging site. To generate a T1ρ dispersion, the exchange mechanism must be in the intermediate exchange regime on the rotating frame timescale (1/ω1). If the exchange is too slow, then there is no observable exchange on the rotating frame timescale. On the other hand, if the exchange is too fast (kHz-MHz), then two resonances with distinct chemical shift will coalesce to a single chemical shift, a consequence of motional averaging on the rotating frame timescale. It is not clear if it is possible to distinguish between the multiple chemical exchange mechanisms using an on-resonance spin lock pulse in vivo since water saturation involves magnetization exchange with all potential exchange pathways. However, it can be shown that combinations of exchanging pools of protons can give rise to a similar overall shape and defined by an apparent exchange rate rather than a definite single exchange rate.
Using a slightly different method called chemical exchange saturation transfer (CEST) [9, 10], it is possible to improve exchange specificity if the RF pulse is delivered away from the 1H water resonance, instead targeting the Larmor frequency of a 1H nucleus on the same molecules listed above. In this case, continuous saturation and exchange of 1H nuclei between the selected metabolite and water can result in observable reduction in the image signal intensity. Although this method has been used to target molecules such as creatine [11•] and glucose [12], there are also potential contributions of 1H transverse relaxation and nuclear Overhauser effects to the detected signal.
T1ρ MRI of Ischemic Heart Disease
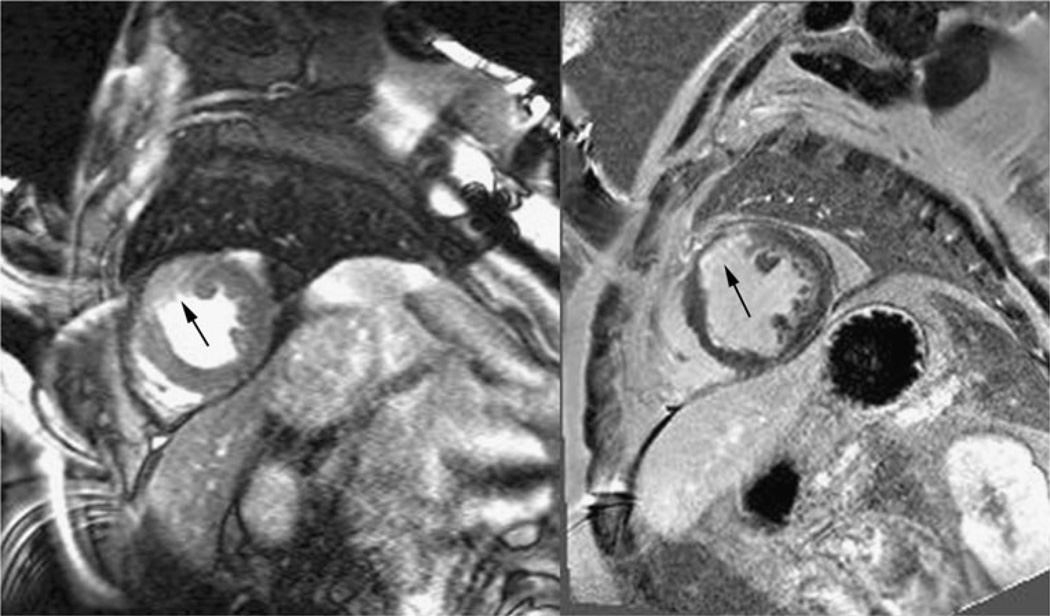
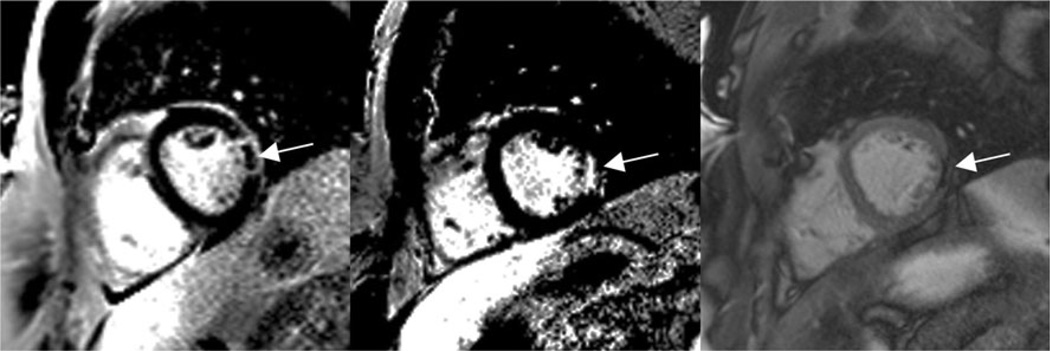
There are a few studies reporting the use of T1ρ MRI to visualize acute myocardial infarction. Like T2 MRI, the main reason for signal enhancement in T1ρ MRI appears to be edema in the myocardial area-at-risk in the acute setting, associated increased tissue water mobility and reduction of the rotational correlation time. Figure 4 shows an example of a T1ρ MR image in a patient four days post-infarction. The infarcted area has greater signal intensity than myocardium remote from the infarction and this area closely correlates with the injury appearing on a late gadolinium enhancement (LGE) MRI scan. Overall the injury appears larger with T1ρ MRI than with LGE MRI, presumably because of differences in the size of the area-at-risk and the area of irreversible injury, as depicted on LGE MRI. In a T1ρ MRI study of 21 patients performed within the first week after reperfusion for myocardial infarction, Muthupillai et al. observed a 66±39 % enhancement in the infarcted area compared to the remote myocardium [13]. In one patient, however, reduction of T1ρ MRI signal intensity was found and closely correlated with microvascular obstruction on LGE MRI. We have also observed the persistence of reduction of T1ρ signal intensity in a patient one year after MI who had microvascular obstruction on his MRI three days after infarction (Fig. 5). In this patient, we observed hypointense MR signal on the LGE MR image with a narrow perimeter of region of enhanced signal intensity. Likely this area was associated with subendocardial microvascular obstruction. One year later, we repeated LGE MRI and also performed T1ρ MRI. We observed signal enhancement on LGE in the previously hypointense region, but also hypoitense signal intensity on T1ρ, which could possibly be associated with subendocardial hemorrhage.
Fig. 4.
T1ρ (left) and late gadolinium enhanced (LGE) MR images (right) in a patient four days post-myocardial infarction (MI). The enhanced signal intensity in the T1ρ image likely corresponds to edema in the area-at-risk. This area appears larger than the poorly perfused area in the LGE MR image. Images were obtained on a 1.5 T clinical MRI scanner (Avanto, Siemens Healthcare, Erlangen, Germany). T1ρ images were obtained in systole with a TSL = 50 ms spin lock pulse at B1 = 500 Hz and a balanced gradient echo sequence with TE = 1.5 ms, TR = 3 ms, slice thickness = 7 mm, image resolution = 1.4 mm × 1.4 mm, bandwidth = 558 Hz/pixel, flip angle = 70°, segments = 16 and parallel imaging = 2
Fig. 5.
LGEMR images in a patient four days (left) and one year (middle) post-myocardial infarction and correlation with T1ρ MRI at one year (right). There was hypointense signal intensity on LGE MRI and a hyperintense signal perimeter, which we associated microvascular obstruction at four days post-infarction and reperfusion (left). At one year, the same region appears hyperintense on the LGE MRI image, but appears hypointense on T1ρ. Images were obtained on the same 1.5 T clinical MRI scanner (Avanto, Siemens Healthcare, Erlangen, Germany). T1ρ images were obtained in diastole with a TSL = 50 ms spin lock pulse at B1 = 500 Hz and a balanced gradient echo sequence with TE = 1.5 ms, TR = 3 ms, slice thickness = 7 mm, image resolution = 1.4 mm × 1.4 mm, bandwidth = 558 Hz/pixel, flip angle = 70°, segments = 16 and parallel imaging = 2. LGE images were obtained at approximately 15 minutes post-Gadolinium injection with a phase-sensitive inversion-recovery prepared spoiled gradient echo sequence, TE = 3.2 ms, TR = 6 ms, TI = 300 ms, image resolution = 1.5 mm×1.5 mm, slice thickness = 8, segments = 16 and parallel imaging = 2
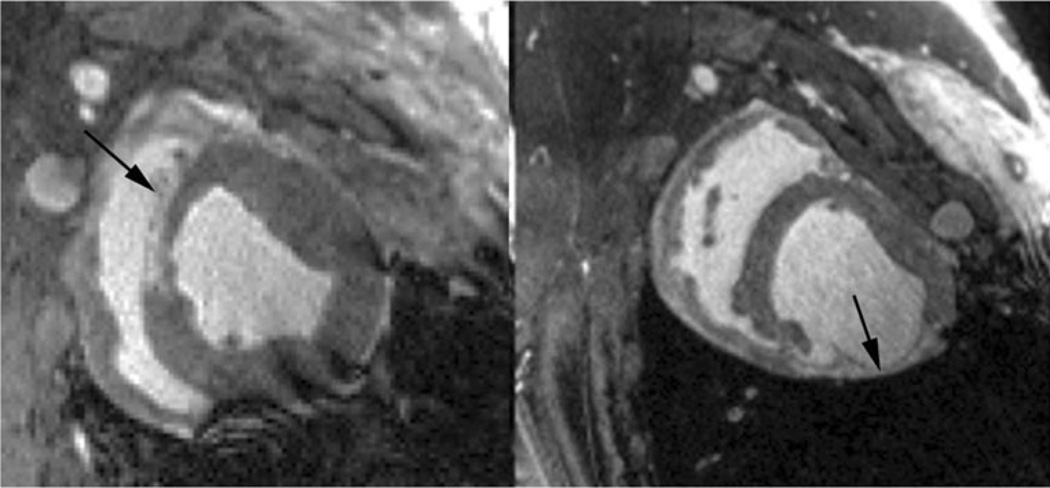
We performed a T1ρ MRI study at 8 weeks post-infarction in pigs in vivo and found similar overall scar size on T1ρ and LGE MRI and after dissecting the left ventricle for ex vivo planimetry [14•]. Figure 6 shows T1ρ MR images in a pig with an LAD artery ligation and another with circumflex artery ligation. Similar T1ρ signal intensity enhancement was observed at the infarct in both MRI scans.
Fig. 6.
T1ρ MRI images in two pigs at 8 weeks post-myocardial infarction. The first image (left) was from a pig with LAD artery ligation and depicts hyperintense T1ρ signal at the area of infarction. The second image (right) was from another pig with circumflex artery ligation and shows both wall thinning associated with chronic infarction as well as hyperintense T1ρ signal at the area of infarction
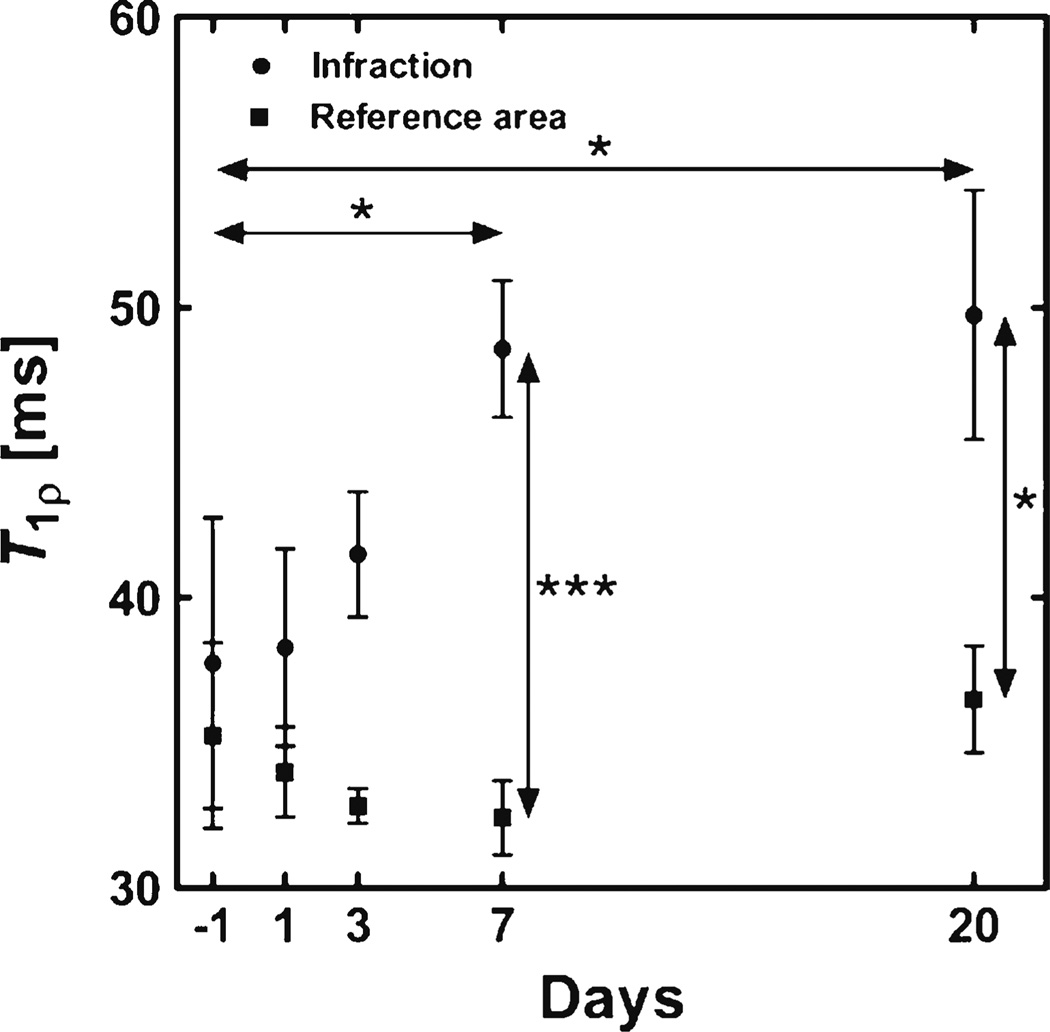
As was mentioned earlier, the pathology of tissue molecular changes from acute ischemic injury to fibrosis is a process that evolves over several weeks after infarction. Mustafa et al. reported a serial T1ρ MRI study in mice following permanent ligation of the LAD coronary artery, studying T1ρ relaxation times at baseline, 1, 3, 7, and 20 days post-infarction (B1 = 1,250 Hz, TSL = 0–54 ms) [15••]. Significant changes in T1ρ were observed after 7 and 20 days infarction, but only moderate, non-significant relaxation time enhancement at earlier times post-injury (Fig. 7).
Fig. 7.
T1ρ relaxation time measurements from infarct and remote myocardium from a longitudinal study in mice after ligation of the LAD artery. Data points are mean ± SEM (n = 4 [days −1 and 20], n = 6 [day 3] and n = 7 [days 1 and 7]). (*P <0.05, **P <0.01, and ***P <0.001, two-way ANOVA with Bonferroni’s post host test)
Contrast Agents
There is very little research exploring the effect of contrast agents on T1ρ contrast. Gadolinium contrast agents are frequently used for myocardial perfusion and LGEMRI to detect ischemia and fibrosis. In poorly perfused or infarcted tissue, gadolinium has very different tracer kinetics and extracellular concentration than in normal myocardium, so it is possible to exploit these differences using an inversion recovery- or saturation-prepared pulse sequence to generate T1 contrast. Gadolinium contrast agents also are expected to have an effect on T1ρ relaxation, but there is no evidence to suggest that T1ρ relaxation rate enhancement after contrast administration would be superior to T1. Huber et al. performed a study to determine the effect of contrast dose and time of imaging after contrast administration T1ρ MRI in patients within a few days post-myocardial infarction and reperfusion [16]. Performing a T1ρ scan at 40 minutes post-contrast resulted in significant contrast between injured and normal myocardium, however, because of the cine pulse sequence timing, the relative contribution of post-gadolinium T1 relaxation to image contrast is uncertain. Two recent studies have shown the potential for T1ρ sensitivity to albumin-binding gadofosveset [22] and iron oxide [23].
Pulse Sequences for Cardiac T1ρ MRI
In vivo cardiac T1ρ images can be obtained using software to control a sequence of RF pulses and magnetic field gradients and without any additional hardware modifications to a clinical MRI scanner. Usually it is possible to separate the sequence timing into two parts: a first part in which T1ρ contrast is generated using the spin lock RF pulse and a second part in which this contrast is spatially encoded with magnetic field gradients. The encoded data may then be reconstructed into an image with a suitable reconstruction algorithm. For cardiac imaging, this type of sequence is generally referred to as “magnetization-prepared” or, specifically, “T1ρ-prepared”, because the spin lock pulse prepares the magnetization with contrast for spatial encoding. In cardiac MRI, we have found it best to employ multishot balanced gradient echo or spoiled gradient echo sequences for spatial encoding [17]. This seems to be the most time efficient and robust method to acquire cardiac T1ρ images in humans, when it is important to constrain the scan to a single breath-hold to reduce motion artifacts.
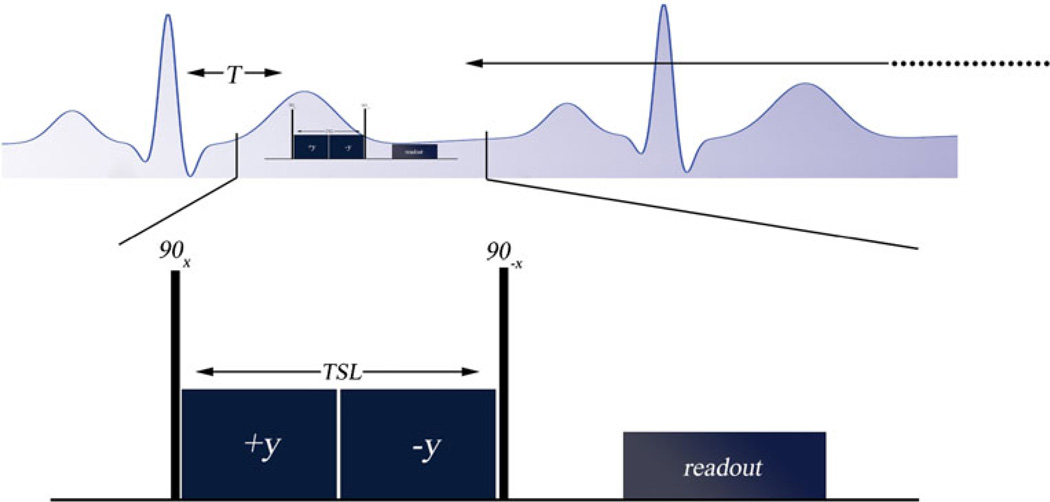
An example of a T1ρ MRI sequence used in humans is shown in Fig. 8. This pulse sequence consists of the spin lock composite pulse cluster and readout sequence. This sequence uses a rotary echo pulse cluster, although dual rotary echospin echo or adiabatic half-passage excitation pulses are commonly used to further reduce sensitivity to field heterogeneity. We deliver the spin lock pulse with moderate duration (TSL < 50 ms) and amplitudes (B1 < 600 Hz) to maximize contrast and limit RF power deposition. A different way to form T1ρ contrast is to repeatedly deliver the spin lock pulse interleaved with cine MRI [18]. This technique also provides myocardial motion information, but in our experience also requires lower spin lock amplitude, limiting contrast, and does not allow for quantification of T1ρ relaxation times.
Fig. 8.
AT1ρ pulse sequence designed for use in humans using a breath-hold and electrocardiogram (ECG)-triggering. The pulse sequence is synchronized to the R-wave using a MRI-compatible vector ECG. A delay T is used to capture images in either cardiac diastole or systole; T is the time between the R-wave and the start of the first excitation pulse in the spin lock pulse cluster. The spin lock pulse cluster shown here is a rotary echo-type spin lock, consisting of a pair of continuous RF spin locking pulses with opposite phase (±y) to refocus magnetization in a heterogeneous B1 magnetic field. TSL is total spin lock time. After the T1ρ pulse cluster, a magnetic field gradient is delivered to crush remaining transverse signal and then an acquisition sequence (readout) is performed. Usually the readout sequence employed is a multi-shot spoiled gradient echo or balanced gradient echo acquisition sequence. Additional pulse sequence modules may be used for fat suppression or to reduce transient modulations of the magnetization during spatial encoding
There is interest to devise faster cardiac T1ρ sequences by incorporating parallel imaging and compressed sensing, obtain multislice or 3D T1ρ data using respiratory gated methods. Using state-of-art acceleration methods, it is possible to obtain 4 T1ρ images and create a T1ρ map within 16 heartbeats (4 beats per T1ρ image), using odd heartbeats to acquire data and even heartbeats to allow for T1 recovery. In a patient at rest (60 bpm), this is sufficient time to acquire a T1ρ map from one slice within a single breathhold. When a parametric map is synthesized from multiple images, image registration can be used to minimize motion artifacts in the final T1ρ map.
Challenges for T1ρ MRI in Humans
The sensitivity to field heterogeneity at low spin-lock amplitudes and excess tissue power deposition at higher spin lock fields are problems for T1ρ MRI. These problems are compounded in human cardiovascular MRI, where significant magnetic susceptibility differences can exist between lung parenchyma, myocardial tissue and inflowing blood. In our experience, there is only a very narrow range of spin lock amplitudes available for use in vivo that result in safe and artifact free images. Consequently, there remains considerable interest to develop spin lock pulse sequences that are less sensitive to the field heterogeneity. Incorporating composite excitation and inversion pulses and using amplitude and frequency modulated RF pulses, we have developed spin lock pulses that reduce these artifacts [19, 20]. At this time there has been little or no effort to safely increase the spin lock amplitude through the development of innovative transmit coil hardware or to justify less conservative SAR limits using electromagnetic simulations and experiments for cardiovascular spin lock MRI. If the ex vivo T1ρ dispersion experiments discussed earlier were any indication, amplitudes as high at 1 kHz would be very beneficial for contrast while simultaneously minimizing T1ρ image artifacts. One adaptable solution is the use of methods that lower spin lock efficiency – those that acquire spin lock amplitudes for only a subset of k-space lines [21]. Still these methods only reduce time-averaged RF power and not peak power, which is subject to a different, higher set of restrictions over a short window.
Future Work
There is much work to be done in cardiac T1ρ MRI. Continued development of T1ρ MRI in both ischemic and non-ischemic disease will lead to multi-parametric analysis of the myocardium along with T1 and T2 mapping methods. Pulse sequence improvements are needed such as correction for field heterogeneity to allow consistent measurements of signal intensity across the myocardium and enable comparisons between patients. Faster cardiac T1ρ sequences are needed by incorporating parallel imaging and compressed sensing methods to obtain multi-slice or 3D T1ρ data and combine respiratory-gated methods. Finally, serial studies of T1ρ MRI in both acute and chronic ischemic and non-ischemic heart disease are needed in humans and require validation and correlation with histology in animal models.
Conclusions
T1ρ MRI is a promising non-contrast method for tissue characterization in the myocardium. Recent experiments have demonstrated that T1ρ is sensitive to edema in the acute setting and scar in chronic myocardial infarction. In chronic MI, T1ρ was found to have improved contrast compared to T2 MRI between scar and myocardial tissue because of suppression of low frequency contributions to the relaxation rate. T1ρ MRI can also be used in patients who are unable to receive contrast agents because of impaired renal function. Further research is needed to improve T1ρ methods in the clinic and to understand the molecular basis for T1ρ contrast in diseases of the heart.
Acknowledgements
The authors thank Dr. Ravinder Reddy for reviewing this work and providing valuable insight and expertise.
Sources of Funding
The authors gratefully acknowledge support from the National Institutes of Health, National Heart Lung and Blood Institute grants K99-HL108157, R01-HL063954, Cardiovascular Medical Research and Education Fund, the Academy of Finland and the Sigrid Juselius Foundation.
Footnotes
This article is part of the Topical Collection on Molecular Imaging
Conflict of Interest Yuchi Han, Timo Liimatainen, Robert C Gorman, Walter RT Witschey declare that they have no conflict of interest.
Human and Animal Rights and Informed Consent This article does not contain any studies with human or animal subjects performed by any of the authors.
Contributor Information
Yuchi Han, Email: Yuchi.Han@uphs.upenn.edu, Cardiovascular Division, Department of Medicine, Perelman School of Medicine, Hospital of the University of Pennsylvania, 9022 Gates, 3400 Spruce Street, Philadelphia, PA, USA.
Timo Liimatainen, Email: timo.liimatainen@uef.fi, Department of Biotechnology and Molecular Medicine, A.I. Virtanen Institute for Molecular Sciences, University of Eastern Finland, Kuopio, Finland.
Robert C. Gorman, Email: Robert.Gorman@uphs.upenn.edu, Department of Radiology, Perelman School of Medicine, University of Pennsylvania, Smilow Center for Translational Research, 3400 Civic Center Blvd, Bldg 421, 7th floor, Rm 103, Philadelphia, PA 19104, USA.
Walter R. T. Witschey, Email: witschey@mail.med.upenn.edu, Department of Radiology, Perelman School of Medicine, University of Pennsylvania, Smilow Center for Translational Research, 3400 Civic Center Blvd, Bldg 421, 7th floor, Rm 103, Philadelphia, PA 19104, USA.
References
Papers of particular interest, published recently, have been highlighted as:
• Of importance
•• Of major importance
- 1.Borthakur A, Mellon E, Niyogi S, Witschey W, Kneeland J, Reddy R. Sodium and T1rho MRI for molecular and diagnostic imaging of articular cartilage. NMR Biomed. 2006;19(7):781–821. doi: 10.1002/nbm.1102. [DOI] [PMC free article] [PubMed] [Google Scholar]
- 2.Witschey W, Borthakur A, Fenty M, Kneeland B, Lonner J, McArdle E, et al. T1rho MRI quantification of arthroscopically confirmed cartilage degeneration. Magn Reson Med. 2010;63(5):1376–1382. doi: 10.1002/mrm.22272. [DOI] [PMC free article] [PubMed] [Google Scholar]
- 3.Grohn O, Kettunen M, Makela H, Penttonen M, Pitkanen A, Lukkarinen J, et al. Early detection of irreversible cerebral ischemia in the rat using dispersion of the magnetic resonance imaging relaxation time, T1rho. J Cereb Blood Flow Metab. 2000;20(10):1457–1466. doi: 10.1097/00004647-200010000-00007. [DOI] [PubMed] [Google Scholar]
- 4.Duvvuri U, Poptani H, Feldman M, Nadal-Desbarats L, Gee M, Lee W, et al. Quantitative T1rho magnetic resonance imaging of RIF-1 tumors in vivo: detection of early response to cyclophosphamide therapy. Cancer Res. 2001;61(21):7747–7753. [PubMed] [Google Scholar]
- 5.Wang Y, Yuan J, Chu E, Go M, Huang H, Ahuja A, et al. T1rho MR imaging is sensitive to evaluate liver fibrosis: an experimental study in a rat biliary duct ligation model. Radiology. 2011;259(3):712–719. doi: 10.1148/radiol.11101638. [DOI] [PubMed] [Google Scholar]
- 6.Redfield A. Nuclear spin thermodynamics in the rotating frame. Science. 1969;164(3883):1015–1023. doi: 10.1126/science.164.3883.1015. [DOI] [PubMed] [Google Scholar]
- 7.Palmer A, Massi F. Characterization of the dynamics of biomacromolecules using rotating-frame spin relaxation NMR spectroscopy. Chem Rev. 2006;106(5):1700–1719. doi: 10.1021/cr0404287. [DOI] [PubMed] [Google Scholar]
- 8. Witschey W, Pilla J, Ferrari G, Koomalsingh K, Haris M, Hinmon R, et al. Rotating frame spin lattice relaxation in a swine model of chronic, left ventricular myocardial infarction. Magn Reson Med. 2010;64(5):1453–1460. doi: 10.1002/mrm.22543. This study reports T1ρ nuclear relaxation dispersion in excised myocardium and tissue 6–8 weeks post-infarction.
- 9.van Zijl P, Yadav N. Chemical exchange saturation transfer (CEST): what is in a name and what isn’t? Magn Reson Med. 2011;65(4):927–948. doi: 10.1002/mrm.22761. [DOI] [PMC free article] [PubMed] [Google Scholar]
- 10.Jin T, Autio J, Obata T, Kim S. Spin-locking versus chemical exchange saturation transfer MRI for investigating chemical exchange process between water and labile metabolite protons. Magn Reson Med. 2011;65(5):1448–1460. doi: 10.1002/mrm.22721. [DOI] [PMC free article] [PubMed] [Google Scholar]
- 11. Haris M, Nanga R, Singh A, Cai K, Kogan F, Hariharan H, et al. Exchange rates of creatine kinase metabolites: feasibility of imaging creatine by chemical exchange saturation transfer MRI. NMR Biomed. 2012;25(11):1305–1309. doi: 10.1002/nbm.2792. This study demonstrates a chemical exchange saturation transfer (CEST) MRI method for imaging creatine non-invasively in the heart.
- 12.Walker-Samuel S, Ramasawmy R, Torrealdea F, Rega M, Rajkumar V, Johnson S, et al. In vivo imaging of glucose uptake and metabolism in tumors. Nat Med. 2013;19(8):1067–1072. doi: 10.1038/nm.3252. [DOI] [PMC free article] [PubMed] [Google Scholar]
- 13.Muthupillai R, Flamm S, Wilson J, Pettigrew R, Dixon W. Acute myocardial infarction: tissue characterization with T1rho-weighted MR imaging–initial experience. Radiology. 2004;232(2):606–610. doi: 10.1148/radiol.2322030334. [DOI] [PubMed] [Google Scholar]
- 14. Witschey W, Zsido G, Koomalsingh K, Kondo N, Minakawa M, Shuto T, et al. In vivo chronic myocardial infarction characterization by spin locked cardiovascular magnetic resonance. J Cardiovasc Magn Reson. 2012;14:37. doi: 10.1186/1532-429X-14-37. T1ρ MRI signal enhancement was shown in vivo in a large animal model of chronic myocardial infarction and correlated with late gadolinium-enhanced MRI.
- 15. Musthafa H, Dragneva G, Lottonen L, Merentie M, Petrov L, Heikura T, et al. Longitudinal rotating frame relaxation time measurements in infarcted mouse myocardium in vivo. Magn Reson Med. 2013;69(5):1389–1395. doi: 10.1002/mrm.24382. This was a comprehensive serial study of T1ρ relaxation in mice post-MI.
- 16.Huber S, Muthupillai R, Lambert B, Pereyra M, Napoli A, Flamm S. Tissue characterization of myocardial infarction using T1rho: influence of contrast dose and time of imaging after contrast administration. J Magn Reson Imaging. 2006;24(5):1040–1046. doi: 10.1002/jmri.20720. [DOI] [PubMed] [Google Scholar]
- 17.Witschey W, Borthakur A, Elliott M, Fenty M, Sochor M, Wang C, et al. T1rho-prepared balanced gradient echo for rapid 3D T1rho MRI. J Magn Reson Imaging. 2008;28(3):744–754. doi: 10.1002/jmri.21444. [DOI] [PMC free article] [PubMed] [Google Scholar]
- 18.Dixon W, Oshinski J, Trudeau J, Arnold B, Pettigrew R. Myocardial suppression in vivo by spin locking with composite pulses. Magn Reson Med. 1996;36(1):90–94. doi: 10.1002/mrm.1910360116. [DOI] [PubMed] [Google Scholar]
- 19.Witschey W, Borthakur A, Elliott M, Mellon E, Niyogi S, Wallman D, et al. Artifacts in T1 rho-weighted imaging: compensation for B(1) and B(0) field imperfections. J Magn Reson. 2007;186(1):75–85. doi: 10.1016/j.jmr.2007.01.015. [DOI] [PMC free article] [PubMed] [Google Scholar]
- 20.Liimatainen T, Sorce D, O’Connell R, Garwood M, Michaeli S. MRI contrast from relaxation along a fictitious field (RAFF) Magn Reson Med. 2010;64(4):983–994. doi: 10.1002/mrm.22372. PMID: 20740665. [DOI] [PMC free article] [PubMed] [Google Scholar]
- 21.Wheaton A, Borthakur A, Reddy R. Application of the keyhole technique to T1rho relaxation mapping. J Magn Reson Imaging. 2003;18(6):745–749. doi: 10.1002/jmri.10412. [DOI] [PubMed] [Google Scholar]
- 22.Richardson OC, Scott MLI, Tanner SF, Waterton JC, Buckley DL. Overcoming the low relaxivity of gadofosveset at high field with spin locking. Magn Reson Med. 2012;68(4):1234–1238. doi: 10.1002/mrm.23316. [DOI] [PMC free article] [PubMed] [Google Scholar]
- 23.Moonen RPM, van der Tol P, Hectors SJCG, Nicolay K, Strijkers GJ. Proc Inter Soc Magn Reson Med. Salt Lake City, UT, USA: 2013. Enhanced contrast of superparamagnetic iron oxide contrast agents by spin-lock MR. [DOI] [PubMed] [Google Scholar]


