

Abstract
Background.
Muscle impairment is a common condition in older people and a powerful risk factor for disability and mortality. The aim of this study was to apply the European Working Group on Sarcopenia in Older People criteria to estimate the prevalence and investigate the clinical correlates of sarcopenia, in a sample of Italian community-dwelling older people.
Methods.
Cross-sectional analysis of 730 participants (74% aged 65 years and older) enrolled in the InCHIANTI study. Sarcopenia was defined according to the European Working Group on Sarcopenia in Older People criteria using bioimpedance analysis for muscle mass assessment. Logistic regression analysis was used to identify the factors independently associated with sarcopenia.
Results.
Sarcopenia defined by the European Working Group on Sarcopenia in Older People criteria increased steeply with age (p < .001), with 31.6% of women and 17.4% of men aged 80 years or older being affected by this condition. Higher education (odds ratio: 0.85; 95% CI: 0.74–0.98), lower insulin-like growth factor I (lowest vs highest tertile, odds ratio: 3.89; 95% CI: 1.03–14.1), and low bioavailable testosterone (odds ratio: 2.67; 95% CI: 1.31–5.44) were independently associated with the likelihood of being sarcopenic. Nutritional intake, physical activity, and level of comorbidity were not associated with sarcopenia.
Conclusions.
Sarcopenia identified by the European Working Group on Sarcopenia in Older People criteria is a relatively common condition in Italian octogenarians, and its prevalence increases with aging. Correlates of sarcopenia identified in this study might suggest new approaches for prevention and treatment of sarcopenia.
Key Words: Sarcopenia, Community-dwelling older people, Frail elderly.
Aging is accompanied by a change in body composition, including a loss of skeletal muscle mass, resulting in loss of strength and function that has been referred to as sarcopenia (1,2). Muscle impairment is associated with an increased risk of adverse outcomes including physical disability, poor quality of life, and death and thus may be an important and potentially reversible cause of morbidity and mortality in older persons. Since the coining of the term “sarcopenia” in 1989 by Rosenberg (1), many suggestions have been made to establish a clinically applicable definition. Recently, the European Working Group on Sarcopenia in Older People (EWGSOP) recommended using the presence of both low muscle mass and low muscle function (strength or performance) to define sarcopenia (3). This operational definition is based on the concept that defining sarcopenia only in terms of quantitative muscle mass amount would not capture other important age-related muscle changes that strongly affect muscle quality, strength, and muscle power, including but not limited to degeneration of motor neurons with intrinsic changes in muscle fibers and tissue structural organization, impairment in the neuromuscular junction, decrease of type II fibers proportion, impairment of sarcomeric or cytoskeletal signaling and structural protein, connective and fat muscle infiltration, and alteration of muscle metabolism (4,5). Accordingly, the International Working Group on Sarcopenia emphasizes that physical performance, as measured by gait speed, should be part for the diagnostic algorithm to identify people with reduced muscle mass and impaired physical function (1).
According to published reports, prevalence of sarcopenia varies between 3% and 52% depending on the study population, definition criteria, and the instruments used to assess muscle mass. However, very few studies used the definition proposed by EWGSOP to define sarcopenia in the general population (6,7).
Sarcopenia is a multifactorial process where nutritional, hormonal factors, lifestyle, and diseases exert an important role (8,9). Identification of potentially modifiable risk factors for sarcopenia is of pivotal importance for planning and implementing effective strategies to reduce sarcopenia-related adverse events, including falls, disability, institutionalization, and death.
Using data from the population-based InCHIANTI study, we conducted an observational cross-sectional study to estimate prevalence (assessed according to the EWGSOP criteria) and clinical correlates of sarcopenia.
Methods
Study Population
The InCHIANTI study is an epidemiological, population-based study of randomly selected older people living in the Chianti area, Tuscany, Italy. The study was designed to identify risk factors for late-life disability, as previously described (10). Briefly, participants were selected from the city registries of Greve in Chianti and Bagno a Ripoli using a multistage sampling method. In 1998, 1,453 persons who were randomly selected agreed to participate in the project. The Italian National Research Council on Aging Ethical Committee ratified the study protocol, and participants provided written consent to participate. For this analysis, researchers used data from the second follow-up performed 6 years after baseline (2004–2006), because bioelectrical impedance analysis (BIA) was not performed at baseline and at the first follow-up. Of the 1,067 participants alive at the second follow-up, researchers excluded 265 who did not perform any instrumental exams, 67 participants who did not undergo BIA because of one or more of the following exclusion criteria (leg edema, pacemaker, joint prosthesis, severe varicosities, home visit, refused), and five because indexes of physical performance (4-m walking speed and grip strength) were not collected. Compared with those included in the present analysis, individuals with missing data for BIA were significantly older, more likely to be female, had lower grip strength and slower walking speed.
Prevalence of sarcopenia was therefore assessed in 730 persons (age range 27–97 years), 345 men and 385 women. Analysis of factors associated with sarcopenia prevalence was conducted in 538 persons, 250 men and 288 women, aged 65 years and older.
Assessment of Sarcopenia
Sarcopenia was defined, according to the EWGSOP criteria, as presence of low muscle mass, plus low muscle strength, or low physical performance; conversely, the presence of low muscle mass, normal muscle strength, and physical performance were defined as presarcopenia (3).
Muscle mass was measured by BIA using a Quantum/S Bioelectrical Body Composition Analyzer (AkernSrl, Florence, Italy). Whole-body BIA measurements were taken between the right wrist and ankle with subject in a supine position. Muscle mass was calculated using the following BIA equation of Janssen and colleagues (11):
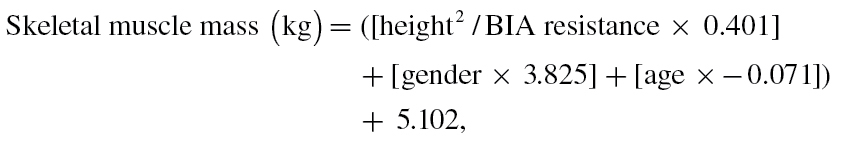 |
where height is measured in centimeters; BIA resistance is measured in ohms; for gender, men = 1 and women = 0; age is measured in years. This BIA equation was previously developed and cross validated against magnetic resonance imaging measures of whole-body muscle mass (12). Furthermore, in our study, muscle mass assessed by BIA was strongly and significantly correlated with midcalf muscle area assessed using quantitative computerized tomography technique (Pearson correlation coefficient .73, p < .0001). Absolute skeletal muscle mass (kg) was converted to skeletal muscle index standardizing by meters squared (kg/m2) (13). Using the cutoff points indicated in the EWGSOP consensus (3), low muscle mass was classified as the skeletal muscle index less than 8.87 and 6.42kg/m2 in men and women, respectively. Muscle strength was assessed by grip strength, measured using a hand-held dynamometer (hydraulic hand BASELINE; Smith & Nephew, Agrate Brianza, Milan, Italy). Two trials for each hand were performed and the highest value of the strongest hand was used in the analyses (12). Body mass index-adjusted values were used as cutoff point to classify low muscle strength (see Figure 1). Usual walking speed (m/s) on a 4-m course was used as objective measures of physical performance; speed lower than 0.8 m/s identified participants with low physical performance.
Figure 1.

Application of the European Working Group on Sarcopenia in Older People algorithm for the case finding of sarcopenia to the InCHIANTI sample.
Covariates
Sociodemographic characteristics
Sociodemographic variables (age, gender, smoking habit, education) were assessed through survey questions. Physical activity during the year prior to the interview was assessed through an interviewer-administered questionnaire as previously described (14).
Comorbidities
The baseline prevalence of specific medical conditions was established using standardized criteria that combined information from self-reported history, medical records, and a clinical medical examination. Diagnostic algorithms were modified versions of those created for the Women’s Health and Aging Study (15). Depressive symptoms were assessed by means of the standard Center for Epidemiologic Studies Depression scale (score >16). Cognitive impairment was defined as a mini–mental state exam score less than 24. The ankle–brachial index was obtained by dividing the lowest of the two systolic pressures measured at the ankle by the systolic pressure measured at the arm. Researchers considered peripheral arterial disease to be present in people having an ankle–brachial index less than 0.90 (16). Impaired renal function was assessed using the Cockcroft–Gault formula as creatinine clearance less than 60 mL/min.
Biochemical parameters
Blood samples were obtained from participants after a 12-hour fast. Serum and plasma were stored in a deep freezer at −80°C and were not thawed until analyzed. Hemoglobin (Hb) levels were analyzed as continuous and three-level ordinal variable according to the gender-specific definition previously used by Cesari and colleagues (17): (i) Hb levels lower than 12g/dL for women and 13g/dL for men, (ii) 12 ≤ Hb <14 for women and 13 ≤ Hb <15 for men, and (iii) Hb levels higher than 14g/dL for women and 15g/dL for men. Serum levels of vitamin D (25-hydroxyvitamin D) were measured by enzyme immunoassay kit. Serum interleukin-6 and tumor necrosis factor-α were measured by high-sensitivity enzyme-linked immunoabsorbent assays (kits from BIOSOURCE, Camarillo, CA). Sensitivity was 0.1 pg/mL for interleukin-6 and 0.09 pg/mL for tumor necrosis factor-α and the coefficient of variation was less than 7% for both tests. C-reactive protein was measured using an enzyme-linked immunosorbent assay and colorimetric competitive immunoassay (sensitivity 0.03mg/L and interassay coefficient of variation <5%). All cytokines were expressed in logarithmic form. Serum concentrations of insulin-like growth factor I (IGF-I) were measured by immunoradiometric assay, using commercial reagents (Diagnostic Systems Laboratories). Total testosterone concentrations were measured by immunoradiometric assays, using commercial reagents (Diagnostic Systems Laboratories Corporation, Webster, TX): the minimum detection limit was 0.03 nmol/L. Sex hormone-binding globulin was measured by a radioimmunoassay (Diagnostic Products, Los Angeles, CA) with a minimum detected concentration of 0.04 nmol/L and inter- and intra-assay coefficient of variations for three concentrations less than 6.9% and 3.6%, respectively (18). Concentrations of bioavailable testosterone (serum-free and albumin-bound testosterone, but not sex hormone-binding globulin) were calculated using the Vermeulen formula (19). A cutoff of 70 and 9.4ng/dL in men and women, respectively, were used for this specific analysis, because in previous analyses from the InCHIANTI study these were the levels below which there was higher risk of anemia and higher mortality risk in men (20,21).
Nutritional status
Data on dietary intake were collected by the food frequency questionnaire created for the European Prospective Investigation into Cancer and nutrition study (22). Body mass index was computed as weight in kg/height in meter squared.
Statistical Analysis
For descriptive purpose, baseline characteristics of the study population were compared according to presence or absence of sarcopenia, using a chi-square test and the analysis of variance model for categorical and continuous variables, respectively. Logistic regression models were used to assess the association between potential clinical and functional risk factors and the likelihood of having prevalent sarcopenia. Candidate variables to be included in the logistic model were selected on the basis of biological and clinical plausibility as risk factor for sarcopenia. To identify factors independently associated with prevalent sarcopenia, researchers first estimated odds ratios (ORs) and 95% CI controlling for age and gender. A multivariable logistic model was then computed including all the variables that were associated with the outcome at an α-level of 0.5 (age and gender adjusted). Finally, in order to remove unnecessary variables, a more parsimonious model was selected using a stepwise backward selection technique (p for removal .1). All analyses were performed using Stata 11.0 for Windows (StataCorp, College Station, TX).
Results
In this sample of 730 community-dwelling individuals, mean skeletal muscle index was 8.30 ± 1.76kg/m2 (8.58 ± 1.71 and 6.91 ± 1.27 kg/m2 for participants with and without sarcopenia, respectively). Skeletal muscle index was higher in men (p < .0001), inversely related to age (r = .29; p < .0001), and directly correlated with grip strength (r = .76; p < .0001) and walking speed (r = .33; p < .0001).
Using the algorithm proposed by the EWGSOP (Figure 1), of 730 InCHIANTI participants enrolled into the present analysis, 122 (16.7%) were identified as affected by presarcopenia and 55 (7.5%) by sarcopenia. Among them, 39 (5.3%) were sarcopenic because of low gait speed (n = 19, 2.6%) or poor grip strength (n = 20, 2.3%), whereas 16 (2.2%) had the concomitant presence of reduced muscle strength and slow gait speed.
Prevalence of sarcopenia increased steeply with age (Figure 2): from 2.6% and 1.2% respectively in women and men aged 70–74 years, to 31.6% and 17.4% in women and men older than 80 years. General characteristics of participants aged 65 years or older according to the presence of sarcopenia are presented in Table 1. Mean age of study participants was 77.1 (SD 5.5) years, and 53.5% were women. Compared with participants without sarcopenia, those diagnosed with sarcopenia were more likely to be female. After adjustment for age and sex, participants with sarcopenia showed a lower level of education (p = .012), had a lower body mass index (p = .022), and used a higher number of medications (p = .015). In univariate analyses, several chronic conditions were significantly associated with sarcopenia prevalence (congestive heart failure, cognitive impairment, depressive symptoms, Parkinson’s disease, peripheral arterial disease, impaired renal function, and hip fracture), however, after adjustment for age and gender, these associations were no longer significant, with the exception of chronic liver disease that was more frequent among participants with sarcopenia.
Figure 2.

Prevalence of sarcopenia and presarcopenia in men (left) and women (right) according to age decades.
Table 1.
Selected General Characteristics and Comorbidities of Study Participants Aged 65 and Older According to the Presence of Sarcopenia
| Characteristics | Sarcopenia | No Sarcopenia | p* | |||
|---|---|---|---|---|---|---|
| Low Muscle Mass | Normal Muscle Mass | All | p | |||
| N | 55 | 110 | 373 | 483 | ||
| Female (%) | 65.45 | 57.27 | 50.67 | 52.17 | .062 | |
| Age (y) | 83.8 ± 5.92 | 77.7 ± 4.87 | 75.9 ± 4.92 | 76.3 ± 4.96 | <.001 | |
| Education (y) | 4.69 ± 2.64 | 6.63 ± 3.74 | 6.15 ± 3.43 | 6.26 ± 3.51 | .001 | .012 |
| Smokers (%) | .402 | .892 | ||||
| Never | 61.82 | 56.36 | 55.76 | 55.90 | ||
| Former/current | 38.18 | 43.64 | 44.24 | 44.10 | ||
| BMI (kg/m2) | 25.4 ± 4.0 | 24.7 ± 3.3 | 28.4 ± 3.6 | 27.5 ± 3.9 | <.001 | .022 |
| SMI (kg/m2) | 6.57 ± 1.29 | 6.90 ± 1.28 | 8.58 ± 1.52 | 8.20 ± 1.63 | <.001 | <.001 |
| Fat mass index (kg/m2) | 9.78 ± 3.75 | 9.18 ± 2.99 | 10.02 ± 3.36 | 9.83 ± 3.29 | .913 | .316 |
| Grip strength (kg) | 21.24 ± 5.13 | 31.21 ± 8.48 | 34.12 ± 10.85 | 33.46 ± 10.42 | <.001 | <.001 |
| 4-m walking speed (m/s) | 0.728 ± 0.245 | 1.096 ± 0.161 | 1.067 ± 0.240 | 1.074 ± 0.224 | <.001 | <.001 |
| Physical activity (last year) (%) | .042 | .798 | ||||
| Low | 87.27 | 79.09 | 73.73 | 74.95 | ||
| Moderate/high | 12.73 | 20.91 | 26.27 | 25.05 | ||
| Number of medications | 4.00 ± 2.29 | 2.93 ± 2.03 | 2.69 ± 1.96 | 2.74 ± 1.98 | <.001 | .015 |
| Diabetes (%) | 10.91 | 15.45 | 11.26 | 12.22 | .778 | .728 |
| Hypertension (%) | 70.91 | 61.82 | 60.86 | 61.08 | .155 | .760 |
| Coronary heart disease (%) | 14.55 | 9.09 | 9.65 | 9.52 | .241 | .851 |
| Congestive heart failure (%) | 12.73 | 6.36 | 6.17 | 6.21 | .071 | .498 |
| Stroke (%) | 3.64 | 7.27 | 5.36 | 5.80 | .509 | .323 |
| Cognitive impairment (%) | 43.64 | 17.27 | 20.11 | 19.46 | <.001 | .524 |
| Depressive symptoms (%) | 39.62 | 30.56 | 22.34 | 24.21 | .015 | .484 |
| Parkinson’s disease (%) | 10.91 | 1.82 | 3.75 | 3.31 | .007 | .100 |
| PAD (%) | 20.00 | 9.09 | 8.58 | 8.70 | .008 | .500 |
| Cancer (%) | 3.64 | 3.64 | 5.09 | 4.76 | .707 | .565 |
| COPD (%) | 12.73 | 17.27 | 10.72 | 12.22 | .913 | .778 |
| Impaired renal function (%) | 64.71 | 46.79 | 28.57 | 32.77 | <.001 | .879 |
| Chronic liver disease (%) | 3.64 | 0.00 | 4.56 | 3.52 | .965 | .039 |
| Hip fracture (%) | 7.27 | 3.64 | 2.14 | 2.48 | .048 | .842 |
| Osteoarthritis (%) | 16.36 | 12.73 | 16.09 | 15.32 | .839 | .330 |
Notes: p values are for analysis of variance or Mantel–Haenszel test comparing subjects with and without sarcopenia. Data are means ± SD unless otherwise indicated. BMI = body mass index; COPD = chronic obstructive pulmonary disease; PAD = peripheral arterial disease; SMI = skeletal muscle index.
*Adjusted for age and sex.
Biochemical and nutritional characteristics of the study participants are presented in Table 2. Lower levels of Hb (p < .001), IGF-I (p = .06), and creatinine clearance (p = .089) tended to be more common in sarcopenic participants. Nutritional status was similar in both groups. Results from univariate and multivariate logistic regression models are presented in Table 3. After adjusting for potential confounders, researchers found an increased and significant risk of being sarcopenic with increasing age (OR: 1.21; 95% CI: 1.14–1.30), for people with lower IGF-I levels (OR: 3.89; 95% CI: 1.03–14.6) and lower bioavailable testosterone (OR: 2.67; 95% CI: 1.31–5.44). Conversely, a decreased probability of being sarcopenic was detected for individuals with higher level of education (OR: 0.85; 95% CI: 0.74–0.98), for those with higher body mass index (OR: 0.37; 95% CI: 0.13–1.03, p = .057), and higher level of Hb (OR: 0.43; 95% CI: 0.18–1.06, p = .066), although these relationships were of borderline statistical significance. Caloric intake and level of comorbidity were not associated with sarcopenia prevalence. Results were unchanged after exclusion of people younger than 70 years.
Table 2.
Biochemical and Nutritional Characteristics of Study Participants According to the Presence of Sarcopenia
| Characteristics | Sarcopenia | No Sarcopenia | p* | |||
|---|---|---|---|---|---|---|
| Low Muscle Mass | Normal Muscle Mass | All | p | |||
| N | 55 | 110 | 373 | 483 | ||
| Albumin (g/dL) | 4.09 ± 0.36 | 4.14 ± 0.34 | 4.25 ± 0.34 | 4.23 ± 0.34 | .005 | .580 |
| Hemoglobin (g/dL) | 13.00 ± 1.52 | 13.98 ± 1.35 | 14.21 ± 1.34 | 14.15 ± 1.34 | <.001 | <.001 |
| Bioavailable testosterone (ng/dL), median (IQR) | 7.8 (5.3–44.9) | 15.3 (6.1–89.8) | 33.7 (9.47–115.5) | 25.5 (8.6–111.4) | .004 | .188 |
| IGF-I (ng/mL) | 89.6 ± 47.1 | 109.9 ± 51.6 | 124.4 ± 58.4 | 121.0 ± 57.2 | <.001 | .060 |
| Vitamin D (nmol/L), median (IQR) | 38.7 (30.2–66.4) | 46.7 (34.7–77.6) | 58.9 (41.9–87.6) | 55.4 (40.2–86.1) | .297 | .930† |
| Creatinine clearance (mL/min) | 51.16 ± 19.69 | 62.69 ± 16.38 | 70.48 ± 18.64 | 68.68 ± 18.42 | <.001 | .089 |
| Inflammatory markers | ||||||
| IL-6 (log-pg/mL), median (IQR) | 1.31 (0.85–1.88) | 1.04 (0.61–1.60) | 1.09 (0.71–1.54) | 1.06 (0.70–1.54) | .003 | .941 |
| CRP (log-mg/dL), median (IQR) | 1.13 (0.58–1.74) | 0.77 (0.13–1.70) | 0.87 (0.20–1.54) | 0.83 (0.19–1.54) | .173 | .661 |
| TNF-α (log-pg/mL), median (IQR) | 1.72 (1.33–1.94) | 1.44 (1.04–1.69) | 1.37 (0.94–1.71) | 1.38 (0.97–1.70) | .003 | .252 |
| Nutritional status | ||||||
| Caloric intake (kcal/d/kg) | 29.90 ± 9.13 | 32.20 ± 8.69 | 29.18 ± 8.62 | 29.88 ± 8.72 | .988 | .776 |
| Alcohol intake (%) | .043 | .332 | ||||
| 0–20 (g/d) | 88.24 | 78.50 | 74.72 | 75.60 | ||
| >20 (g/d) | 11.76 | 21.50 | 25.28 | 24.40 | ||
| Protein intake (g/d/kg) | 1.15 ± 0.33 | 1.24 ± 0.35 | 1.12 ± 0.32 | 1.15 ± 0.33 | .982 | .776 |
| Vitamin D intake (mcg/d) | 1.55 ± 0.82 | 1.67 ± 0.76 | 1.75 ± 0.76 | 1.73 ± 0.76 | .118 | .612 |
Notes: p values are for analysis of variance or Mantel–Haenszel test comparing all the samples. Data are means ± SD unless otherwise indicated. CRP = C-reactive protein; IGF-I = insulin-like growth factor I; IL-6 = interleukin-6; IQR = interquartile range; TNF-α = tumor necrosis factor-α.
*Adjusted for age and sex.
†Adjusted for age, sex, and season.
Table 3.
Adjusted Odds Ratios for the Likelihood of Being Sarcopenic
| Variable | Age and Sex Adjusted Odds Ratio (95% CI) | p | Fully Adjusted* Odds Ratio (95% CI) | p | Fully Adjusted and Restricted† Odds Ratio (95% CI) | p |
|---|---|---|---|---|---|---|
| Age (y) | 1.26 (1.20–1.34) | <.001 | 1.22 (1.14–1.30) | <.001 | 1.22 (1.14–1.30) | <.001 |
| Sex (female) | 1.41 (0.73–2.27) | .299 | 0.91 (0.42–1.96) | .806 | ||
| Education (y) | 0.87 (0.77–0.99) | .039 | 0.85 (0.74–0.98) | .030 | 0.85 (0.74–0.98) | .027 |
| BMI (kg/m2) | ||||||
| ≤25 | 1.0 (referent) | 1.0 (referent) | 1.0 (referent) | |||
| >25, <30 | 0.72 (0.36–1.44) | .358 | 1.01 (0.48–2.15) | .967 | ||
| ≥30 | 0.31 (0.11–0.87) | .027 | 0.37 (0.12–1.11) | .075 | 0.37 (0.13–1.03) | .057 |
| Number of medications | 1.18 (1.02–1.36) | .022 | 1.12 (0.96–1.30) | .152 | ||
| Parkinson’s disease | 2.82 (0.88–9.00) | .080 | 1.78 (0.47–6.68) | .392 | ||
| Chronic liver disease | 3.18 (0.63–16.0) | .162 | ||||
| Hemoglobin (g/dL) | ||||||
| Hb <12 (F), Hb <13 (M) | 1.0 (referent) | 1.0 (referent) | 1.0 (referent) | |||
| 12 ≤ Hb <14 (F), 13 ≤ Hb <15 (M) | 0.60 (0.26–1.39) | .232 | 0.73 (0.29–1.83) | .502 | ||
| Hb ≥14 (F), Hb ≥15 (M) | 0.22 (0.08–0.61) | .004 | 0.35 (0.11–1.12) | .077 | 0.43 (0.18–1.06) | .066 |
| IGF-I (ng/mL) | ||||||
| Highest tertile | 1.0 (referent) | 1.0 (referent) | 1.0 (referent) | |||
| Intermediate tertile | 4.20 (1.17–15.1) | .028 | 3.29 (0.88–12.3) | .076 | 3.01 (0.83–10.9) | .094 |
| Lowest tertile | 3.39 (0.96–11.9) | .057 | 4.25 (1.09–16.6) | .037 | 3.89 (1.03–14.6) | .044 |
| Creatinine clearance (mL/min) | ||||||
| Highest tertile | 1.0 (referent) | |||||
| Intermediate tertile | 0.70 (0.20–2.44) | .581 | ||||
| Lowest tertile | 0.84 (0.25–2.80) | .774 | ||||
| Low bioavailable testosterone‡ | 3.01 (1.55–6.22) | .001 | 2.84 (1.33–6.07) | .007 | 2.70 (1.33–5.50) | .006 |
Notes: BMI = body mass index; F = female; Hb = hemoglobin; IGF-I = insulin-like growth factor I; M = male.
*Adjusted simultaneously for age, sex, education, BMI, number of medications, Parkinson’s disease, hemoglobin, IGF-I, and bioavailable testosterone.
†Restricted = backward stepwise regression analysis.
‡Low bioavailable testosterone level was defined as <70ng/dL in men, <9.4ng/dL in women.
Discussion
Our study suggests that sarcopenia, identified according to the EWGSOP definition, is relatively common among Italian community-dwelling older people aged 80 years and older, with no cases of sarcopenia identified in people younger than 70 years. Several chronic conditions were significantly associated with sarcopenia prevalence but, after adjustment for age and gender, none of these associations were confirmed. After adjustment for potential confounders, education, IGF-I, and bioavailable testosterone were inversely associated with the presence of sarcopenia. Obesity and higher IGF-I levels were also associated with the likelihood of being sarcopenic, although the association was barely statistically significant.
Two recent population-based studies estimated the prevalence of sarcopenia in European older persons applying the EWGSOP diagnostic criteria yielding contrasting results (6,7); in a sample of 409 Finnish community-dwelling women aged 70–80 years, Patil and colleagues (7) estimated the prevalence of sarcopenia as low as 0.9%, whereas in 103 men enrolled in the Hertfordshire Sarcopenia Study, Patel and colleagues (6) reported a prevalence of 6.8% and 7.8% according to the definition used to assess low muscle mass. Previous reports of Italian study populations (nursing home residents older than 70 years and oldest old residents living in community) showed higher prevalence of sarcopenia (32.8% and 25.4%, respectively) because of the different instruments used to define sarcopenia and the different age structure and living settings of the study populations (8,23). In respect to this variability, it is necessary to emphasize the importance of adopting an operational and standardized definition of sarcopenia in multidimensional geriatric assessment.
Compared with previous reports, researchers investigated a comprehensive set of clinical and biochemical conditions that were potentially involved in the pathogenesis of sarcopenia. Several mechanisms in fact may be involved in the onset and progression of sarcopenia: the aging process over the life course, early life developmental influences, malnutrition, bed rest or sedentary lifestyle, chronic diseases, inflammatory disease, endocrine disorders, and certain drug treatments (16,24).
Although statistical significance was not fully achieved, multivariable analyses suggested a decreased likelihood of having sarcopenia for participants with higher level of Hb compared to individuals with anemia. As previously described, Hb levels are associated with muscle and fat mass changes, and anemia might affect physical performance, and consequently quality of life, through various pathways generally involving decreased oxygenation of tissues (17). A key question is whether anemia may be considered an independent risk factor for loss of skeletal muscle mass and functional decline, or whether it should be considered only an epiphenomenon accompanying several chronic diseases or chronic inflammatory process linked to the aging process and loss of muscle. In this regard, anemia is often associated with increased concentrations of inflammatory markers, which in turn have been associated with poor physical performance and muscle strength and are strong predictors of physical decline over time (25). A further potential explanation might be the influence of testosterone levels on body composition and anemia. In fact, a direct relationship between serum testosterone levels and hematopoiesis has been demonstrated (26). Furthermore, bioavailable testosterone is related to lower extremity strength and function, and testosterone treatment in older hypogonadal men increased hand grip and lower extremity muscle strength (27). However, in our study, the relationship between Hb level and sarcopenia was not influenced by age, gender, inflammatory markers, and testosterone levels, reinforcing the hypothesis of a direct effect of anemia on muscular and functional decline. Conversely, researchers found that, even after adjustment for all covariates, there was an independent association between higher level of bioavailable testosterone and lower risk of being sarcopenic, suggesting that testosterone may be one independent part of a multifactorial system affecting skeletal muscle mass and, consequently, influencing strength and function in older people.
In agreement with several studies, researchers found an independent relation between higher level of IGF-I and sarcopenia prevalence, suggesting that IGF-I might be an important modulator of muscle mass and function not only during the developmental period but across the entire life span (28). Recent findings show that low plasma IGF-I levels are associated with poor knee extensor muscle strength, slow walking speed, and self-reported difficulty with mobility tasks (29). These findings suggest a role for IGF-I in disability as well as a potential target population for interventions to raise IGF-I levels.
Physical exercise, in combination with adequate protein and energy intake, is considered a key component of the prevention and management of sarcopenia (2). However, in contrast with previous studies, researchers did not find an association of sarcopenia with low physical activity (30). Although individuals with sarcopenia were less likely to report moderate or high level of physical activity in the preceding year, after adjusting for age and gender, this association was no longer significant.
Similarly, researchers did not observe differences either in relation to nutritional status among people with or without sarcopenia. There are some potential explanations for these somehow unexpected negative findings including misclassification in the self-report assessment of physical activity level and nutritional intake, and/or healthy selection bias due to the earlier mortality or loss to follow-up of individuals with poorer health status at the time of cohort inception.
Finally, our findings reinforced the potential role of higher educational level in preserving good health in later life. Even adjusting for several potential confounders, years of education were inversely associated with the likelihood of being sarcopenic. There are multiple potential pathways explaining the association of higher educational level with low muscle mass and poor physical performance. Indeed, high educational level might favor healthier lifestyle, including better nutrition and more intensive leisure time physical activity over the life span, and, as a consequence, it might be related, in late life, to better muscle mass and better overall health status. Our data suggest that educational level might be specifically correlated with muscle strength and walking speed rather than muscle mass alone (Table 1). Higher education level might be related to better cognitive reserve that in turn has been strongly associated with walking speed and other performance tests in older persons (31). On the other hand, independent of the presence of low muscle mass, low grip strength and slow walking speed might be the consequence of poor muscle quality, a condition referred to as dynapenia (32).
In interpreting these findings, some limitations should be considered. First, the cross-sectional and observational design of the study did not allow us to clarify any temporal or cause–effect relationships between sarcopenia and its associated factors. Second, of the 1,453 original participants of the inCHIANTI study, only 1,067 attended the second follow-up: selective survival and a healthy selection bias have to be taken into account. Furthermore, since 270 participants were excluded because of health-related conditions, it is likely that our analyses might have underestimated the true prevalence of sarcopenia in this population. Third, the limited number of persons with sarcopenia may have caused limited statistical power in multivariable analyses, increasing the likelihood of type II error. Finally, the use of BIA for muscle mass assessment presents some drawbacks mainly due to the hydration problems usually observed in older persons that may result in an underestimation of the body fat and an overestimation of fat-free mass. On the other hand, BIA is inexpensive, easy to use, readily reproducible, and appropriate for both ambulatory and bedridden patients, considered as a portable alternative to dual-energy X-ray absorptiometry (33), and its standardized use may favor a widespread assessment of body composition in everyday clinical practice.
In summary, in this sample of Italian community- dwelling older adults, the EWGSOP criteria identify sarcopenia as a relatively common one only among individuals aged 80 years and older, whereas no cases were detected before the age of 70. Several conditions whose prevention could at least partially reduce the onset and progression of sarcopenia were identified. Further research is needed to establish the role of sarcopenia, as defined with EWGSOP criteria, on determining clinical outcomes like mortality, morbidity, institutionalization, and falls and to provide evidence for specific interventions aimed at preventing and treating sarcopenia and its consequences.
Funding
The InCHIANTI Follow-up 2 study (2004–2006) was financed by the U.S. National Institute on Aging (Contract: N01-AG-5-0002); supported in part by the Intramural research program of the National Institute on Aging, National Institutes of Health, Baltimore, Maryland.
References
- 1. Rosenberg IH. Sarcopenia: origins and clinical relevance. J Nutr. 1997;127(suppl 5):990S–991S [DOI] [PubMed] [Google Scholar]
- 2. Fielding RA, Vellas B, Evans WJ, et al. Sarcopenia: an undiagnosed condition in older adults. Current consensus definition: prevalence, etiology, and consequences. International working group on sarcopenia. J Am Med Dir Assoc. 2011;12:249–256 [DOI] [PMC free article] [PubMed] [Google Scholar]
- 3. Cruz-Jentoft AJ, Baeyens JP, Bauer JM, et al. European Working Group on Sarcopenia in Older People Sarcopenia: European consensus on definition and diagnosis: report of the European Working Group on Sarcopenia in Older People. Age Ageing. 2010;39:412–423 [DOI] [PMC free article] [PubMed] [Google Scholar]
- 4. Narici MV, Maganaris CN, Reeves ND, Capodaglio P. Effect of aging on human muscle architecture. J Appl Physiol. 2003;95:2229–2234 [DOI] [PubMed] [Google Scholar]
- 5. Faulkner JA, Larkin LM, Claflin DR, Brooks SV. Age-related changes in the structure and function of skeletal muscles. Clin Exp Pharmacol Physiol. 2007;34:1091–1096 [DOI] [PubMed] [Google Scholar]
- 6. Patel HP, Syddall HE, Jameson K, et al. Prevalence of sarcopenia in community-dwelling older people in the UK using the European Working Group on Sarcopenia in Older People (EWGSOP) definition: findings from the Hertfordshire Cohort Study (HCS). Age Ageing. 2013;42:378–384 [DOI] [PMC free article] [PubMed] [Google Scholar]
- 7. Patil R, Uusi-Rasi K, Pasanen M, Kannus P, Karinkanta S, Sievänen H. Sarcopenia and osteopenia among 70-80-year-old home- dwelling Finnish women: prevalence and association with functional performance. Osteoporos Int. 2013;24:787–796 [DOI] [PubMed] [Google Scholar]
- 8. Landi F, Liperoti R, Fusco D, et al. Prevalence and risk factors of sarcopenia among nursing home older residents. J Gerontol A Biol Sci Med Sci. 2012;67:48–55 [DOI] [PubMed] [Google Scholar]
- 9. Giovannini S, Marzetti E, Borst SE, Leeuwenburgh C. Modulation of GH/IGF-1 axis: potential strategies to counteract sarcopenia in older adults. Mech Ageing Dev. 2008;129:593–601 [DOI] [PMC free article] [PubMed] [Google Scholar]
- 10. Ferrucci L, Bandinelli S, Benvenuti E, et al. Subsystems contributing to the decline in ability to walk: bridging the gap between epidemiology and geriatric practice in the InCHIANTI study. J Am Geriatr Soc. 2000;48:1618–1625 [DOI] [PubMed] [Google Scholar]
- 11. Janssen I, Baumgartner RN, Ross R, Rosenberg IH, Roubenoff R. Skeletal muscle cutpoints associated with elevated physical disability risk in older men and women. Am J Epidemiol. 2004;159:413–421 [DOI] [PubMed] [Google Scholar]
- 12. Lauretani F, Russo CR, Bandinelli S, et al. Age-associated changes in skeletal muscles and their effect on mobility: an operational diagnosis of sarcopenia. J Appl Physiol. 2003;95:1851–1860 [DOI] [PubMed] [Google Scholar]
- 13. Janssen I, Heymsfield SB, Baumgartner RN, Ross R. Estimation of skeletal muscle mass by bioelectrical impedance analysis. J Appl Physiol. 2000;89:465–471 [DOI] [PubMed] [Google Scholar]
- 14. Patel KV, Coppin AK, Manini TM, et al. Midlife physical activity and mobility in older age: The InCHIANTI study. Am J Prev Med. 2006;31:217–224 [DOI] [PMC free article] [PubMed] [Google Scholar]
- 15. Guralnik JM, Fried LP, Simonsick EM, Kasper JD, Lafferty ME, eds. The Women’s Health and Aging Study: Health and Social Characteristics of Older Women with Disability. Bethesda, MD: National Institute on Aging; 1995, (NIH pub. no. 95-4009). [Google Scholar]
- 16. Volpato S, Bianchi L, Lauretani F, et al. Role of muscle mass and muscle quality in the association between diabetes and gait speed. Diabetes Care. 2012;35:1672–1679 [DOI] [PMC free article] [PubMed] [Google Scholar]
- 17. Cesari M, Penninx BW, Lauretani F, et al. Hemoglobin levels and skeletal muscle: results from the InCHIANTI study. J Gerontol A Biol Sci Med Sci. 2004;59:249–254 [DOI] [PubMed] [Google Scholar]
- 18. Valenti G, Denti L, Maggio M, et al. Effect of DHEAS on skeletal muscle over the life span: the InCHIANTI study. J Gerontol A Biol Sci Med Sci. 2004;59:466–472 [DOI] [PubMed] [Google Scholar]
- 19. Vermeulen A, Verdonck L, Kaufman JM. A critical evaluation of simple methods for the estimation of free testosterone in serum. J Clin Endocrinol Metab. 1999;84:3666–3672 [DOI] [PubMed] [Google Scholar]
- 20. Maggio M, Lauretani F, Ceda GP, et al. Relationship between low levels of anabolic hormones and 6-year mortality in older men: the aging in the Chianti Area (InCHIANTI) study. Arch Intern Med. 2007;167:2249–2254 [DOI] [PMC free article] [PubMed] [Google Scholar]
- 21. Ferrucci L, Maggio M, Bandinelli S, et al. Low testosterone levels and the risk of anemia in older men and women. Arch Intern Med. 2006;166:1380–1388 [DOI] [PMC free article] [PubMed] [Google Scholar]
- 22. Pisani P, Faggiano F, Krogh V, Palli D, Vineis P, Berrino F. Relative validity and reproducibility of a food frequency dietary questionnaire for use in the Italian EPIC centres. Int J Epidemiol. 1997;26(suppl 1):S152–S160 [DOI] [PubMed] [Google Scholar]
- 23. Landi F, Liperoti R, Russo A, et al. Sarcopenia as a risk factor for falls in elderly individuals: results from the ilSIRENTE study. Clin Nutr. 2012;31:652–658 [DOI] [PubMed] [Google Scholar]
- 24. Muscaritoli M, Anker SD, Argilés J, et al. Consensus definition of sarcopenia, cachexia and pre-cachexia: joint document elaborated by Special Interest Groups (SIG) “cachexia-anorexia in chronic wasting diseases” and “nutrition in geriatrics”. Clin Nutr. 2010;29:154–159 [DOI] [PubMed] [Google Scholar]
- 25. Cesari M, Penninx BW, Pahor M, et al. Inflammatory markers and physical performance in older persons: the InCHIANTI study. J Gerontol A Biol Sci Med Sci. 2004;59:242–248 [DOI] [PubMed] [Google Scholar]
- 26. Ellegala DB, Alden TD, Couture DE, Vance ML, Maartens NF, Laws ER., Jr Anemia, testosterone, and pituitary adenoma in men. J Neurosurg. 2003;98:974–977 [DOI] [PubMed] [Google Scholar]
- 27. Sih R, Morley JE, Kaiser FE, Perry HM, 3rd, Patrick P, Ross C. Testosterone replacement in older hypogonadal men: a 12-month randomized controlled trial. J Clin Endocrinol Metab. 1997;82:1661–1667 [DOI] [PubMed] [Google Scholar]
- 28. Barbieri M, Ferrucci L, Ragno E, et al. Chronic inflammation and the effect of IGF-I on muscle strength and power in older persons. Am J Physiol Endocrinol Metab. 2003;284:E481–E487 [DOI] [PubMed] [Google Scholar]
- 29. Cappola AR, Bandeen-Roche K, Wand GS, Volpato S, Fried LP. Association of IGF-I levels with muscle strength and mobility in older women. J Clin Endocrinol Metab. 2001;86:4139–4146 [DOI] [PubMed] [Google Scholar]
- 30. Kortebein P, Ferrando A, Lombeida J, Wolfe R, Evans WJ. Effect of 10 days of bed rest on skeletal muscle in healthy older adults. JAMA. 2007;297:1772–1774 [DOI] [PubMed] [Google Scholar]
- 31. Ble A, Volpato S, Zuliani G, et al. Executive function correlates with walking speed in older persons: the InCHIANTI study. J Am Geriatr Soc. 2005;53:410–415 [DOI] [PubMed] [Google Scholar]
- 32. Manini TM, Clark BC. Dynapenia and aging: an update. J Gerontol A Biol Sci Med Sci. 2012;67:28–40 [DOI] [PMC free article] [PubMed] [Google Scholar]
- 33. Wang JG, Zhang Y, Chen HE, et al. Comparison of two bioelectrical impedance analysis devices with dual energy X-ray absorptiometry and magnetic resonance imaging in the estimation of body composition. J Strength Cond Res. 2013;27:236–243 [DOI] [PubMed] [Google Scholar]