

Abstract
This study investigated the coculture of chondrocytes and mesenchymal stem cells (MSCs) on electrospun fibrous polymer scaffolds to produce polymer/extracellular matrix (ECM) hybrid constructs with the objective of reducing the number of chondrocytes necessary to produce ample cartilage-like ECM within the scaffolds. To generate these hybrid constructs, electrospun poly(ɛ-caprolactone) fibrous scaffolds were seeded at both high and low initial densities with five different ratios of chondrocytes to MSCs: 1:0, 1:1, 1:3, 1:5, and 0:1, and cultured for 7, 14, and 21 days. Glycosaminoglycan production and distribution within the three coculture groups was similar to quantities generated by chondrocyte-only controls. Conversely, as the concentration of chondrocytes was increased, the collagen content of the constructs also increased at each time point, with a 1:1 chondrocyte to MSC ratio approximating the collagen production of chondrocytes alone. Histological staining suggested that cocultured constructs mimicked the well-distributed ECM patterns of chondrocyte generated constructs, while improving greatly over the restricted distribution of matrix within MSC-only constructs. These results support the capacity of cocultures of chondrocytes and MSCs to generate cartilaginous matrix within a polymeric scaffold. Further, the inclusion of MSCs in these cocultures enables the reduction of chondrocytes needed to produce cell-generated ECM.
Introduction
Articular cartilage is a specialized tissue whose structure and function is mainly provided by its dense extracellular matrix (ECM), which not only operates as a physical support for the cells and tissue, but also directs cellular behavior through integrin–ligand interactions. Motivated by this native structure, a variety of cartilage tissue engineering strategies to date have incorporated ECM, including sponges, coated scaffolds, and hydrogels of glycosaminoglycans (GAGs) or collagen, as well as decellularized tissues.1–13 Whereas it is possible to generate ECM-derived scaffolds from components extracted directly from tissues, utilizing cell cultures to generate ECM/polymer composite scaffolds may be a more promising approach. This method has the added benefit of producing constructs with not only structural components, namely the polymeric scaffold and ECM components, but also the inclusion of growth factors and regulatory proteins beneficial for directing tissue regeneration.14–16 Previous efforts have focused on coating fibrous poly(ɛ-caprolactone) (PCL) scaffolds with ECM produced by culturing chondrocytes under perfused flow, followed by decellularization.17 This work expands upon these strategies by examining the PCL/ECM constructs generated by incorporating different cell types involved in cartilage development at various ratios and seeding densities.
Tissue engineering approaches for cartilage regeneration have been primarily focused on two different cell sources, chondrocytes, and mesenchymal stem cells (MSCs). Autologous chondrocyte implantation has shown promising results clinically especially in second- and third-generation procedures when implantation is accompanied by a supporting biomaterial and/or arthroscopic techniques.18,19 However, there are still limitations to be addressed such as isolating sufficient cell numbers from healthy tissue,19–21 dedifferentiation upon chondrocyte expansion,19,21–23 and donor-site morbidity.18,24 Ultimately, the reduction of biopsy size or necessity would be positive for the future treatment of articular cartilage lesions. Similarly, the capacity to utilize chondrocytes as a primary cell source for tissue engineering efforts is limited since many standard approaches necessitate sizeable cell numbers.
To overcome the limitations of chondrocytes as a cell source, stem cells, specifically MSCs, are currently being investigated for use in cartilage regeneration. MSCs may be useful for this purpose as they are readily present within the bone marrow of adults in addition to being a precursor cell type to the chondrocytic lineage.18,25 Further, bone marrow MSCs have been shown to maintain stemness and chondrogenic differentiation capacity upon expansion in vitro allowing sufficient cell numbers for use in tissue engineering practices.23,26 However, previous studies have shown that while MSCs do undergo chondrogenesis, less matrix is produced by MSCs than by chondrocytes cultured similarly.27 As the ultimate objective is to generate an acellular implantable construct with deposits of cartilage-like ECM to direct tissue repair, it is necessary to develop culture conditions in which ECM production is optimal. For this reason, the utilization of undifferentiated MSCs is less favorable due to limited matrix production.
Considering the strengths and weaknesses of these two different cell sources, we hypothesized that a mixed coculture approach would overcome the various shortcomings of the individual cell types. Coculturing chondrocytes together with MSCs takes advantage of both secreted factors and direct cell-to-cell contact to direct differentiation and potentially stimulate matrix production.28–30 The objective of this study was to determine the optimal ratio of chondrocytes to MSCs that results in dense and well-distributed cartilage-like ECM deposition within a fibrous polymeric scaffold, while minimizing the required number of chondrocytes. This was performed by culturing in fetal bovine serum (FBS) containing media without exogenous growth factor supplementation. In addition, since previous efforts have indicated that higher cell densities generally lead to improved cartilage-like matrix production, most likely due to increased cell-to-cell contacts as well as the presence of more cells to produce ECM,6,31 the influence of seeding density on ECM production by cocultures was also investigated in an effort to improve the deposition of cartilage-like ECM within the constructs.
Materials and Methods
Experimental design
A full factorial design was utilized with two factors, coculture ratio and seeding density, with five and two levels, respectively. The five coculture ratios of chondrocytes to MSCs were 1:0, 1:1, 1:3, 1:5, and 0:1. The two different seeding densities were 35,000 cells/scaffold and 70,000 cells/scaffold on 3-mm-diameter scaffolds 1 mm thick. The resulting 10 groups were sampled at three time points: 7, 14, and 21 days.
Electrospinning
Using a horizontal electrospinning apparatus, nonwoven microfiber meshes were fabricated by extruding 18% (w/w) PCL (Durect, Birmingham, AL) in a 5:1 (v/v) ratio of chloroform:methanol at 25 mL/h with an applied voltage of 30 kV. The distance from the blunt 16G needle to the collector plate was 36 cm. Mats were electrospun until a thickness of 1 mm was reached. To determine the average fiber diameter of the fibrous meshes, three samples (n=3; Ø=3 mm) were taken from different locations on each mat. On each individual sample, three discrete locations were imaged at a magnification of 1000× using a scanning electron microscope (SEM; FEI Quanta 400 ESEM FEG; FEICo, Hillsboro, OR). From each SEM image, the diameters of five separate fibers were measured using the manufacturer supplied software for a total of 45 measurements. Before utilizing scaffolds from separate electrospun mats, it was first determined that the average fiber diameters for the different mats were not statistically different (p>0.05).
Cell isolation and expansion
In this study, bovine chondrocytes were cultured together with rabbit bone marrow-derived MSCs because, despite combining cells from two different species, this has been previously validated as a successful model for investigating coculture interactions.32,33 The rationale for using rabbit MSCs is that rabbits are a commonly used in vivo model for articular cartilage defects.34–36 Although xenogeneic, bovine chondrocytes are incorporated into this coculture model to reduce the number of animals necessary as there is a relative paucity of articular chondrocytes and rabbit joints are small in size.
Rabbit MSCs were isolated using previously described methods.17,37–40 Bone marrow was aspirated from the tibiae of six male New Zealand White rabbits weighing 0.9–1.2 kg at the time of harvest. Marrow aspirates were then rinsed with a general medium composed of the Dulbecco's modified Eagle's medium (DMEM; Invitrogen, Carlsbad, CA), 10% FBS, and 1% penicillin–streptomycin–fungizone (Gibco, Grand Island, NY) and centrifuged to remove fat and other debris. The rinsed pellets were then suspended in the general medium and plated in tissue culture flasks. The medium was changed every 3 days. When adhered cells neared confluency, ∼2 weeks after harvest, the cells were trypsinized and pooled for cryopreservation in a freezing medium containing 20% FBS and 10% dimethyl sulfoxide. Before seeding PCL scaffolds, MSCs were thawed at 37°C and then expanded to passage 3 in the general medium.
Bovine chondrocytes were isolated as previously described.17,41 Legs from 7- to 10-day-old calves were obtained from Research 87 (Research 87, Boston, MA) within 24 h of slaughter. The knee joint was isolated by dissecting the muscles and other soft tissues away from the bone. Upon isolating the distal femur, cartilage from the femoral condyle was minced and rinsed with phosphate-buffered saline (PBS). The cartilage was then digested with 0.2 wt% collagenase type II (Worthington, Lakewood, NJ) in culture medium for 16 h under agitation in an incubator. Chondrocytes from four legs were pooled and cryopreserved for later use. Before seeding PCL scaffolds, chondrocytes were removed from cryopreservation and expanded for 7 days in the chondrocyte growth medium containing DMEM, 10% FBS, 10 mM HEPES buffer (Gibco), 1% nonessential amino acids (Gibco), 0.28 mM ascorbic acid (Sigma, St. Louis, MO), 0.4 mM L-proline (Sigma), and 1% penicillin–streptomycin–fungizone (Gibco).
PCL/ECM construct generation
PCL mesh scaffolds were die cut from electrospun mats into 3-mm-diameter discs and press fit into polycarbonate seeding cassettes (inner diameter=2.94 mm, height=9.09 mm). The scaffolds and seeding cassettes were then ethylene oxide sterilized for 12 h. Before seeding, a decreasing ethanol gradient (100%–35%) was used to hydrate the PCL scaffolds. The scaffolds were then rinsed twice with PBS and incubated overnight in the general medium.
Chondrocytes and MSCs were then trypsinized and cell seeding solutions composed of the five coculture ratios were prepared by mixing together in chondrocyte growth medium for each of the two seeding densities described in the Experimental Design section. The two seeding densities were prepared as cell suspension concentrations of 1.75 million cells/mL and 3.5 million cells/mL of which 20 μL was seeded on the upper surface of the scaffold translating to seeding numbers of 35,000 cells/scaffold and 70,000 cells/scaffold, respectively. After a 2 h preattachment period, additional chondrocyte growth medium was added to each well and the scaffolds were cultured within the seeding cassettes for a 24 h attachment period. At the completion of the 24 h attachment period, the scaffolds were unconfined and placed in ultralow attachment 24-well plates (Costar, St. Louis, MO) with the chondrocyte growth medium. Scaffolds were cultured for 7, 14, and 21 days with media changes every 3 days. At the end of each culture period, the constructs were removed from the culture medium, rinsed three times with PBS, and then processed accordingly for the different analytical methods described below.
Biochemical assays
In preparation for biochemical assays, at the completion of each culture period, two scaffolds were pooled in 500 μL of proteinase K [1 mg/mL proteinase K (Sigma), 185 μg/mL iodacetamide (Sigma), and 10 μg/mL pepstatin A (Sigma) in Tris/ethylenediaminetetraacetic acid (EDTA) buffer containing 6.055 mg/mL tris(hydroxymethyl aminomethane) (Sigma) and 372 μg/mL EDTA at pH 7.6] and digested at 56°C for 16 h. The digested components of the samples (n=4) were then released into a solution using three freeze/thaw/sonicate cycles lasting 10 min each. Freezing was performed by immersion in liquid nitrogen, and then a 37°C water bath was used to thaw the samples.
The cellularity of each sample was analyzed using a fluorometric PicoGreen DNA assay kit (Molecular Probes, Eugene, OR). As performed in earlier studies,42 double-stranded DNA was quantified by excitation at 490 nm and fluorescence emission intensity was detected at 520 nm. All samples and standards were performed in duplicate. The DNA content per scaffold was calculated using a standard curve, while taking into consideration sample dilution as well as the pooling of scaffolds before proteinase K digestion.
Quantification of GAG deposition was determined using the 1,9-dimethymethylene blue colorimetric assay with absorbance measured at 520 nm.42 Chondroitin sulfate standards and proteinase K digested samples were performed in duplicate with concentration values of duplicates averaged during analysis to limit experimental error. Finally, calculated GAG concentrations were adjusted for dilution and scaffold pooling to display the results as GAG content per scaffold.
Total collagen content was determined by first quantifying hydroxyproline content of days 7, 14, and 21 samples. Initially, 100 μL of proteinase K digested sample was hydrolyzed with an equal amount of 12 M HCl at 115°C for 4 h. Hydrolyzed samples were then cooled to room temperature and placed under continuous nitrogen flow to dry. The samples were then rehydrated with 500 μL ddH2O. About 100 μL of the rehydrated sample was then combined with 50 μL chloramine-T (Sigma) and 50 μL p-dimethylaminobenzaldehyde (Sigma) and incubated at 60°C for 30 min, as described previously.43,44 Absorbance was measured at 570 nm in a plate reader with samples run in duplicate alongside hydroxyproline standards of known concentration. Absorbance correlated to the hydroxyproline content was then calculated as the amount of collagen per scaffold by correcting for dilution and scaffold pooling and then converting the amount of hydroxyproline per scaffold to collagen content using a previously reported 1:10 hydroxyproline to collagen ratio.44
Histology
To prepare constructs for histological analysis, after being removed from culture, the samples were fixed overnight in 10% buffered formalin at 4°C. Following fixation, an increasing ethanol gradient ranging from 70% to 100% in 10% increments for 5 min each was employed to dehydrate the samples. Samples were transferred to HistoPrep frozen tissue embedding media (Fisher, Fair Lawn, NJ) and left at room temperature for a minimum of 24 h to fully permeate the specimens. Treated samples were frozen into blocks within the embedding medium, cut with a cryotome into 8-μm-thick sections perpendicular to the seeding surface (CM1850; Leica Microsystems, Bannockburn, IL), and mounted onto glass Superfrost Plus microscope slides (VWR, Batavia, IL). Before staining, slides were incubated at 45°C on a slide warmer for a minimum of 7 days to ensure sample adhesion.
To visualize the distribution of GAGs deposited within the scaffolds, sections were stained with Safranin O using previously detailed methods.42 Stained sections were imaged using light microscopy (Zeiss AxioImager.Z2, Göttingen, Germany) and images were captured using a Zeiss AxioCamMRc 5 digital camera. Image exposure and white balance were corrected using automatic functions in the manufacturer supplied software (AxioVision 4.8; Zeiss).
The distribution of collagen deposited by the different culture conditions was imaged using Picrosirius Red staining. Samples were first hydrated with ddH2O and then stained with a Picrosirius Red solution composed of 1 g/L Direct Red 80 (Sigma Aldrich, St. Louis, MO) in saturated aqueous picric acid for 1 h. After staining, samples were rinsed twice with 0.5% glacial acetic acid. The sections were then air-dried and imaged using the aforementioned light microscope with the captured images corrected for white balance and exposure using the manufacturer supplied software.
Cellular distribution throughout the constructs was visualized by staining nuclei using nuclear fast red. Sections were first hydrated with ddH2O and then stained for 5 min with 1 g/L nuclear fast red (Sigma Aldrich) in 50 g/L aluminum sulfate, after which the slides were rinsed with ddH2O and air-dried. Nuclear fast red-stained slides were then imaged using the previously detailed methods.
Scanning electron microscopy
To visualize the surface morphology of the cellular constructs, samples were first fixed with 2.5% glutaraldehyde for 2 h and then rinsed with PBS. Afterward, an increasing ethanol gradient ranging from 30% to 100% was used to dehydrate the samples before air drying. The prepared samples were then coated with 20 nm of gold using a Denton Desk V sputter-coater system (Denton Vacuum LLC, Moorestown, NJ) and imaged using SEM (FEI Quanta 400 ESEM FEG; FEICo). Samples for both seeding densities and all culture ratios were imaged in this fashion at days 7, 14, and 21 to observe the timewise progression of ECM deposition and cell proliferation as it related to surface morphology.
Statistical analysis
Before utilizing scaffolds from separate electrospun mats, an one-way ANOVA followed by the Tukey's honestly significant difference test was utilized to ensure that there was no significant difference in the fiber diameters among mats used for cell seeding (n=3; p>0.05). Biochemical assay results are displayed as the mean±standard deviation for (n=4) samples, unless otherwise indicated. A two-way ANOVA was performed to determine statistical significance for both scaffold cellularity and ECM deposition as determined by GAG and total collagen content. If the ANOVA showed significant differences, then a Tukey's honestly significant difference test was utilized to perform multiple comparisons post hoc. For both the ANOVA and Tukey's tests, differences were considered significant if p<0.05.
Results
Electrospun scaffold morphology
The fibrous scaffolds used for this study were taken from electrospun mats with an average fiber diameter of 8.5 μm with a maximum standard deviation of 1.2 μm (Fig. 1). Before utilizing scaffolds from separate electrospun mats, it was first determined that the average fiber diameters for the different mats were not statistically different (p>0.05).
FIG. 1.
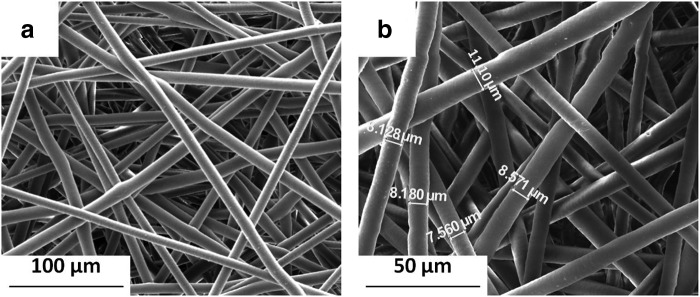
Scanning electromicrograph images of acellular electrospun poly(ɛ-caprolactone) microfibrous scaffolds at magnifications (a) 500× and (b) 1000× with measurements used to characterize average fiber diameter.
ECM morphology
For scaffolds seeded initially at a density of 35,000 cells/scaffold, SEM images show that chondrocyte containing cultures developed a dense coating of cells and ECM over the majority of the seeding surface after just 7 days of culture (Fig. 2a–l). In contrast, when MSCs alone were seeded on scaffolds, it took between 14 and 21 days to completely coat the upper surface of the scaffold with cells and ECM (Fig. 2n, o). Scaffolds seeded with half chondrocytes or more, groups 1:0 and 1:1, achieved a surface coating, within 21 days of culture, so dense that it was difficult to distinguish the underlying fibers (Fig. 2c, f).
FIG. 2.

Scanning electromicrograph images depicting the temporal progression of construct surface morphology for scaffolds seeded with 35,000 cells initially. Images depict constructs produced by culturing the following ratios of chondrocytes to mesenchymal stem cells: (a–c) 1:0, (d–f ) 1:1, (g–i) 1:3, (j–l) 1:5, and (m–o) 0:1 for (a, d, g, j, m) 7, (b, e, h, k, n) 14, and (c, f, i, l, o) 21 days. 1000× magnification. Scale bar in (a) indicates 50 μm and applies to all images.
The surface of all scaffolds seeded initially with 70,000 cells/scaffold, regardless of the culture ratio became occluded at earlier time points than the corresponding groups at the lower initial seeding density. For all five culture ratios seeded with 70,000 cells, the scaffold surface was completely covered with cells and ECM by day 14 if not day 7 (Appendix Fig. A1; Appendix is available at end of article). By day 14, one time point earlier than for the lower seeding density, the uppermost fibers of the scaffold were difficult to observe for groups 1:0 and 1:1 (Appendix Fig. A1b, e). Even at higher seeding densities, the surface of scaffolds cultured with MSCs alone for up to 21 days did not display coatings as dense as those cultured with chondrocytes as indicated by the visibility of PCL fibers through the cell and ECM surface coating (see e.g., Appendix Fig. A1f vs. 1o).
Cell and ECM distribution
Figure 3 and Appendix Fig. A2 depict sections from each group at each time point treated with Safranin O, which stains GAGs red. For both seeding densities, there were fewer GAGs deposited inside the scaffolds of MSC generated constructs than constructs generated with chondrocyte containing cultures (Fig. 3 and Appendix Fig. A2m–o vs. a–l). Throughout the entire 21 days of culture, 0:1 culture ratios only produced GAGs on the uppermost surface of the scaffolds (Fig. 3 and Appendix Fig. A2m–o). Conversely the culture ratios 1:0, 1:1, 1:3, and 1:5, which contained chondrocytes, exhibited GAGs distributed inside the scaffold in addition to at the surface (Fig. 3 and Appendix Fig. A2a–l). Further, especially for the higher seeding density shown in Appendix Figure A2, it appears as though the cocultures generated more widely distributed and denser GAG accumulation within the PCL mesh than the chondrocyte control samples (Appendix Fig. A2d–l compared to a–c). In addition to these differences based on the cell ratio, the GAG content in Figure 3 and Appendix Figure A2 also exhibited a time-dependent progression. Within the day 21 samples, Safranin O staining was the densest and most intense within the chondrocyte containing constructs of the 70,000 cells/scaffold groups. Conversely, for all of the culture ratios, there was minimal staining for GAGs at day 7 and by day 14, Safranin O staining became more pronounced in all of the samples.
FIG. 3.

Safranin O-stained histological sections of constructs cultured with all five culture ratios at 35,000 cells/scaffold initially for 7, 14, and 21 days. Images represent glycosaminoglycan distribution throughout constructs produced by culturing the following ratios of chondrocytes to mesenchymal stem cells: (a–c) 1:0, (d–f ) 1:1, (g–i) 1:3, (j–l) 1:5, and (m–o) 0:1 for (a, d, g, j, m) 7, (b, e, h, k, n) 14, and (c, f, i, l, o) 21 days. The seeded surface of the scaffold is shown at the top of the images. 10× magnification. Scale bar in (a) indicates 100 μm and applies to all images.
Figure 4 and Appendix Figure A3 depict cross sections of representative samples from each group at each time point treated with Picrosirius Red, which stains collagen a red color. Over 21 days of culture, there was minimal collagen distributed within constructs cultured with MSCs alone for both seeding densities and any staining was primarily located at the surface of the scaffold (Fig. 4 and Appendix Fig. A3o). In the chondrocyte containing constructs, there was fairly consistent staining for collagen within the interior of the scaffold as well as at the seeding surface for both seeding densities (Fig. 4 and Appendix Fig. A3c, f, i, and l). Further, for both the high and low seeding densities (Appendix Fig. A3 and Fig. 4, respectively), Picrosirius Red staining showed a timewise deposition of collagen within the scaffolds cultured with chondrocytes and chondrocyte containing cocultures (Fig. 4 and Appendix Fig. A3a–l). For all of the samples, there was very little staining for collagen at day 7 with most of the collagen isolated near the surface of the construct. Overall, there did not appear to be a marked difference in Picrosirius Red staining between the two different seeding densities, with the exception of the 1:5 ratio constructs. The intensity of day 21 Picrosirius Red staining showed a dose-dependent trend relative to the amount of chondrocytes, which was more noticeable for the lower seeding density (Fig. 4). Within the lower seeding density, the MSC-only (0:1) group had the least intense red staining on day 21 (Fig. 4o), followed by the 1:5 group (Fig. 4l), and so on, with the 1:0 group (Fig. 4c), which had the highest concentration of chondrocytes, exhibiting the deepest staining. This was also observed within the constructs initially seeded with 70,000 cells/scaffold (Appendix Fig. A3).
FIG. 4.

Picrosirius Red-stained histological sections of constructs cultured with all five culture ratios at 35,000 cells/scaffold initially for 7, 14, and 21 days. Images depict collagen distribution on constructs produced by culturing the following ratios of chondrocytes to mesenchymal stem cells: (a–c) 1:0, (d–f ) 1:1, (g–i) 1:3, (j–l) 1:5, and (m–o) 0:1 for (a, d, g, j, m) 7, (b, e, h, k, n) 14, and (c, f, i, l, o) 21 days. The seeded surface of the scaffold is shown at the top of the images. 10× magnification. Scale bar in (a) depicts 100 μm and applies to all images.
Figure 5 and Appendix Figure A4 depict representative cross sections of constructs from each culture ratio at each time point treated with nuclear fast red, which stains cell nuclei red. As was observed with staining for the ECM components GAG and collagen, nuclear fast red staining, which highlights cell localization, showed that construct cellularity mirrored the distribution of the ECM components. For example, in 0:1 culture ratio generated constructs, cells did not significantly infiltrate the interior of the PCL scaffolds (Fig. 5 and Appendix Fig. A4m–o). The four chondrocyte containing groups exhibited substantial cellular infiltration within 200–500 μm depth of the scaffolds. Further, there were minimal differences in cellular localization among the four chondrocyte containing culture ratios (Fig. 5 and Appendix Fig. A4a–l). There appeared to be little difference between the cell localization of the scaffolds for the two different seeding densities. Further, when examining the time progression of cell distribution for each group, no significant improvement was seen from day 14 to 21.
FIG. 5.

Nuclear fast red-stained histological sections of constructs cultured with all five culture ratios at 35,000 cells/scaffold initially for 7, 14, and 21 days. Images depict cellular distribution on constructs produced by culturing the following ratios of chondrocytes to mesenchymal stem cells: (a–c) 1:0, (d–f ) 1:1, (g–i) 1:3, (j–l) 1:5, and (m–o) 0:1 for (a, d, g, j, m) 7, (b, e, h, k, n) 14, and (c, f, i, l, o) 21 days. The seeded surface of the scaffold is shown at the top of the images. 10× magnification. Scale bar in (a) depicts 100 μm and applies to all images.
Cell, GAG, and collagen content
Figure 6 depicts the DNA content of the constructs at each time point. There was no significant difference noticed in the DNA content among the day 0 samples, taken after 2 h of attachment, even between the two different seeding densities. Further, seeding density showed a minimal effect on cellularity at later time points despite a twofold increase in the initial cell number from the lower seeding density to the higher density. The four instances in which seeding density was observed to elicit a significant change occurred in 1:0 at the intermediate time point and in the 1:0, 1:1, and 0:1 groups at the final time point (Fig. 6 “+”).
FIG. 6.

DNA content of scaffolds seeded with five chondrocyte to mesenchymal stem cell (MSC) ratios (1:0, 1:1, 1:3, 1:5, and 0:1) at either 35,000 cells/scaffold (“35K”) or 70,000 cells/scaffold (“70K”) cultured for 7, 14, and 21 days. DNA content is represented as the mean±standard deviation (n=4). Statistical significance is indicated using markers defined in Table 1 (p<0.05).
Table 1.
Key to Graphical Markers Denoting Statistical Significance in Figures 6–8
| Symbol | Meaning |
|---|---|
| ‡ | Statistically significant difference from group 1:0 for this particular density and culture duration (p<0.05). |
| * | Statistically significant difference from group 0:1 for this particular density and culture duration (p<0.05). |
| + | Statistically significant difference (p<0.05) from the corresponding group seeded at the higher density, at this particular culture duration. Significance is indicated above the group with the lower seeding density only. |
| X | Statistically significant difference (p<0.05) from day 0 value for this particular culture ratio and seeding density. Marked at earliest possible time point if later groups are also significantly different from day 0. |
| # | Statistically significant difference (p<0.05) between different coculture ratios within a particular seeding density and culture duration. |
An increase in cellularity over time as determined by DNA content was observed for all five culture ratios at both seeding densities. Scaffolds initially seeded with 35,000 cells/scaffold (“35K” in Fig. 6) showed a greater rate of cell proliferation from day 0 to 7 than the corresponding scaffolds seeded at the higher cell density (“70K” in Fig. 6). This faster rate of proliferation for the lower seeding density was evidenced by the larger number of groups that achieved statistically significant increases in DNA content by day 7 (Fig. 6 “x”). Scaffolds containing chondrocytes (groups 1:0, 1:1, 1:3, and 1:5) had faster cell proliferation than scaffolds cultured with MSCs alone (group 0:1, Fig. 6). By 14 days of culture, all four chondrocyte containing groups at the higher seeding density had significantly higher DNA content than scaffolds cultured only with MSCs, and this difference persisted at day 21 (Fig. 6 “*”). In contrast, at the lower seeding density, only the 1:3 coculture group yielded more DNA than the MSC-only control (0:1 ratio) at both days 14 and 21. In addition, differences in cell content of the cocultures compared to the 1:0 chondrocyte control were only observed for the lower density (“35K”) (Fig. 6 “‡”). This was only observed at time points after day 7. No significant differences in cellularity were observed among the three coculture groups, 1:1, 1:3, and 1:5, at either initial seeding density over the 21-day culture period.
Figure 7 depicts the average GAG content of the scaffolds in each group at each time point. As with cellularity, significant increases in GAG content as compared to day 0 samples appeared to occur sooner for scaffolds cultured with 35,000 cells/scaffold rather than 70,000 cells/scaffold (Fig. 7 “x”). At the lower seeding density, 7–14 days of culture were sufficient for all of the groups to produce significantly more GAGs than day 0 samples. However, most groups with 70K seeding density required 14–21 days of culture to exceed the initial baseline GAG content, despite having more cells total available to produce GAGs than lower seeding density counterparts. Aside from this temporal difference in the GAG production between the two seeding densities, the seeding density had little effect on GAG production when comparing culture ratios at a specific time point. The only exception was the 0:1 MSC control group at day 21, where the lower seeding density led to a higher GAG content (Fig. 7 “+”).
FIG. 7.

Glycosaminoglycan (GAG) content of scaffolds seeded with five chondrocyte to MSC ratios (1:0, 1:1, 1:3, 1:5, and 0:1) at 35,000 cells/scaffold (“35K”) or 70,000 cells/scaffold (“70K”) cultured for 7, 14, and 21 days. GAG content is represented as the mean±standard deviation (n=4). Statistical significance is indicated using markers defined in Table 1 (p<0.05).
Although on day 7, only the 1:0 chondrocyte control with the higher 70K seeding density had significantly more GAG content than the 0:1 MSC control, by 14 days of culture, all four chondrocyte containing groups generated significantly more GAGs than the MSC controls regardless of seeding density (Fig. 7 “*”). Apart from the MSC control samples, almost none of the coculture generated constructs produced significantly fewer GAGs than the chondrocyte controls, with the only exceptions being the 1:3 and 1:5 70K groups at day 14 (Fig. 7 “‡”). This difference was eliminated by day 21. Among the coculture groups, there was a significant difference in GAG deposition only at day 14 (Fig. 7 “#”). For both seeding densities, the 1:1 coculture group deposited significantly more GAGs within the PCL scaffold than the 1:5 coculture group. For the 35K seeding density, the difference between the 1:1 and 1:3 coculture groups at day 14 was also significant.
Figure 8 shows the average collagen content of the constructs at each time point. Note that the baseline day 0 values are not shown, unlike Figures 6 and 7, as the values were anticipated to be below the threshold of the assay. For both seeding densities, the 1:0 and 1:1 groups deposited significantly higher amounts of collagen than all other groups (Fig. 8 “‡” and “#,” respectively), and showed a significantly increasing collagen content throughout the entire culture duration. For both seeding densities, the 1:0 chondrocyte control group had a higher collagen content than any other group at all time points, although for the 35K seeding density, this effect was only significant from day 14 onward (Fig. 8 “‡”). Of note, at day 21, for the lower seeding density, the 1:1 coculture group achieved substantial collagen content such that it did not differ significantly from the 1:0 chondrocyte control group. The only significant effect of seeding density was observed in the 1:0 group at day 14, where the 70K seeding density resulted in a significantly higher collagen content (Fig. 8 “+”).
FIG. 8.

Collagen content per scaffold for poly(ɛ-caprolactone) scaffolds seeded with five chondrocyte to MSC ratios (1:0, 1:1, 1:3, 1:5, and 0:1) at 35,000 cells/scaffold (“35K”) or 70,000 cells/scaffold (“70K”) cultured for 7, 14, and 21 days. The collagen content is depicted as 10× the measured hydroxyproline content per scaffold. The collagen content for group 0:1 was measured at each time point, but was below the threshold of the assay. Likewise, the collagen content for day 7 groups 1:3 35K and 70K as well as 1:5 35K were below the threshold of the hydroxyproline assay. Values shown are represented as mean±standard deviation (n=4). Statistical significance is denoted using the symbols defined in Table 1 (p<0.05).
Throughout the entire culture duration at both seeding densities, MSCs cultured alone on PCL scaffolds produced less collagen than the minimum threshold of the hydroxyproline assay used to determine the scaffold collagen content. For this reason, group 0:1 does not register in Figure 8. Collagen deposition levels below the assay threshold were also observed at 7 days of culture in coculture groups 1:3 and 1:5. As with cellularity and GAG production (Figs. 6 and 7), the collagen content of the 1:3 and 1:5 coculture groups at a given seeding density did not significantly differ at any time between seeding and 21 days of culture (Fig. 8).
Discussion
This study demonstrated that a 1:1 ratio of chondrocytes to MSCs, seeded at 35,000 cells/scaffold, is optimal for the production of dense and well-distributed cartilage-like ECM within PCL scaffolds while minimizing the required number of chondrocytes. Previous efforts to investigate the utilization of cocultures containing chondrocytes and MSCs have primarily focused on studying the differentiation state of either cell type as opposed to focusing on the development of cartilage-like ECM within a scaffold.45–47 The purpose of this study was to investigate and optimize the use of different coculture ratios of chondrocytes and MSCs in an effort to produce PCL/ECM constructs containing cartilage-like ECM, while reducing the total number of chondrocytes necessary to do so. Further, the influence of seeding density was also examined as it was hypothesized that a higher cell density would yield an amplification of matrix production due to increased cell–cell contacts as well as the availability of more cells in the scaffold to generate the ECM.
Various chondrogenic coculture studies have been previously performed in either micromass cultures or encapsulated within hydrogels.46,48,49 In the case of micromasses, the frequency of cell–cell interactions is increased because the cell density is greatly exaggerated, approximating that of cartilage within the condensation stage of development.50 Whereas micromasses are useful for studying basic cell interactions and tissue development, they are impractical for tissue engineering applications due to the large cell numbers required to achieve an implantable mass of appreciable dimensions. Alternatively, hydrogels provide a favorable environment for studying cartilage development. This is due to the round shaped cells that often take upon gel encapsulation, which has been shown to be beneficial for the chondrogenic phenotype.51 However, when studying the influences of cocultures on matrix production, hydrogels may potentially restrict the dispersion of cells and secreted factors and thus alter the effects of coculture.52 For this reason, this study set forth to examine the interaction of chondrocytes and MSCs in a highly porous, fibrous scaffold focusing on the production of the ECM within the scaffold. The ultimate goal was to produce a cell-derived hybrid scaffold containing the biological signals necessary to direct cartilage regeneration upon implantation.
In general, there was a temporal increase in cellularity and ECM production for all five culture ratios and for both seeding densities throughout the study. As a plateau in ECM production was not observed, it might have been possible to produce more ECM within the scaffolds if the samples were cultured longer. However, increased in vitro culture duration carries an increased risk that the cells may become hypertrophic and produce primarily collagen types I and X.32,49,53 Previous results showed that in 2 weeks of serum-free culture supplemented with transforming growth factor-β3, there were minimal changes in the expression of collagen type X within three-dimensional cultures of chondrocytes, MSCs, as well as 30:70 cocultures of chondrocytes and MSCs.33 As the constructs examined here were being produced without growth factor supplementation to contain cartilage-like ECM to direct articular cartilage regeneration in situ, hypertrophic ECM would be undesirable, and thus, further increases in construct culture duration should be carefully considered.
Besides examining the potential use of coculture ratios of chondrocytes to MSCs for producing cartilage-like matrix within a three-dimensional scaffold, this study also aimed to investigate the influence of initial seeding density on the ultimate ECM content of the constructs. For this study, the lower seeding density was scaled by the scaffold surface area from the seeding density used previously to produce chondrocyte perfusion culture generated PCL/ECM scaffolds.17 The higher seeding density, double that of the previously utilized seeding density, was used in an effort to examine the potential effects of increased cell density on matrix production. Initial seeding density had the most profound effect on the MSC and chondrocyte (0:1 and 1:0) controls, primarily concerning DNA content (Fig. 6 “+”). Interestingly, when significant, the higher seeding density displayed a higher cellularity for group 1:0, but a lower cellularity for group 0:1 at extended culture durations. The only coculture group that displayed a significant difference with respect to seeding density was the 1:1 group at day 21, in which the DNA content was significantly higher for the 70K seeding density with no corresponding significant differences observed in the ECM content. Conversely, seeding density displayed much less of an effect on the ECM content as determined by GAG and collagen contents. Significant differences in the ECM content across the two different seeding densities were only observed for the GAG content of group 0:1 day 21 and the collagen content of group 1:0 day 14. None of the coculture groups showed a significant change in the ECM content due to the initial seeding density.
The lack of a biochemical response to the initial seeding density was possibly due to limitations in cell attachment due to scaffold surface area availability as evidenced by little difference in day 0 DNA contents across the two seeding densities.54 It is possible that the cell attachment achieved here was not high enough to produce cell densities similar to those achieved in micromass cultures, thus limiting the potential benefits of a high seeding density. However, the similarities observed among the day 0 samples may be an artifact of the number of cells that attached to the scaffold in 2 h. It is possible that more cells attached to the scaffolds after the 2 h preattachment period ultimately resulting in moderately different cell content following the complete 24 h attachment period.
The ECM distributions observed through histological staining suggest that there was a slight difference between the different seeding densities especially by day 21. In the Safranin O-stained sections (Fig. 3 and Appendix Fig. A2), the 70K samples containing chondrocytes showed more intense staining at the surface and throughout than scaffolds seeded with the lower seeding density. Since the ultimate goal was to produce a polymer/ECM hybrid construct for implantation to direct cartilage regeneration, the lack of an appreciable advantage of seeding scaffolds with twice as many cells supports the conclusion that the more conservative, lower seeding density, was sufficient for producing these hybrid scaffolds.
In most cases, the chondrocyte control samples produced more ECM than the MSC controls, confirming the original hypothesis that chondrocytes would prove to be more successful at generating ECM than undifferentiated MSCs. The only time point at which the chondrocyte controls did not generate significantly more collagen and GAGs than the MSC cultured constructs was day 7 for the lower seeding density. This indicates that chondrocytes secrete more ECM components than MSCs regardless of the initial seeding density.
The implication that chondrocytes produce more ECM than MSCs is further supported by the histological images indicating more intense staining for GAG and collagen deposits within the four chondrocyte containing samples than in MSC controls. One possible reason that the four chondrocyte containing constructs exhibited better cellular infiltration and distribution of matrices than the MSC generated constructs is that chondrocytes are smaller than MSCs; 10–15 μm in diameter compared to 20–30 μm.55–57 Thus, it is probable that the chondrocytes penetrated the scaffold through the interconnected pores more readily than the MSCs, which remained primarily trapped at the surface of the scaffold.
With respect to the total ECM content as well as spatial distribution, chondrocyte containing cultures, including the 1:0 ratio chondrocyte controls and the three coculture groups, resulted in more cartilage-like characteristics than constructs produced with MSCs alone. Based upon the 1:0 and 0:1 controls, it is possible that most of the ECM in the coculture constructs was produced by the chondrocytes, while much less matrix was deposited by the MSCs. This is consistent with the findings from previous micromass investigations, which indicated that upon coculture, articular chondrocytes were responsible for matrix production as opposed to MSCs in cocultures of adult human bone marrow MSCs with articular chondrocytes from both human and bovine sources.46,48,58
Among the coculture constructs, a pronounced difference in the cellularity or ECM content was never observed between the 1:3 and 1:5 coculture groups, regardless of culture duration or initial seeding density. As the original objective was to produce a construct laden with cartilage-like ECM, while reducing the number of chondrocytes necessary to do so, these results suggest that ultimately, constructs with 1:5 coculture ratio, and thus, fewer chondrocytes might result in a similar ability to direct cartilage repair as constructs generated with 1:3 cocultures.
In contrast, the coculture constructs with the highest percentage of chondrocytes, specifically 1:1, produced more ECM than the other two coculture groups while DNA contents remained similar for all three groups. The improved ECM production by the 1:1 cocultures over the other two coculture groups was observed at both seeding densities for collagen content at days 14 and 21 as well as for GAG content at day 14. It is hypothesized that a greater amount of ECM deposited within the polymer scaffold would result in a scaffold more capable of directing tissue repair upon implantation since the cell-generated ECM is the proposed bioactive signal for guiding chondrogenesis. This suggests that 1:1 cocultures of chondrocytes to MSCs may be more successful at generating polymer/ECM capable of aiding cartilage repair than cocultures with lower concentrations of chondrocytes.
Maintaining the constructs produced using only chondrocytes as the benchmark to achieve it is important to note the instances that approximate or surpass that standard. Looking at both the GAG and collagen content as quantified by the biochemical assays, there was no significant difference between the 1:1 day 21 lower seeding density group and the chondrocyte generated controls. This approximation was also observed within Safranin O- and Picrosirius Red-stained histological sections as well as in SEM images. This finding further supports the hypothesis that cocultures, and specifically the 35K 1:1 group, may be the solution for providing sufficient ECM deposition within a scaffold, while reducing the number of chondrocytes needed. In fact, previous efforts suggest that in cocultures, MSCs elicit a stimulatory trophic effect on chondrocytes, which leads to the observed improved chondrogenic phenotype as opposed to MSC differentiation.32,46 Possible mechanisms for this communication include paracrine signaling through secreted factors, as well as direct cell–cell contacts. To select the truly optimal culture ratio of MSCs to chondrocytes for the purpose of producing PCL/ECM scaffolds for cartilage regeneration, the effectiveness of the matrix produced must be analyzed for its potential to direct chondrogenesis. An analysis of the chondroinductive potential of this coculture generated ECM will be the subject of Part 2 of these studies.59
Conclusions
Composite constructs composed of an electrospun polymeric fibrous scaffold coated with cartilage-like ECM were successfully generated using cocultures of chondrocytes and MSCs. The goal of this study was to determine the optimal coculture ratio that maximized cartilage-like ECM production, while minimizing the required number of chondrocytes. ECM production by all coculture groups significantly surpassed that observed in MSC-only controls. Compared to chondrocyte-only controls, all coculture groups achieved similar GAG quantities. However, increasing concentrations of chondrocytes resulted in increased collagen contents within the scaffold, with a 1:1 chondrocyte-to-MSC ratio approximating the collagen production of chondrocytes alone. Histological staining demonstrated that cell and ECM distribution within coculture constructs approximated the well-distributed patterns observed within chondrocyte generated constructs, and differed substantially from the surface-limited cell and matrix deposition observed in MSC-only constructs. These findings highlight the potential of chondrocyte–MSC cocultures as a promising method for producing composite polymer/ECM constructs, while minimizing the number of chondrocytes required so to do.
Appendix
Appendix FIG. A1.

Scanning electromicrograph images depicting the temporal progression of construct surface morphology for scaffolds seeded with 70,000 cells initially. Images depict constructs produced by culturing the following ratios of chondrocytes to mesenchymal stem cells: (a–c) 1:0, (d–f ) 1:1, (g–i) 1:3, (j–l) 1:5, and (m–o) 0:1 for (a, d, g, j, m) 7, (b, e, h, k, n) 14, and (c, f, i, l, o) 21 days. 1000× magnification. Scale bar in (a) indicates 50 μm and applies to all images.
Appendix FIG. A2.

Safranin O-stained histological sections of constructs cultured with all five culture ratios at 70,000 cells/scaffold initially for 7, 14, and 21 days. Images depict glycosaminoglycan distribution throughout constructs produced by culturing the following ratios of chondrocytes to mesenchymal stem cells: (a–c) 1:0, (d–f ) 1:1, (g–i) 1:3, (j–l) 1:5, and (m–o) 0:1 for (a, d, g, j, m) 7, (b, e, h, k, n) 14, and (c, f, i, l, o) 21 days. The seeded surface of the scaffold is shown at the top of the images. 10× magnification. Scale bar in (a) indicates 100 μm and applies to all images.
Appendix FIG. A3.

Picrosirius Red-stained histological sections of constructs cultured with all five culture ratios at 70,000 cells/scaffold initially for 7, 14, and 21 days. Images depict collagen distribution on constructs produced by culturing the following ratios of chondrocytes to mesenchymal stem cells: (a–c) 1:0, (d–f ) 1:1, (g–i) 1:3, (j–l) 1:5, and (m–o) 0:1 for (a, d, g, j, m) 7, (b, e, h, k, n) 14, and (c, f, i, l, o) 21 days. The seeded surface of the scaffold is shown at the top of the images. 10× magnification. Scale bar in (a) indicates 100 μm and applies to all images.
Appendix FIG. A4.

Nuclear fast red-stained histological sections of constructs cultured with all five culture ratios at 70,000 cells/scaffold initially for 7, 14, and 21 days. Images depict cellular distribution on constructs produced by culturing the following ratios of chondrocytes to mesenchymal stem cells: (a–c) 1:0, (d–f ) 1:1, (g–i) 1:3, (j–l) 1:5, and (m–o) 0:1 for (a, d, g, j, m) 7, (b, e, h, k, n) 14, and (c, f, i, l, o) 21 days. The seeded surface of the scaffold is shown at the top of the images. 10× magnification. Scale bar in (a) depicts 100 μm and applies to all images.
Acknowledgment
This work was supported by funding from the National Institutes of Health (R01AR57083).
Disclosure Statement
No competing financial interests exist.
References
- 1.Murphy C.M., Matsiko A., Haugh M.G., Gleeson J.P., and O'Brien F.J.Mesenchymal stem cell fate is regulated by the composition and mechanical properties of collagen-glycosaminoglycan scaffolds. J Mech Behav Biomed Mater 11,53, 2012 [DOI] [PubMed] [Google Scholar]
- 2.Erickson I.E., Huang A.H., Chung C., Li R.T., Burdick J.A., and Mauck R.L.Differential maturation and structure function relationships in mesenchymal stem cell- and chondrocyte-seeded hydrogels. Tissue Eng A 15,1041, 2009 [DOI] [PMC free article] [PubMed] [Google Scholar]
- 3.Schulz R.M., Zscharnack M., Hanisch I., Geiling M., Hepp P., and Bader A.Cartilage tissue engineering by collagen matrix associated bone marrow derived mesenchymal stem cells. Biomed Mater Eng 18,55, 2008 [PubMed] [Google Scholar]
- 4.Tan H., Chu C.R., Payne K.A., and Marra K.G.Injectable in situ forming biodegradable chitosan-hyaluronic acid based hydrogels for cartilage tissue engineering. Biomaterials 30,2499, 2009 [DOI] [PMC free article] [PubMed] [Google Scholar]
- 5.Zscharnack M., Poesel C., Galle J., and Bader A.Low oxygen expansion improves subsequent chondrogenesis of ovine bone-marrow-derived mesenchymal stem cells in collagen type I hydrogel. Cells Tissues Organs 190,81, 2009 [DOI] [PubMed] [Google Scholar]
- 6.Francioli S.E., Candrian C., Martin K., Heberer M., Martin I., and Barbero A.Effect of three-dimensional expansion and cell seeding density on the cartilage-forming capacity of human articular chondrocytes in type II collagen sponges. J Biomed Mater Res A 95A,924, 2010 [DOI] [PubMed] [Google Scholar]
- 7.Ko C.-S., Huang J.-P., Huang C.-W., and Chu I.M.Type II collagen-chondroitin sulfate-hyaluronan scaffold cross-linked by genipin for cartilage tissue engineering. J Biosci Bioeng 107,177, 2009 [DOI] [PubMed] [Google Scholar]
- 8.Duan Y., Wang Z., Yan W., Wang S., Zhang S., and Jia J.Preparation of collagen-coated electrospun nanofibers by remote plasma treatment and their biological properties. J Biomater Sci Polym Ed 18,1153, 2007 [DOI] [PubMed] [Google Scholar]
- 9.Solchaga L.A., Gao J., Dennis J.E., Awadallah A., Lundberg M., Caplan A.I., and Goldberg V.M.Treatment of osteochondral defects with autologous bone marrow in a hyaluronan-based delivery vehicle. Tissue Eng 8,333, 2002 [DOI] [PubMed] [Google Scholar]
- 10.Sun W., Tiemessen D.M., Sloff M., Lammers R.J., Mulder E.L.wd., Hilborn J., Gupta B., Feitz W.F.J., Daamen W.F., Kuppevelt T.Hv., Geutjes P.J., and Oosterwijk E.Improving the cell distribution in collagen-coated poly-caprolactone knittings. Tissue Eng C: Methods 18,731, 2012 [DOI] [PMC free article] [PubMed] [Google Scholar]
- 11.Benders K.E.M., Weeren P.Rv., Badylak S.F., Saris D.B.F., Dhert W.J.A., and Malda J.Extracellular matrix scaffolds for cartilage and bone regeneration. Trends Biotechnol 31,169, 2013 [DOI] [PubMed] [Google Scholar]
- 12.Yang Z., Shi Y., Wei X., He J., Yang S., Dickson G., Tang J., Xiang J., Song C., and Li G.Fabrication and repair of cartilage defects with a novel acellular cartilage matrix scaffold. Tissue Eng C: Methods 16,865, 2010 [DOI] [PubMed] [Google Scholar]
- 13.Srinivasan S., Jayakumar R., Chennazhi K.P., Levorson E.J., Mikos A.G., and Nair S.V.Multiscale fibrous scaffolds in regenerative medicine. Adv Polym Sci 246,1, 2012 [Google Scholar]
- 14.Thibault R.A., Mikos A.G., and Kasper F.K.Protein and mineral composition of osteogenic extracellular matrix constructs generated with a flow perfusion bioreactor. Biomacromolecules 12,4204, 2011 [DOI] [PMC free article] [PubMed] [Google Scholar]
- 15.Gomes M.E., Bossano C.M., Johnston C.M., Reis R.L., and Mikos A.G.In vitro localization of bone growth factors in constructs of biodegradable scaffolds seeded with marrow stromal cells and cultured in a flow perfusion bioreactor. Tissue Eng 12,177, 2006 [DOI] [PubMed] [Google Scholar]
- 16.Levorson E.J., Kasper F.K., and Mikos A.G.Scaffolds–flow perfusion bioreactor design. In: Ducheyne P., Healy K.E., Hutmacher D.W., and Kirkpatrick C.J., eds. Comprehensive Biomaterials. Oxford: Elsevier, 2011, pp. 1 [Google Scholar]
- 17.Liao J., Guo X., Grande-Allen K.J., Kasper F.K., and Mikos A.G.Bioactive polymer/extracellular matrix scaffolds fabricated with a flow perfusion bioreactor for cartilage tissue engineering. Biomaterials 31,8911, 2010 [DOI] [PMC free article] [PubMed] [Google Scholar]
- 18.Nejadnik H., Hui J.H., Feng Choong E.P., Tai B.-C., and Lee E.H.Autologous bone marrow derived mesenchymal stem cells versus autologous chondrocyte implantation: an observational cohort study. Am J Sports Med 38,1110, 2010 [DOI] [PubMed] [Google Scholar]
- 19.Brittberg M., Peterson L., Sjogren-Jansson E., Tallheden T., and Lindahl A.Articular cartilage: engineering with autologous chondrocyte transplantation. J Bone Joint Surg 85,109, 2003 [DOI] [PubMed] [Google Scholar]
- 20.Hoemann C.D.Molecular and biochemical assays of cartilage components. Methods Mol Med 101,127, 2004 [DOI] [PubMed] [Google Scholar]
- 21.Dell'Accio F., Cosimo De B., and Luyten F.P.Molecular markers predictive of the capacity of expanded human articular chondrocytes to form stable cartilage in vivo. Arthritis Rheum 44,1608, 2001 [DOI] [PubMed] [Google Scholar]
- 22.Darling E.M., Pritchett P.E., Evans B.A., Superfine R., Zauscher S., and Guilak F.Mechanical properties and gene expression of chondrocytes on micropatterned substrates following dedifferentiation in monolayer. Cell Mol Bioeng 2,395, 2009 [DOI] [PMC free article] [PubMed] [Google Scholar]
- 23.Cournil-Henrionnet C., Huselstein C., Wang Y., Galois L., Mainard D., Decot V., Netter P., Stoltz J.-F., Muller S., Gillet P., and Watrin-Pinzano A.Phenotypic analysis of cell surface markers and gene expression of human mesenchymal stem cells and chondrocytes during monolayer expansion. Biorheology 45,513, 2008 [PubMed] [Google Scholar]
- 24.Matricali G.A., Dereymaeker G.P.E., and Luyten F.P.Donor site morbidity after articular cartilage repair procedures: a review. Acta Orthop Belg 76,669, 2010 [PubMed] [Google Scholar]
- 25.Filardo G., Madry H., Jelic M., Roffi A., Cucchiarini M., and Kon E.Mesenchymal stem cells for the treatment of cartilage lesions: from preclinical findings to clinical application in orthopaedics. Knee Surg Sports Traumatol Arthros 1, 21,1717, 2013 [DOI] [PubMed] [Google Scholar]
- 26.Cavallo C., Cuomo C., Fantini S., Ricci F., Tazzari P.L., Lucarelli E., Donati D., Facchini A., Lisignoli G., Fornasari P.M., Grigolo B., and Moroni L.Comparison of alternative mesenchymal stem cell sources for cell banking and musculoskeletal advanced therapies. J Cell Biochem 112,1418, 2011 [DOI] [PubMed] [Google Scholar]
- 27.Mauck R.L., Yuan X., and Tuan R.S.Chondrogenic differentiation and functional maturation of bovine mesenchymal stem cells in long-term agarose culture. Osteoarthritis Cartilage 14,179, 2006 [DOI] [PubMed] [Google Scholar]
- 28.Hendriks J., Riesle J., and van Blitterswijk C.A.Co-culture in cartilage tissue engineering. J Tissue Eng Regen Med 1,170, 2007 [DOI] [PubMed] [Google Scholar]
- 29.Hwang N.S., Varghese S., Puleo C., Zhang Z., and Elisseeff J.Morphogenetic signals from chondrocytes promote chondrogenic and osteogenic differentiation of mesenchymal stem cells. J Cell Physiol 212,281, 2007 [DOI] [PubMed] [Google Scholar]
- 30.Chen W.-H., Lai M.-T., Wu A.T.H., Wu C.-C., Gelovani J.G., Lin C.-T., Hung S.-C., Chiu W.-T., and Deng W.-P.In vitro stage-specific chondrogenesis of mesenchymal stem cells committed to chondrocytes. Arthritis Rheum 60,450, 2009 [DOI] [PubMed] [Google Scholar]
- 31.Saini S., and Wick T.M.Concentric cylinder bioreactor for production of tissue engineered cartilage: effect of seeding density and hydrodynamic loading on construct development. Biotechnol Prog 19,510, 2003 [DOI] [PubMed] [Google Scholar]
- 32.Meretoja V.V., Dahlin R.L., Kasper F.K., and Mikos A.G.Enhanced chondrogenesis in co-cultures with articular chondrocytes and mesenchymal stem cells. Biomaterials 33,6362, 2012 [DOI] [PMC free article] [PubMed] [Google Scholar]
- 33.Meretoja V.V., Dahlin R.L., Wright S., Kasper F.K., and Mikos A.G.The effect of hypoxia on the chondrogenic differentiation of co-cultured articular chondrocytes and mesenchymal stem cells in scaffolds. Biomaterials 34,4266, 2013 [DOI] [PMC free article] [PubMed] [Google Scholar]
- 34.Edouard P., Rannou Fo, and Coudeyre E.Animal evidence for hyaluronic acid efficacy in knee trauma injuries: review of animal-model studies. Phys Ther Sport 14,3158, 2013 [DOI] [PubMed] [Google Scholar]
- 35.Huey D., Sanchez-Adams J., Willard V., and Athanasiou K.Immunogenicity of bovine and leporine articular chondrocytes and meniscus cells. Tissue Eng A 18,568, 2012 [DOI] [PMC free article] [PubMed] [Google Scholar]
- 36.Holland T.A., Bodde E.W.H., Baggett L.S., Tabata Y., Mikos A.G., and Jansen J.A.Osteochondral repair in the rabbit model utilizing bilayered, degradable oligo(poly(ethylene glycol) fumarate) hydrogel scaffolds. J Biomed Mater Res A 75A,156, 2005 [DOI] [PubMed] [Google Scholar]
- 37.Guo X., Liao J., Park H., Saraf A., Raphael R.M., Tabata Y., Kasper F.K., and Mikos A.G.Effects of TGF-beta3 and preculture period of osteogenic cells on the chondrogenic differentiation of rabbit marrow mesenchymal stem cells encapsulated in a bilayered hydrogel composite. Acta Biomater 6,2920, 2010 [DOI] [PMC free article] [PubMed] [Google Scholar]
- 38.Park H., Temenoff J.S., Tabata Y., Caplan A.I., and Mikos A.G.Injectable biodegradable hydrogel composites for rabbit marrow mesenchymal stem cell and growth factor delivery for cartilage tissue engineering. Biomaterials 28,3217, 2007 [DOI] [PMC free article] [PubMed] [Google Scholar]
- 39.Awad H.A., Butler D.L., Boivin G.P., Smith F.N.L., Malaviya P., Huibregtse B., and Caplan A.I.Autologous mesenchymal stem cell-mediated repair of tendon. Tissue Eng 5,267, 1999 [DOI] [PubMed] [Google Scholar]
- 40.Huang C.Y.C., Paul M.R., and Herman S.C.Temporal expression patterns and corresponding protein inductions of early responsive genes in rabbit bone marrow-derived mesenchymal stem cells under cyclic compressive loading. Stem Cells 23,1113, 2005 [DOI] [PubMed] [Google Scholar]
- 41.Dahlin R.L., Meretoja V.V., Ni M., Kasper F.K., and Mikos A.G.Hypoxia and flow perfusion modulate proliferation and gene expression of articular chondrocytes on porous scaffolds. AIChE J 59,116, 2013 [Google Scholar]
- 42.Levorson E.J., Sreerekha P.R., Chennazhi K.P., Kasper F.K., Nair S.V., and Mikos A.G.Fabrication and characterization of multiscale electrospun scaffolds for cartilage regeneration. Biomed Mater 8,014103, 2013 [DOI] [PMC free article] [PubMed] [Google Scholar]
- 43.Datta N., Pham Q.P., Sharma U., Sikavitsas V.I., Jansen J.A., and Mikos A.G.In vitro generated extracellular matrix and fluid shear stress synergistically enhance 3D osteoblastic differentiation. PNAS 103,2488, 2006 [DOI] [PMC free article] [PubMed] [Google Scholar]
- 44.Stegemann H., and Stalder K.Determination of hydroxyproline. Clin Chim Acta 18,267, 1967 [DOI] [PubMed] [Google Scholar]
- 45.Yang Y.-H., Lee A.J., and Barabino G.A.Coculture-driven mesenchymal stem cell-differentiated articular chondrocyte-like cells support neocartilage development. Stem Cells Transl Med 1,843, 2012 [DOI] [PMC free article] [PubMed] [Google Scholar]
- 46.Wu L., Prins H.-J., Helder M.N., Blitterswijk C.Av., and Karperien M.Trophic effects of mesenchymal stem cells in chondrocyte co-cultures are independent of culture conditions and cell sources. Tissue Eng A 18,1542, 2012 [DOI] [PubMed] [Google Scholar]
- 47.Acharya C., Adesida A., Zajac P., Mumme M., Riesle J., Martin I., and Barbero A.Enhanced chondrocyte proliferation and mesenchymal stromal cells chondrogenesis in coculture pellets mediate improved cartilage formation. J Cell Physiol 227,88, 2011 [DOI] [PubMed] [Google Scholar]
- 48.Giovannini S., Diaz-Romero J., Aigner T., Heini P., Mainil-Varlet P., and Nesic D.Micromass co-culture of human articular chondrocytes and human bone marrow mesenchymal stem cells to investigate stable neocartilage tissue formation in vitro. Eur Cell Mater 20,245, 2010 [DOI] [PubMed] [Google Scholar]
- 49.Bian L., Zhai D.Y., Mauck R.L., and Burdick J.A.Coculture of human mesenchymal stem cells and articular chondrocytes reduces hypertrophy and enhances functional properties of engineered cartilage. Tissue Eng A 7,1137, 2011 [DOI] [PMC free article] [PubMed] [Google Scholar]
- 50.Johnstone B., Hering T.M., Caplan A.I., Goldberg V.M., and Yoo J.U.In vitro chondrogenesis of bone marrow-derived mesenchymal progenitor cells. Exp Cell Res 238,265, 1998 [DOI] [PubMed] [Google Scholar]
- 51.Gong Y., He L., Li J., Zhou Q., Ma Z., Gao C., and Shen J.Hydrogel-filled polylactide porous scaffolds for cartilage tissue engineering. J Biomed Mater Res B Appl Biomater 82B,192, 2007 [DOI] [PubMed] [Google Scholar]
- 52.Amsden B.Solute diffusion within hydrogels: mechanisms and models. Macromolecules 31,8382, 1998 [Google Scholar]
- 53.Fischer J., Dickhut A., Rickert M., and Richter W.Human articular chondrocytes secrete para thyroid hormone–related protein and inhibit hypertrophy of mesenchymal stem cells in coculture during chondrogenesis. Arthritis Rheum 62,2696, 2010 [DOI] [PubMed] [Google Scholar]
- 54.O'Brien F.J., Harley B.A., Yannas I.V., and Gibson L.J.The effect of pore size on cell adhesion in collagen-GAG scaffolds. Biomaterials 26,433, 2005 [DOI] [PubMed] [Google Scholar]
- 55.Hidaka C., Cheng C., Alexandre D., Bhargava M., and Torzilli P.Maturational differences in superficial and deep zone articular chondrocytes. Cell Tissue Res 323,127, 2006 [DOI] [PubMed] [Google Scholar]
- 56.Stockwell R.A.Chondrocyte structure. Biology of cartilage cells. Cambridge, UK: Cambridge University Press, 1979, pp. 7–31 [Google Scholar]
- 57.Wang N., Li Q., Zhang L., Lin H., Hu J., Li D., Shi S., Cui S., Zhou J., Ji J., Wan J., Cai G., and Chen X.Mesenchymal stem cells attenuate peritoneal injury through secretion of tsg-6. PLoS ONE 7,e43768, 2012 [DOI] [PMC free article] [PubMed] [Google Scholar]
- 58.Wu L., Leijten J.C.H., Georgi N., Post J.N., Blitterswijk C.Av., and Karperien M.Trophic effects of mesenchymal stem cells increase chondrocyte proliferation and matrix formation. Tissue Eng A 17,1425, 2011 [DOI] [PubMed] [Google Scholar]
- 59.Levorson E.J., Hu O., Mountziaris P.M., Kasper F.K., and Mikos A.G.Cell derived polymer/extracellular matrix composite scaffolds for cartilage regeneration. Part 2: Construct devitalization and determination of chondroinductive capacity. Tissue Eng C: Methods [submitted]. [DOI] [PMC free article] [PubMed] [Google Scholar]