Abstract
Recent X-ray structural work on the Drosophila epidermal growth factor receptor (EFGR) has suggested an asymmetric dimer that rationalizes binding affinity measurements that go back decades (Alvarado et al., Cell 2010;142:568–579; Dawson et al., Structure 2007;15:942–954; Lemmon et al., Embo J 1997;16:281–294; Mattoon et al., Proc Natl Acad Sci USA 2004;101:923–928; Mayawala et al., Febs Lett 2005;579:3043–3047; Ozcan et al., Proc Natl Acad Sci USA 2006;103:5735–5740). This type of asymmetric structure has not been seen for the human EGF receptor family and it may or may not be important for function in that realm. We hypothesize that conformational changes in the Drosophila system have been optimized for the transition, whereas the barrier for the same transition is much higher in the human forms. To address our hypothesis we perform dynamic importance sampling (DIMS) (Perilla et al., J Comput Chem 2010;32:196–209) for barrier crossing transitions in both Drosophila and human EFGRs. For each set of transitions, we work from the hypothesis, based on results from the AdK system, that salt-bridge pairs making and breaking connections are central to the conformational change. To evaluate the effectiveness of the salt-bridges as drivers for the conformational change, we use the effective transfer entropy based on stable state MD calculations (Kamberaj and Der Vaart, Biophys J 2009;97:1747–1755) to define a reduced subset of degrees of freedom that seem to be important for driving the transition (Perilla and Woolf, J Chem Phys 2012;136:164101). Our results suggest that salt-bridge making and breaking is not the dominant factor in driving the symmetric to asymmetric transition, but that instead it is a result of more concerted and correlated functional motions within a subset of the dimer structures. Furthermore, the analysis suggests that the set of residues involved in the transitions from the Drosophila relative to the human forms differs and that this difference in substate distributions relates to why the asymmetric form may be more common to Drosophila than to the human forms. We close with a discussion about the residues that may be changed in the human and the Drosophila forms to potentially shift the kinetics of the symmetric to asymmetric transition.
Keywords: epidermal growth factor receptor, molecular dynamics, conformational change, order parameters, extra-cellular domain
INTRODUCTION
The extracellular domain (ECD) of the epidermal growth factor (EGF) receptor binds ligand and activates an intracellular kinase.1-5 While the full-length receptor has not been determined to high resolution, the ECD has many structures that have been defined for the human and the Drosophila. Recent X-ray work on Drosophila has discovered an asymmetric dimer that has not been seen before.6,7 This dimer may rationalize the binding affinity curves seen in the Drosophila system and may present a mechanism that is important for other EGF receptors or one that is unique to the Drosophila system.8-14
The epidermal growth factor receptor (EGFR or ErbB or HER) is a major target for cancer drug development.15-17 It is known that over-expression and mutations of hEGFR and ErbB2/HER2/Neu are present in several human cancers.18-27 Treatments targeting hEGFR include monoclonal antibodies and tyrosine kinases inhibitors.28-34 Multiple X-ray structures provide some indications of the conformational changes that occur within the ECD upon activation by a growth factor ligand.33,35-39 These X-ray structures suggest a change both at the monomer level and at the dimer level. Yet the molecular details of how the conformations change with activation are not fully understood.
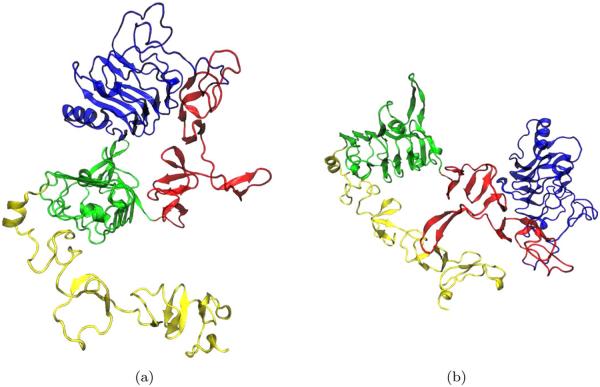
There are four members of the EGFR family in humans (hEGFR 1-4), whilst there is only one present in Drosophila melanogaster (dEGFR). However, the four hEGFR found in human and the single one present in Drosophila have high sequence identity between them and are structurally similar (Fig. 1). They all share similar structural features: an ECD, a transmembrane domain, and a kinase domain found at the interior of the cell. The extracellular portion of the human receptor consists of four domains (Fig. 2) in contrast with the five present in Drosophila.
Figure 1.
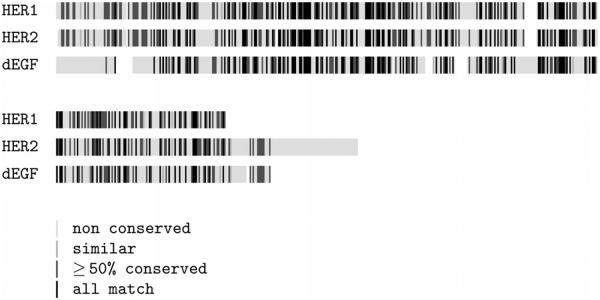
Sequence alignment for the receptors: HER1, HER2 and dEGFr.
Figure 2.
Epidermal growth factor receptor, as a monomer. (a) Extended state and (b) Tethered state.
Of the four receptors present in humans, three (HER, HER3, and HER4) are known to form homo-dimers. It is known that activation occurs by dimerization, induced by binding of EGF to the extracellular portion of the receptor, and that it is mediated by a dimerization arm present in domain II.38,40 However, the detailed mechanism by which the receptor dimerizes is not clearly understood. Furthermore, as a monomer, receptor HER3 has been crystallized in a tethered conformation that prevents exposure of the dimerization arm by a weak interaction between domains I–IV, therefore, preventing the formation of the dimer (Fig. 2).36 HER4 has also been found, by X-ray, to be in a tethered conformation in the absence of ligand.41 Studies have shown that removing of the contact, only modestly reduces the affinity of the receptor for the ligand.36,42 Moreover, deleting domain IV does not cause ligand-independent dimerization of the EGFR extracellular region. Thus, suggesting that the hiding of the dimerization arm is not the only inhibitory mechanism.
The structures of two conformational states of the dimeric form of dEGFr have been recently solved by X-ray crystallography: 3I2T6 and 3LTG (Fig. 3).7 Unligated dEGFr crystallizes as a symmetric dimer, with two identical binding sites [symmetrical dimeric conformation (Fig. 3)6]. Conversely, singly ligated sdEGFr dimers are asymmetric; binding of SpitzEGFΔC to one of the monomeric units, separates domains I and III bending domain II such that it collapses against its counterpart on the second monomeric unit (Fig. 3).7 Binding of a second ligand has been shown not to disrupt the interactions between domains I–III; moreover, the interface between the two monomeric units remains collapsed.
Figure 3.
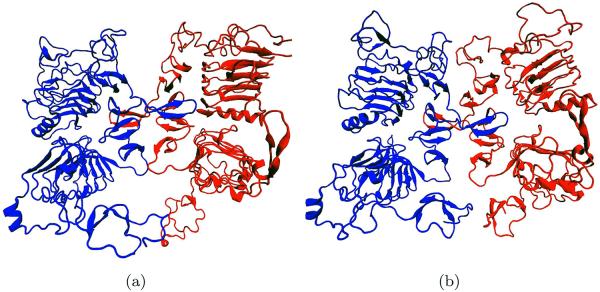
Epidermal growth factor receptor, as a dimer. (a) Symmetric form state and (b) Asymmetric form state. [Color figure can be viewed in the online issue, which is available at wileyonlinelibrary.com.]
Unlike the other members of the hEGF family, HER2 is well known to form only heterodimers with any of the other three receptors (in particular with HER3), suggesting that it may function primarily as a coreceptor.43,44 It also has been suggested that interaction between domains I–III stabilizes the receptor in a conformation resembling the active state of EGFR.45,46 There have been several hypothesis proposed as to why HER2 forms only heterodimers including: steric clashes47 and unfavorable electrostatic interactions46 and comparison to the Drosophila form.48 In this study, we analyze the possibility of an asymmetric model, as in dEGFr, for the homodimer form of HER2 and how it compares to the asymmetric form of both HER1 and dEGFr.
MODELS AND METHODS
Protein sequence and structure
Each of the sequences of HER1, and HER2 was aligned with the sequence of the dimeric forms of dEFGr using ClustalW (Fig. 1).49 Four homology models were built in Modeller9v750 based on the sequences of HER1 and HER2, using the structures of dEGFr as templates. For notation, the models are named after the template structures (pdb accession code) as: d-sym and d-asym, for the symmetric and assymetric states of drosophila, respectively. The symmetric and asymmetric states of HER1 and HER2/Erbb are named h-sym, h-asym, h2-sym, and h2-asym, respectively.
The models were solvated and ionized using VMD,51 minimized for 30,000 steps and then equilibrated for 6 ns. The size of the simulations (in terms of the number of atoms) and length of the production runs are summarized in Table I. All simulations were performed over at NICS-Kraken and TACC-Lonestar, using NAMD2.7b352 in conjunction to the CHARMM22 with CMAP corrections force field.53 Analysis was performed at NCSA-Abe/Lincoln and TACC-Lonestar, using the transfer entropies formalism.54,55
Table I.
Simulation Details for the Different Models of EGF
| System | MD (ns) |
Sim. size (atoms) |
No. of DIMS transitions |
Computing resource |
|---|---|---|---|---|
| d-sym | 20 | 138,000 | 201 | TACC-Lonestar |
| d-asym | 20 | 115,000 | 202 | TACC-Lonestar |
| h-sym | 36 | 123,000 | 198 | NICS-Kraken/TACC-Lonestar |
| h-asym | 36 | 137,000 | 200 | NICS-Kraken/TACC-Lonestar |
| h2-sym | 34 | 142,000 | 201 | NICS-Kraken/TACC-Lonestar |
| h2-asym | 34 | 149,000 | 204 | NICS-Kraken/TACC-Lonestar |
Dynamic importance sampling (DIMS) simulations
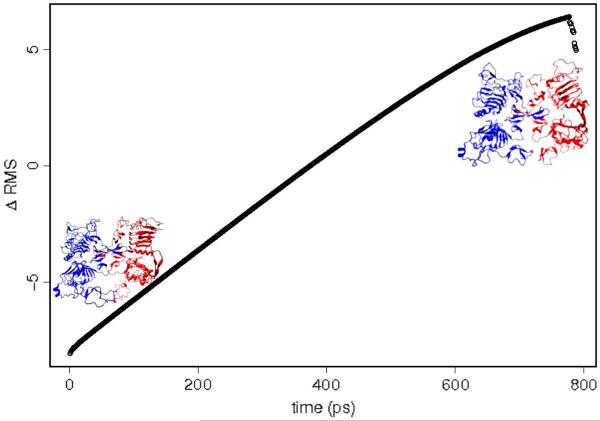
In addition to the unbiased molecular dynamics simulations, we also investigated the transitions between each pair of structures (namely, d-sym ↔ d-asym, h-sym ↔ h-asym, and h2-sym ↔ h2-asym) using DIMS.56 We used the soft-ratcheting algorithm incorporated in CHARMM56 with a rejection parameter set to 1.0×10⁻⁴, and used the entire structure for the RMS alignment in all cases, the bias was applied only to the Cα carbons. The number of trajectories generated going on each direction is summarized in Table I. An example of the RMS changes along the trajectory using DIMS is presented in Figure 4. Note that the DIMS transitions are different from the canonical MD used within the transfer entropy formalism. The length of a DIMS transition is, on average, about 1 ns. These relatively short simulations are used to explore the barrier crossing times, times that are known to be much shorter than the kinetics of the transition itself that are dominated by the dwell times within the states. Therefore, the DIMS ensemble is, on average, equivalent to 200 ns, however, given the nature of the method this timescale cannot be directly compared to canonical MD simulations.56,57 We prepared a special version of DIMS to run on hybrid (OpenMP/MPI) high performance computing environments, all simulations were performed in TACC-Lonestar.
Figure 4.
ΔRMSD as a function of time, for transitions between the symmetric and asymmetric form of the Drosophila EGF receptor. [Color figure can be viewed in the online issue, which is available at wileyonlinelibrary.com.]
ANALYSIS
Principal component analysis
For a molecular dynamics (MD) trajectory of a protein with N atoms, the correlation matrix σ can be built as follows:
| (1) |
where the brackets (〈…〉) denote time averages. The orthonormal basis vectors [principal components (PC)] are determined by the eigenvalue problem . The lowest frequency modes from principal component analysis (PCA) are normally associated with slow motions and have been extensively used to predict intermediate states. For a given mode α, the involvement coefficients (ICs) are defined as:
| (2) |
where are the set of normalized coordinates for the active-state and inactive-state conformations, respectively. Therefore, the ICs measure the amount of overlap between a PC and the direction defined by the displacement vector between structures. Since ηα is an orthonormal base, we can define the cumulative IC μα of the first α PCs as:
| (3) |
and measure how much of the overall difference is accounted for the first α modes.
Information flow analysis
For a residue j ≠ i with a center of mass Y, and probability distribution p(Y); one could say that its trajectory is independent of that of residue i if
| (4) |
where p(yn+1|yn) is the conditional probability to find residue j at state yn+1 given the past yn, … , y1, and p(yn+1|yn, xn) is the conditional probability to find residue j at state yn+1 given the past of both i and j. In the case, where there is not a flux of information from X to Y then Eq. (4) is correct. Conversely, and in the event that there is flux of information in any direction, the divergence from correctness of Eq. (4) can be quantified by the Kullback–Leibler entropy58 hence defining the transfer entropy:54,55,59
| (5) |
The transfer entropy between i and j is minimum and equals to zero when the two residues are independent and is maximum and equals to the entropy rate:
| (6) |
when the residues are completely coupled. To minimize artifacts within the time series, we use the normalized effective transfer entropy given by:60,61
| (7) |
where the second term is the average transfer entropy from Ntrials surrogated samples of X to Y. The total flux between two residues X and Y, can be calculated by the equation,
| (8) |
Residues are then selected according to the following rules: i is selected if DX→Y > 0. residue j is selected if DX→Y < 0, and if DX→Y = 0 then no residue is selected. The set of most dominant residues Γ is then defined as the set of residues that follow the rules above and also that are above a fixed cutoff |DX→Y| ≥ Dcutoff.
Network analysis of residues
The network of interactions between residues can be mapped into a graph where each node i is a residue, and every pairwise interaction between residues i and j is an edge Ei,j with a weight given by Di→j. Nodes can then be classified as broadcasters and receivers of information. Since in our analysis every node is connected, the total flux of information for a node i can be computed by,
| (9) |
It is also possible to compute the average flux of information for the whole system as well as the standard deviation σ. In particular, for our analysis we propose the modes to be classified in five categories:
Salt-bridges analysis
As seen in previous studies,57 salt-bridges can play a pivotal role in transitions of certain proteins. They can stabilize ligands within active states as well as intermediate states. Here, we tracked a range of possible salt bridges along the transition through domain ΔRMS space; we focused on salt bridges that would form or break during a transition. For that we computed the score S along a transition, defined by:
| (10) |
where d0 is the initial distance of the salt-bridge pair at the beginning of the transition. Therefore, the salt-bridge pairs that break or form will have the higher scores among all possible pairs. Results are computed along the ΔRMS parameter, defined as:
| (11) |
RESULTS
Previous models of HER2 homo-dimers47 have focused on the dimeric structure of hEGFr38 which lacks the asymmetry present in the homo-dimer state of dEGFr. Our models were based on the recently released structures for the unbound symmetric, and singly ligated asymmetric dimeric forms of dEGFr.6,7
Symmetric states
Salt-bridge analysis
Sequence analysis of the EGF family highlights a large number of conserved charged residues (Fig. 5). As mentioned in Introduction, a set of interactions, analogous to those present in dEGFr, between domains I–III play a key role in maintaining HER2 in its active-like state, these interactions are present in the symmetric model of HER2 (h2-sym), and analogous interactions are also present in our model of HER1 (h-sym). In this section, we present the results from the trajectories going from the symmetric model towards the asymmetric model for the three members of the EGF family: 3i2t → 3ltg, h-sym → h-asym, and h2-sym to h2-asym.
Figure 5.
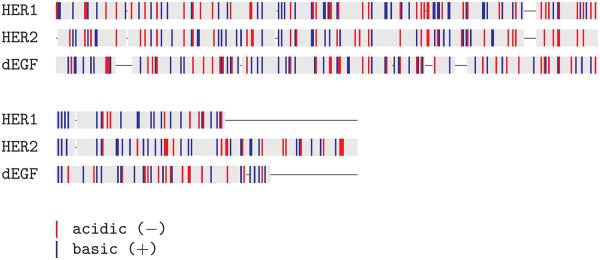
Sequence alignment highlighting the charged regions of EGF. [Color figure can be viewed in the online issue, which is available at wileyonlinelibrary.com.]
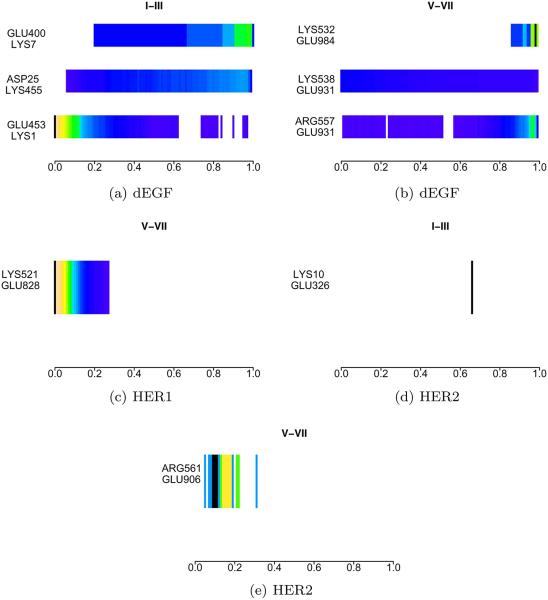
Transitions for dEGFr (shown in Figure 6) are characterized by the breaking of the Glu453-Lys1 salt-bridge in the interface of domains I–III of the unit that collapses (right), and the formation of the salt-bridges Glu400-Lys7 and Asp25-Lys455 in the same interface in the unit that is collapsed (left). Transitions for HER1 dramatically differs as no new bridges are formed and only a breaking of the salt-bridge Glu318-Lys11 is present on the left subunit. In a similar way, transitions for HER2 are only characterized by the breaking of the salt-bridge Glu318-Lys11 on the left subunit.
Figure 6.
Salt-bridges probability density along the symmetric transitions. Domains I–IV represent the left domain, domains V–VIII represent the domains on the right. [Color figure can be viewed in the online issue, which is available at wileyonlinelibrary.com.]
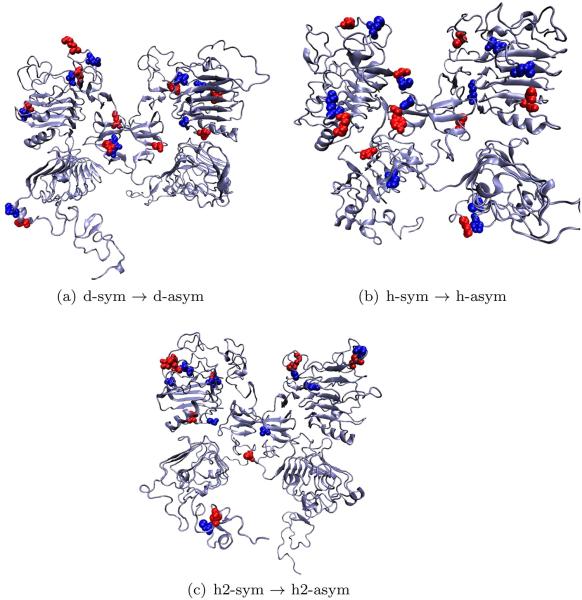
This picture is complemented by the salt bridges with the most change along the transition [score S, see Eq. (10)]. In the three models, it can be observed (see Fig. 7) how salt-bridges in the domains I–III interface and the interface between left II-right II are among the 20% of all possible salt bridges that are modified along the transitions.
Figure 7.
Salt-bridges that change the most along the symmetric transitions. [Color figure can be viewed in the online issue, which is available at wileyonlinelibrary.com.]
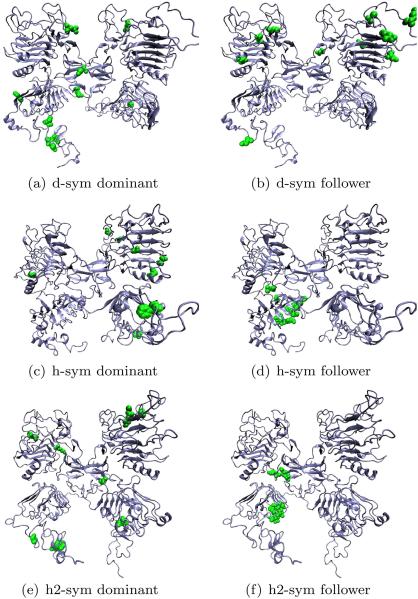
Information flow
The total flux of information was calculated from canonical MD simulations using the transfer entropies framework54,55 and Eq. (9). Residues were classified according to the rules introduced in Network analysis of residues section. The results are presented visually in Figure 8. For dEGFr, all leaders seem to be concentrated on the domains II and IV of both left and right monomeric subunits, whereas the followers are mostly localized in the buried regions of domain I of both subunits. In the case of HER1, leader residues are located on the exposed regions of domain I (left and right) and followers are located only on the left subunit near the interface between domains I and II. Analysis, on HER2 shows that all leader residues are located in the exposed regions of domains I (left and right), whereas followers are located in the interface between domains I and III. Taking into account, the fact that the leader residues act as broadcasters of information, and the followers as receivers in our network analysis. Although, initially it might appear there is little correlation between the localization of the leaders and followers for the three models. The fact that there is a well defined flux of information going from the water exposed parts of domain I towards different domain interfaces, suggests that any change on the surroundings of any of the receptors (as, for example, by the presence of EGF) is effectively affecting the interdomain interactions of the receptors thus triggering conformational changes.
Figure 8.
Network analysis of the information flow for different models of EGFr. Residues are classified according to their role as leaders/dominant or followers. [Color figure can be viewed in the online issue, which is available at wileyonlinelibrary.com.]
PCA analysis
The ICs quantifies the amount of overlap between a PC and a probe direction. The cumulative ICs quantifies the percentage of the conformational difference accounted by a subset of low-indexed PCs [Eq. (3)]. For each stable state, we computed the full set of PCs and calculated the cumulative ICs as presented in Table II.
Table II.
Cumulative Involvement Coefficients for Different Models of the Symmetric Form of EGFr
| System | Probe direction | μ20 (%) | μ50 (%) |
|---|---|---|---|
| d-sym | d-asym | 60 | 71 |
| h-sym | d-asym | 62 | 76 |
| h-sym | 3njp | 72 | 0.80 |
| h2-sym | h2-asym | 54 | 0.67 |
The degree of overlap between the modes of the symmetric forms of HER1, HER2, and dEGF, and their asymmetric counterparts suggest that each state would be accessible to the system just by following a set of low-indexed PCs. We also computed the cumulative IC for HER1 going to the crystallized double bound dimeric form; results are similar to the ones obtained by using the asymmetric form as the direction probe, suggesting that from the unbound ligand dimeric form perspective either conformational can be reach by following a small subset of PCs.
Asymmetric state
Salt-bridge analysis
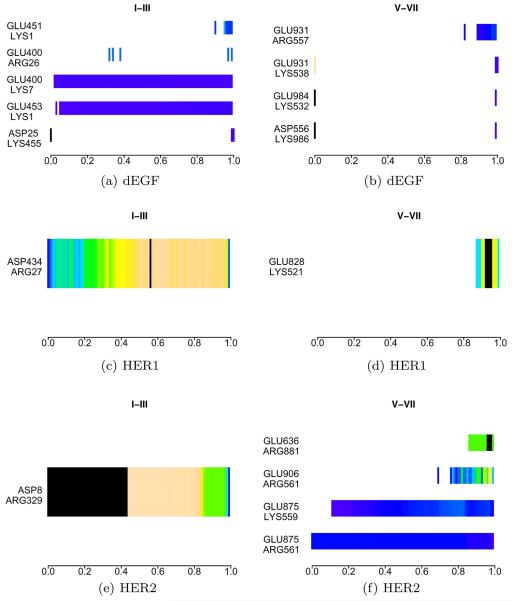
Results from the analysis performed on the models based on the singly ligated asymmetric dimeric forms of dEGFr,6,7 contrast to those from its symmetrical counterpart. In this section, we present the results from the trajectories going from the asymmetric model towards the symmetric model for the three members of the EGF family: 3ltg → 3i2t, h-asym → h-sym, and h2-asym to h2-sym.
The pattern of salt-bridges going from the asymmetric form towards the unbound symmetric model provides an interesting landscape of the interactions stabilizing both of the structures. These results can be seen in Figure 9. Interactions between domains I–III in dEGFr are characterized by the rapid breaking of ASP25-LYS455, and the formation of residues GLU451-LYS1 on the left subunit. On the right subunit of dEGFr the breaking, in sequence, of the three salt-bridges GLU931-LYS538 → GLU984-LYS532 → ASP556-LYS986 characterize the transition, reappearing with lower probability at the end of the transitions. The HER1 transitions is marked by the appearance of the highly populated bridge ASP434-ARG27, in the intermediate states along the transition on the left subunit. The right subunit of HER1 presents the formation of the bridge GLU828-LYS521 at the end of the transition, near the symmetric form of HER1. Transitions of HER2 show the breaking of the bridge ASP8-ARG329 on the left subunit, and the forming of three bridges on the right subunit: GLU875-LYS559, GLU906-ARG561, and GLU636-ARG881.
Figure 9.
Salt-bridges probability density along the asymmetric transitions. Domains I–IV represent the left domain, domains V–VIII represent the domains on the right. [Color figure can be viewed in the online issue, which is available at wileyonlinelibrary.com.]
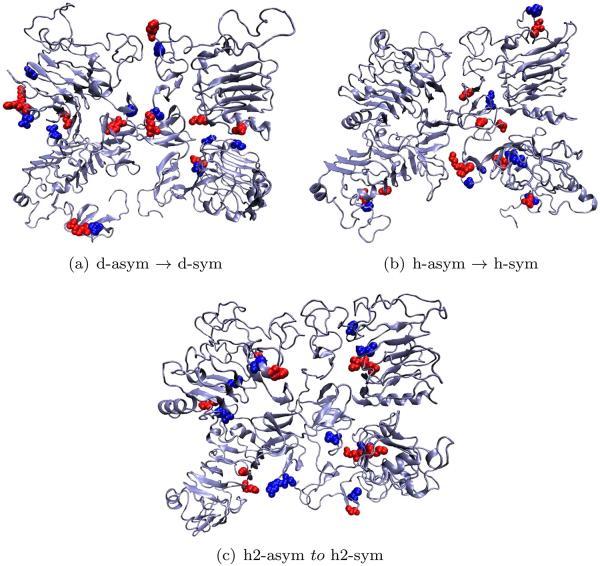
Observing the interactions between charged residues along the transitions provides valuable information regarding the transition states. By observing the set of residues that vary the most along a set of pathways we are able to identify possible residues that are key to stabilizing intermediate states as well as the stable states. The amount of change along the transitions for each salt-bridge pair was quantified by the score S [Eq. (10)]. These residues are highlighted in Figure 10. In the three models, it can be seen how these residues lie in the interface areas between several different domains. In the case of dEGFr interactions between domains I–III for both the left and right subunits seem to be key to the transition, similar to interaction between domains L-II and R-II (Fig. 10). Interactions for the models of HER1 and HER2 are less pronounced in those regions, and interactions between domains I–II of both subunits appear to play a more important role.
Figure 10.
Salt-bridges that change the most along the asymmetric transitions. [Color figure can be viewed in the online issue, which is available at wileyonlinelibrary.com.]
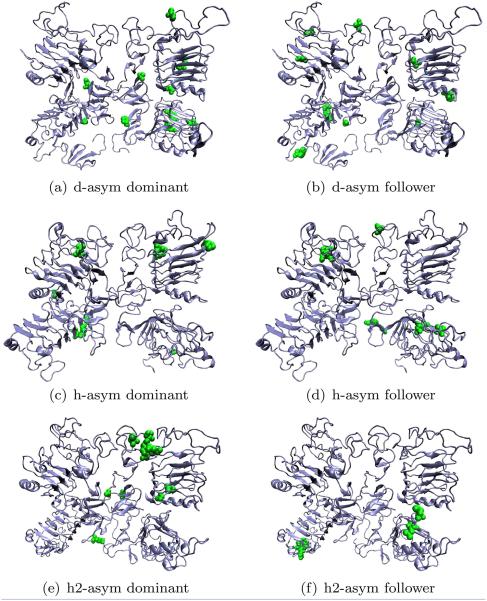
Information flow
Similar to the symmetric form, we performed a network analysis over the transfer entropies obtained from MD simulations.54,55 Residues were classified according to the rules introduced in Network analysis of residues section. For dEGFr, all leaders were located on the right subunit while the followers were predominantly on the left subunit, in all cases the residues were mostly buried in the protein. The followers in the HER1 are symmetrical distributed among the monomeric units. Most of them appear in the interface between domains I–III of the right subunit, and the interface of domains III and IV. The followers are found in the interface between domains I–III and domains II–III on the right subunit. In contrast, HER2 results show that the leaders are located in the interface region between domains I–II and domains I–III on the right subunit, and the interface between domains II–II of both monomeric units. Residues involved in the network flow for HEr2 are buried in the protein, and the network is asymmetrical (Fig. 11).
Figure 11.
Network analysis of the information flow for different models for the asymmetric dimeric form of EGFr. Residues are classified according to their role as leaders/dominant or followers. [Color figure can be viewed in the online issue, which is available at wileyonlinelibrary.com.]
In all three cases of the information flow analysis interactions in the interface between domains I–III on the right subunit, were found as followers, similar to the results from the symmetric form. However, unlike the symmetric form, most leaders were not scattered over the exposed regions of the protein, but located in several different interdomain interfaces or buried within the protein.
PCA analysis
The cumulative ICs were calculated for the asymmetric models of HER1, HER2, and dEGF (Table III). Similar to the results summarized in Table II, our results show that going from the asymmetric form towards the unbound symmetric form is possible just by following a small number of modes; however, the number of modes required is doubled to achieve an overlap comparable to the ones seen in three. In the case of HER1, we used the crystallized double bound dimeric symmetric form 3njp62 as a probe direction, the results show similar results to those presented for the symmetric form.
Table III.
Cumulative Involvement Coefficients for Different Models of the Asymmetric Form of EGFr
| System | Probe direction | μ20 (%) | μ50 (%) |
|---|---|---|---|
| d-asym | d-sym | 47 | 66 |
| h-asym | d-sym | 45 | 68 |
| h-asym | 3njp | 48 | 62 |
| h2-asym | h2-sym | 54 | 65 |
DISCUSSION
Binding affinity measurements for the EGF receptor have not been consistent with the X-ray structures for many years. The recent discovery, in Drosophila, of an asymmetric dimer, has suggested a structural resolution of the binding curves. An immediate question, one that we have addressed in this article, is whether this asymmetric structure is also important for binding in the human counterpart.
Calculations for the stable states and transitions between the stable states have provided some initial answers. The transitions used the DIMS algorithm and provides a set of independent trajectories that link the starting and the ending states. In parallel, and independently of the DIMS transitions, we have analyzed the stable states using the transfer entropy formalism over unbiased molecular dynamics simulations.54,55
An intriguing finding, one that will need more calculations and experimental work to followup, is that salt-bridge pairs are not the dominant drivers of conformational change. This can be tested with experimental mutations as well as with more computational work that explores the changes in transitions with mutations to salt-bridge pairs. In addition, our transfer entropy analysis, suggests that correlated motions within sets of buried residues is important for initiating and driving the conformational changes. This in turn suggests that mutations can be made that will stabilize one conformation over another at either side of the pathway. Thus, we can imagine engineering change that stabilizes an asymmetric dimer within the human EGFR.
This set of simulations can be compared with the only other simulations of the EGFR dimer that has been published to date.63 In this work, with two ligand bound dimers, symmetry breaking changes were observed as fluctuations from the X-ray structures. The calculations were on much larger systems than ours (more than 500,000 atoms). The authors mainly concluded that dimer contacts were important and that the disordered domain IV may help to stabilize the dimers. They did not discuss the differences between Drosophila dimers, asymmetric forms, and the possible role of salt bridges and amino acids in the transitions between the symmetric and asymmetric conformations. Thus, our calculations are significant in rationalizing the possible mechanisms of conformational change from the symmetric state.
CONCLUSIONS
This study addresses an intriguing question in the function of EGF receptors. That is, does the asymmetric dimer observed for Drosophila exist only in that one receptor system or is it a more common element for human as well? Our computations suggest some insights into the nature of the changes in moving from a symmetric to an asymmetric conformation. First, we find that there is a population of about 20% of all salt bridges that is modified during the transitions of all simulations. It is interesting to note that this population differs between the Drosophila and the human forms. Second, our effective transfer entropy calculations have shown that the main order parameters driving the transitions are not directly the salt-bridges, but that more involved concerted motions of the whole system is needed for the transitions to happen. This is important, since it implies that the salt-bridge changes are more a cause of the transition, rather than the controlling factors in the transition. Our final point concerns the nature of the changes between the Drosophila and the human forms of the receptors. This last point suggests that further computations addressing the differences in the systems could address the free energy surfaces directly and that simulations of the mutations seen as driving the changes could be performed. The computations suggest that the barrier to transitions, as seen in changes in barrier crossing times, is much higher in humans than in Drosophila and that the reason has to do with a shift in the reduced descriptors for the transition seen in the effective transfer entropy.
REFERENCES
- 1.Burgess AW. EGFR family: structure physiology signalling and therapeutic targets. Growth Factors. 2008;26:263–274. doi: 10.1080/08977190802312844. [DOI] [PubMed] [Google Scholar]
- 2.Defize LH, Boonstra J, Meisenhelder J, Kruijer W, Tertoolen LGJ, Tilly BC, Hunter T, van Bergen en Henegouwen PMP, Moolenaar WH, de Laat SW. Signal transduction by epidermal growth factor occurs through the subclass of high affinity receptors. J Cell Biol. 1989;109:2495–2507. doi: 10.1083/jcb.109.5.2495. [DOI] [PMC free article] [PubMed] [Google Scholar]
- 3.Leahy DJ. The ins and outs of EGFR asymmetry. Cell. 2010;142:513–515. doi: 10.1016/j.cell.2010.08.003. [DOI] [PubMed] [Google Scholar]
- 4.Schneider MR, Wolf E. The epidermal growth factor receptor ligands at a glance. J Cell Physiol. 2009;218:460–466. doi: 10.1002/jcp.21635. [DOI] [PubMed] [Google Scholar]
- 5.Ward CW, Lawrence MC, Streltsov VA, Adams TE, Mckern NM. The insulin and EGF receptor structures: new insights into ligand-induced receptor activation. Trends Biochem Sci. 2007;32:129–137. doi: 10.1016/j.tibs.2007.01.001. [DOI] [PubMed] [Google Scholar]
- 6.Alvarado D, Klein DE, Lemmon MA. Erbb2 resembles an autoinhibited invertebrate epidermal growth factor receptor. Nature. 2009;461:287–291. doi: 10.1038/nature08297. [DOI] [PMC free article] [PubMed] [Google Scholar]
- 7.Alvarado D, Klein DE, Lemmon MA. Structural basis for negative cooperativity in growth factor binding to an EGF receptor. Cell. 2010;142:568–579. doi: 10.1016/j.cell.2010.07.015. [DOI] [PMC free article] [PubMed] [Google Scholar]
- 8.Chanut-Delalande H, Jung AC, Baer MM, Lin L, Payre F, Affolter M. The hrs/stam complex acts as a positive and negative regulator of RTK signaling during drosophila development. Plos One. 2010;5:E10245. doi: 10.1371/journal.pone.0010245. [DOI] [PMC free article] [PubMed] [Google Scholar]
- 9.Krall JA, Beyer EM, Macbeath G. High- and low-affinity epidermal growth factor receptor-ligand interactions activate distinct signaling pathways. Plos One. 2011;6:E15945. doi: 10.1371/journal.pone.0015945. [DOI] [PMC free article] [PubMed] [Google Scholar]
- 10.Dawson JP, Bu Z, Lemmon MA. Ligand-induced structural transitions in erbb receptor extracellular domains. Structure. 2007;15:942–954. doi: 10.1016/j.str.2007.06.013. [DOI] [PubMed] [Google Scholar]
- 11.Lemmon MA, Bu Z, Ladbury JE, Zhou M, Pinchasi D, Lax I, Engelman DM, Schlessinger J. Two EGF molecules contribute additively to stabilization of the EGFR dimer. Embo J. 1997;16:281–294. doi: 10.1093/emboj/16.2.281. [DOI] [PMC free article] [PubMed] [Google Scholar]
- 12.Mattoon D, Klein P, Lemmon MA, Lax I, Schlessinger J. The tethered configuration of the EGF receptor extracellular domain exerts only a limited control of receptor function. Proc Natl Acad Sci USA. 2004;101:923–928. doi: 10.1073/pnas.0307286101. [DOI] [PMC free article] [PubMed] [Google Scholar]
- 13.Mayawala K, Vlachos DG, Edwards JS. Heterogeneities in EGF receptor density at the cell surface can lead to concave up scatchard plot of EGF binding. Febs Lett. 2005;579:3043–3047. doi: 10.1016/j.febslet.2005.04.059. [DOI] [PubMed] [Google Scholar]
- 14.Ozcan F, Klein P, Lemmon MA, Lax I, Schlessinger J. On the nature of low- and high-affinity EGF receptors on living cells. Proc Natl Acad Sci USA. 2006;103:5735–5740. doi: 10.1073/pnas.0601469103. [DOI] [PMC free article] [PubMed] [Google Scholar]
- 15.Gan HK, Walker F, Burgess AW, Rigopoulos A, Scott AM, Johns TG. The epidermal growth factor receptor (EGFR) tyrosine kinase inhibitor ag1478 increases the formation of inactive untethered EGFR dimers. Implications for combination therapy with monoclonal antibody 806. J Biol Chem. 2007;282:2840–28450. doi: 10.1074/jbc.M605136200. [DOI] [PubMed] [Google Scholar]
- 16.Jorissen RN, Walker F, Pouliot N, Garrett TJ, Ward CW, Burgess AW. Epidermal growth factor receptor: mechanisms of activation and signalling. Exp Cell Res. 2003;284:31–53. doi: 10.1016/s0014-4827(02)00098-8. [DOI] [PubMed] [Google Scholar]
- 17.Pines G, Köstler WJ, Yarden Y. Oncogenic mutant forms of EGFR: lessons in signal transduction and targets for cancer therapy. Febs Lett. 2010;584:2699–2706. doi: 10.1016/j.febslet.2010.04.019. [DOI] [PMC free article] [PubMed] [Google Scholar]
- 18.Chan HL, Chou HC, Duran M, Gruenewald J, Waterfield MD, Ridley A, Timms JF. Major role of epidermal growth factor receptor and SRC kinases in promoting oxidative stress-dependent loss of adhesion and apoptosis in epithelial cells. J Biol Chem. 2010;285:4307–4318. doi: 10.1074/jbc.M109.047027. [DOI] [PMC free article] [PubMed] [Google Scholar]
- 19.Koeppen H, Wright BD, Burt AD, Quirke P, McNicol AM, Dybdal NO, Sliwkowski MX, Hillan KJ. Overexpression of her2/neu in solid tumours: sn immunohistochemical survey. Histopathology. 2001;38:96–104. doi: 10.1046/j.1365-2559.2001.01084.x. [DOI] [PubMed] [Google Scholar]
- 20.Monsey J, Shen W, Schlesinger P, Bose R. Her4 and her2/neu tyrosine kinase domains dimerize and activate in a reconstituted in vitro system. J Biol Chem. 2010;285:7035–7044. doi: 10.1074/jbc.M109.096032. [DOI] [PMC free article] [PubMed] [Google Scholar]
- 21.Paik S, Liu ET. Her2 as a predictor of therapeutic response in breast cancer. Breast Dis. 2000;11:91–102. doi: 10.3233/bd-1999-11108. [DOI] [PubMed] [Google Scholar]
- 22.Press MF, et al. Amplification and overexpression of her-2/neu in carcinomas of the salivary gland: correlation with poor prognosis. Cancer Res. 1994;54:5675–5682. [PubMed] [Google Scholar]
- 23.Ross JS, Fletcher JA. The her-2/neu oncogene in breast cancer: prognostic factor, predictive factor, and target for therapy. Stem Cells. 1998;16:413–428. doi: 10.1002/stem.160413. [DOI] [PubMed] [Google Scholar]
- 24.Schmidt-Glenewinkel H, Reinz E, Eils R, Brady NR. Systems biological analysis of epidermal growth factor receptor internalization dynamics for altered receptor levels. J Biol Chem. 2009;284:17243–17252. doi: 10.1074/jbc.M809586200. [DOI] [PMC free article] [PubMed] [Google Scholar]
- 25.Slamon DJ, Clark GM, Wong SG, Levin WJ, Ulrich A, McGuire WL. Human breast cancer: correlation of relapse and survival with amplification of the her-2/neu oncogene. Science. 1987;235:177–182. doi: 10.1126/science.3798106. [DOI] [PubMed] [Google Scholar]
- 26.Slamon DJ, Godolphin W, Jones LA, Holt JA, Wong SG, Keith DE, Levin WJ, Stuart SG, Udove J, Ullrich A. Studies of the her-2/neu proto-oncogene in human-breast and ovarian-cancer. Science. 1989;244:707–712. doi: 10.1126/science.2470152. [DOI] [PubMed] [Google Scholar]
- 27.Yuan T, Wang Y, Zhao ZJ, Gu H. Protein-tyrosine phosphatase ptpn9 negatively regulates erbb2 and epidermal growth factor receptor signaling in breast cancer cells. J Biol Chem. 2010;285:14861–14870. doi: 10.1074/jbc.M109.099879. [DOI] [PMC free article] [PubMed] [Google Scholar]
- 28.Furuuchi K, Berezov A, Kumagai T, Greene MI. Targeted antireceptor therapy with monoclonal antibodies leads to the formation of inactivated tetrameric forms of erbb receptors. J Immunol. 2007;178:1021–1029. doi: 10.4049/jimmunol.178.2.1021. [DOI] [PubMed] [Google Scholar]
- 29.Garrett TJ, Burgess AW, Gan HK, Luwor RB, Cartwright G, Walkder F, Orchard SG, Clayton AHA, Nice EC, Rothacker J, Catimel B, Cavenee WK, Old LJ, Stockert E, Ritter G, Adams TE, Hoyne PA, Wittrup D, Chao G, Cochran JR, Luo C, Lou M, Huyton T, Xu Y, Fairlie WD, Yao S, Scott AM, Johns TG. Antibodies specifically targeting a locally misfolded region of tumor associated EGFR. Proc Natl Acad Sci USA. 2009;106:5082–5087. doi: 10.1073/pnas.0811559106. [DOI] [PMC free article] [PubMed] [Google Scholar]
- 30.Lammerts Van Bueren J, Bleeker WK, Brannstrom A, von Euler A, Jansson M, Peipp M, Schneider-Merck T, Valerius T, van de Windel JGJ, Parren PWHI. The antibody zalutumumab inhibits epidermal growth factor receptor signaling by limiting intra- and intermolecular flexibility. Proc Natl Acad Sci USA. 2008;105:6109–6114. doi: 10.1073/pnas.0709477105. [DOI] [PMC free article] [PubMed] [Google Scholar] [Retracted]
- 31.Leahy DJ. A molecular view of anti-erbb monoclonal antibody therapy. Cancer Cell. 2008;13:291–293. doi: 10.1016/j.ccr.2008.03.010. [DOI] [PubMed] [Google Scholar]
- 32.Li S, Kussie P, Ferguson KM. Structural basis for EGF receptor inhibition by the therapeutic antibody imc-11f8. Structure. 2008;16:216–227. doi: 10.1016/j.str.2007.11.009. [DOI] [PubMed] [Google Scholar]
- 33.Schmiedel J, Blaukat A, Li S, Knöchel T, Ferguson KM. Matuzumab binding to EGFR prevents the conformational rearrangement required for dimerization. Cancer Cell. 2008;13:365–373. doi: 10.1016/j.ccr.2008.02.019. [DOI] [PMC free article] [PubMed] [Google Scholar]
- 34.Spangler JB, Neil JR, Abramovitch S, Yarden Y, White FM, Lauffenburger DA, Wittrup KD. Combination antibody treatment down-regulates epidermal growth factor receptor by inhibiting endosomal recycling. Proc Natl Acad Sci USA. 2010;107:13252–13257. doi: 10.1073/pnas.0913476107. [DOI] [PMC free article] [PubMed] [Google Scholar]
- 35.Dawson JP, Berger MB, Lin CC, Schlessinger J, Lemmon MA, Ferguson KM. Epidermal growth factor receptor dimerization and activation require ligand-induced conformational changes in the dimer interface. Mol Cell Biol. 2005;25:7734–7742. doi: 10.1128/MCB.25.17.7734-7742.2005. [DOI] [PMC free article] [PubMed] [Google Scholar]
- 36.Ferguson KM, Berger B, Mendrola JM, Cho HS, Leahy DJ, Lemmon MA. EGF activates its receptor by removing interactions that auto-inhibit ectodomain dimerization. Mol Cell. 2003;11:507–517. doi: 10.1016/s1097-2765(03)00047-9. [DOI] [PubMed] [Google Scholar]
- 37.Li S, Schmitz KR, Jeffrey PD, Wiltzius JW, Kussie P, Ferguson KM. Structural basis for inhibition of the epidermal growth factor receptor by cetuximab. Cancer Cell. 2005;7:301–311. doi: 10.1016/j.ccr.2005.03.003. [DOI] [PubMed] [Google Scholar]
- 38.Ogiso H, Ishitani R, Nureki O, Fukai S, Yamanaka M, Kim JH, Saito K, Sakamoto A, Inoue M, Shirouzu M, Yokoyama S. Crystal structure of the complex of human epidermal growth factor and receptor extracellular domains. Cell. 2002;110:775–787. doi: 10.1016/s0092-8674(02)00963-7. [DOI] [PubMed] [Google Scholar]
- 39.Schmitz KR, Ferguson KM. Interaction of antibodies with Erbb receptor extracellular regions. Exp Cell Res. 2009;315:659–670. doi: 10.1016/j.yexcr.2008.10.008. [DOI] [PMC free article] [PubMed] [Google Scholar]
- 40.Garrett TJ, McKern NM, Lou M, Ellerman TC, Adams TE, Lovrecz GO, Zhu H-J, Walker F, Frenkel MJ, Hoyne PA, Jorissen RN, Nice EC, Burgess AW, Ward CW. Crystal structure of a truncated epidermal growth factor receptor extracellular domain bound to transforming growth factor alpha. Cell. 2002;110:763–73. doi: 10.1016/s0092-8674(02)00940-6. 2002. [DOI] [PubMed] [Google Scholar]
- 41.Bouyain S, Longo PA, Li S, Ferguson KM, Leahy DJ. The extracellular region of erbb4 adopts a tethered conformation in the absence of ligand. Proc Natl Acad Sci USA. 2005;102:15024–15029. doi: 10.1073/pnas.0507591102. [DOI] [PMC free article] [PubMed] [Google Scholar]
- 42.Elleman TC, Domagala T, McKern NM, Nerrie M, Lonnqvist B, Adams TE, Lewis J, Lovrecz GO, Hoyne PA, Richards KM, Howlett GJ, Rothacker J, Jorissen RN, Lou M, Garrett TPJ, Burgess AW, Nice EC, Ward CW. Identification of a determinant of epidermal growth factor receptor ligand-binding specificity using a truncated, high-affinity form of the ectodomain. Biochemistry. 2001;40:8930–8939. doi: 10.1021/bi010037b. [DOI] [PubMed] [Google Scholar]
- 43.Citri A, Skaria KB, Yarden Y. The deaf and the dumb: the biology of erbb-2 and erbb-3. Exp Cell Res. 2003;284:54–65. doi: 10.1016/s0014-4827(02)00101-5. [DOI] [PubMed] [Google Scholar]
- 44.Yarden Y, Sliwkowski MX. Untangling the erbb signalling network. Nat Rev Mol Cell Biol. 2001;2:127–137. doi: 10.1038/35052073. [DOI] [PubMed] [Google Scholar]
- 45.Cho HS, Mason K, Ramyar KX, Stanley AM. Structure of the extracellular region of her2 alone and in complex with the herceptin fab. Nature. 2003;421:756–760. doi: 10.1038/nature01392. [DOI] [PubMed] [Google Scholar]
- 46.Garrett TJ, McKern NM, Lou M, Eleman TC, Adams TE, Lovrecz GO, Kofler M, Jorissen RN, Nice EC, Burgess AW, Ward CW. The crystal structure of a truncated erbb2 ectodomain reveals an active conformation, poised to interact with other erbb receptors. Mol Cell. 2003;11:495–505. doi: 10.1016/s1097-2765(03)00048-0. [DOI] [PubMed] [Google Scholar]
- 47.Franklin MC, Carey KD, Vajdos FF, Leahy DJ, de Vos AM, Sliwkowski MX. Insights into erbb signaling from the structure of the erbb2-pertuzumab complex. Cancer Cell. 2004;5:317–328. doi: 10.1016/s1535-6108(04)00083-2. [DOI] [PubMed] [Google Scholar]
- 48.Klein DE, Stayrook S, Shi F, Narayan K, Lemmon MA. Structural basis for EGFR ligand sequestration by argos. Nature. 2008;453:1271–1275. doi: 10.1038/nature06978. [DOI] [PMC free article] [PubMed] [Google Scholar]
- 49.Thompson JD, Gibson TJ, Higgins DG. Baxevanis Andreas D, et al., editors. Multiple sequence alignment using Clustalw and Clustalx. Curr Protoc Bioinformatics. 2002 doi: 10.1002/0471250953.bi0203s00. Editoral Board. Chapter 2 (1934–340x (Electronic) La—Eng Pt—Journal Article Sb—Im), Unit 2.3. [DOI] [PubMed] [Google Scholar]
- 50.Eswar N, Webb B, Marti-Renom MA, Madhusudhan MS, Eramian D, Shen M-Y, Pieper U, Sali A. Coligan John E, et al., editors. Comparative protein structure modeling using modeller. Curr Protoc Protein Sci. 2007 Nov; doi: 10.1002/0471140864.ps0209s50. Editorial Board. Chapter 2. Unit 2.9. [DOI] [PubMed] [Google Scholar]
- 51.Humphrey W, Dalke A, Schulten K. Vmd: visual molecular dynamics. J Mol Graph. 1996;14:33–38. doi: 10.1016/0263-7855(96)00018-5. [DOI] [PubMed] [Google Scholar]
- 52.Phillips JC, Braun R, Wang W, Gumbart J, Tajkhorshid E, Villa E, Chipot C, Skeel RD, Kale L, Schulten K. Scalable molecular dynamics with NAMD. J Comput Chem. 2005;26:1781–1802. doi: 10.1002/jcc.20289. [DOI] [PMC free article] [PubMed] [Google Scholar]
- 53.Mackerell AD, Bashford D, Dunbrack RL, Evanseck JD, Field MJ, Fischer S, Gao J, Guo Hl, Ha S, Joseph-McCarthy D, Kuchnir L, Kuczera K, Lau FTK, Mattos C, Michnick S, Ngo T, Nguyen DT, Prodhom B, Reiher WE, III, Roux B, Schlenkrich M, Smith JC, Stote R, Straub J, Watanabe M, Wiorkiewicz-Kuczera J, Yin D, Karplus M. All-atom empirical potential for molecular modeling and dynamics studies of proteins. J Phys Chem B. 1998;102:3586–3616. doi: 10.1021/jp973084f. [DOI] [PubMed] [Google Scholar]
- 54.Kamberaj H, Der Vaart A. Extracting the causality of correlated motions from molecular dynamics simulations. Biophys J. 2009;97:1747–1755. doi: 10.1016/j.bpj.2009.07.019. [DOI] [PMC free article] [PubMed] [Google Scholar]
- 55.Perilla JR, Woolf TB. Towards the prediction of order parameters from molecular dynamics simulations in proteins. J Chem Phys. 2012;136:164101. doi: 10.1063/1.3702447. [DOI] [PMC free article] [PubMed] [Google Scholar]
- 56.Perilla JR, Beckstein O, Denning EJ, Woolf TB. Computing ensembles of transitions from stable states: dynamic importance sampling. J Comput Chem. 2010;32:196–209. doi: 10.1002/jcc.21564. [DOI] [PMC free article] [PubMed] [Google Scholar]
- 57.Beckstein O, Denning EJ, Perilla JR, Woolf TB. Zipping and unzipping of adenylate kinase: atomistic insights into the ensemble of open closed transitions. J Mol Biol. 2009;394:160–176. doi: 10.1016/j.jmb.2009.09.009. [DOI] [PMC free article] [PubMed] [Google Scholar]
- 58.Kullback S, Leibler RA. On information and sufficiency. Ann Math Stat. 1951;22:79–86. [Google Scholar]
- 59.Schreiber T. Measuring information transfer. Phys Rev Lett. 2000;85:461–464. doi: 10.1103/PhysRevLett.85.461. [DOI] [PubMed] [Google Scholar]
- 60.Gourevitch B, Eggermont JJ. Evaluating information transfer between auditory cortical neurons. J Neurophysiol. 2007;97:2533–2543. doi: 10.1152/jn.01106.2006. [DOI] [PubMed] [Google Scholar]
- 61.Marschinski R, Kantz H. Analysing the information flow between financial time series. An improved estimator for transfer entropy. Eur Phys J B. 2002;30:275–281. [Google Scholar]
- 62.Lu C, Mi LZ, Grey MJ, Zhu J, Graef E, Yokoyama S, Springer TA. Structural evidence for loose linkage between ligand binding and kinase activation in the epidermal growth factor receptor. Mol Cell Biol. 2010;30:5432–5443. doi: 10.1128/MCB.00742-10. [DOI] [PMC free article] [PubMed] [Google Scholar]
- 63.Zhang Z, Wriggers W. Polymorphism of the epidermal growth factor receptor extracellular ligand binding domain: the dimer interface depends on domain stabilization. Biochemistry. 2011;50:2144–2156. doi: 10.1021/bi101843s. [DOI] [PMC free article] [PubMed] [Google Scholar]


