

Abstract
In addition to motion perception per se, we utilize motion information for a wide range of brain functions. These varied functions place different demands on the visual system, and therefore a stimulus that provides useful information for one function may be inadequate for another. For example, the direction of motion of large high-contrast stimuli is difficult to discriminate perceptually, but other studies have shown that such stimuli are highly effective at eliciting directional oculomotor responses such as the ocular following response (OFR). Here, we investigated the degree of independence between perceptual and oculomotor processing by determining whether perceptually suppressed moving stimuli can nonetheless evoke reliable eye movements. We measured reflexively evoked tracking eye movements while observers discriminated the motion direction of large high-contrast stimuli. To quantify the discrimination ability of the oculomotor system, we used signal detection theory to generate associated oculometric functions. The results showed that oculomotor sensitivity to motion direction is not predicted by perceptual sensitivity to the same stimuli. In fact, in several cases oculomotor responses were more reliable than perceptual responses. Moreover, a trial-by-trial analysis indicated that, for stimuli tested in this study, oculomotor processing was statistically independent from perceptual processing. Evidently, perceptual and oculomotor responses reflect the activity of independent dissociable mechanisms despite operating on the same input. While results of this kind have traditionally been interpreted in the framework of perception versus action, we propose that these differences reflect a more general principle of modularity.
Keywords: motion perception, eye movements, spatial suppression, ocular following response
Introduction
Motion information is a central part of our visual experience. This is reflected in observers' high sensitivity to motion; under ideal circumstances, we can reliably discriminate motion stimuli that are displaced by only a few arc seconds (Nakayama & Silverman, 1985) or presented for a few milliseconds (Lappin, Tadin, Nyquist, & Corn, 2009). However, motion information is used for purposes other than motion perception per se (Nakayama, 1985). It can contribute to a wide range of brain functions, including the generation of tracking eye movements, altering hand movements, controlling posture, aiding in figure-ground segmentation, and calculating three-dimensional structure (Born, Groh, Zhao, & Lukasewycz, 2000; Bradley, Chang, & Andersen, 1998; Lisberger, Morris, & Tychsen, 1987; Nakayama, 1985; Saijo, Murakami, Nishida, & Gomi, 2005). These brain functions have widely varying requirements and goals, suggesting that associated neural mechanisms likely have varying sensitivities that are matched to specific demands of different motion processes (Gomi, Abekawa, & Shimojo, 2013). Therefore, a stimulus that generates a weak or unreliable perceptual sensation of motion may nonetheless be quite suitable for another brain function.
Here, we compared oculomotor and perceptual sensitivity to the direction of moving stimuli. We used the ocular following response (OFR), small reflexive eye movements that quickly follow the onset of rapid motion stimuli (Gellman, Carl, & Miles, 1990; Masson & Perrinet, 2012; Miles, Kawano, & Optican, 1986; Sheliga, FitzGibbon, & Miles, 2008) as an index of oculomotor processing of the stimuli. It is believed that the OFR supports the stabilization of the retinal image following unexpected motion onsets (Masson & Perrinet, 2012). Consistent with this idea, the OFR demonstrates pronounced spatial summation up to a diameter of about 20°–30° (Barthélemy, Vanzetta, & Masson, 2006), which likely serves to smooth out local velocity variations (Braddick, 1993). Importantly for our purposes, the OFR can be dissociated from motion perception. Work by Masson, Yang, and Miles (2002) and Sheliga, Chen, FitzGibbon, and Miles (2005, 2006) demonstrated that OFRs reliably reflect first-order motion energy content, even if the perceived motion direction differs from that specified by stimulus motion energy (Masson et al., 2002; Sheliga et al., 2005, 2006).
Many of the same stimulus characteristics that favor the generation of large OFRs (i.e., large size and high contrast) can lead to a degradation of observers' ability to discriminate motion. Specifically, as the size of a high-contrast moving stimulus increases, its motion becomes more difficult to discriminate (Tadin, Lappin, Gilroy, & Blake, 2003). This effect, termed spatial suppression, has been linked to center-surround interactions in cortical area MT (Churan, Richard, & Pack, 2009; Pack, Hunter, & Born, 2005; Tadin & Lappin, 2005b; Tadin, Silvanto, Pascual-Leone, & Battelli, 2011) and may support operations such as figure-ground segregation (Born et al., 2000; Tadin & Lappin, 2005a). Recent work demonstrated that spatial suppression preferentially impairs observers' ability to discriminate first-order motion information (Glasser & Tadin, 2011), the crucial cue that drives the OFR (Sheliga et al., 2005).
Previous studies have shown that observers' eye movements can be more sensitive to stimulus information than conscious perception. Tavassoli and Ringach (2010) showed that voluntary smooth pursuit of a moving target could more reliably track velocity perturbations than perception could. Similarly, even when perception is biased toward nonveridical motion directions, reflexive eye movements, like those studied here, accurately follow the physical motion direction (Spering & Carrasco, 2012; Spering, Pomplun, & Carrasco, 2011). In a finding seemingly analogous to blindsight, Rothkirch, Stein, Sekutowicz, and Sterzer (2012) showed that observers preferentially look at the location of a stimulus even when they are unaware it is being presented. In most of these studies, perception was biased and, in some cases, explicitly impaired through the use of adaptation, attention, higher level motion, or continuous flash suppression, leading to different perceptual and oculomotor outcomes. In this study, we presented a single moving stimulus and this stimulus was the only source of information for the perceptual and oculomotor systems.
Here, we exploit perceptual suppression as particularly useful experimental tool. Perceptual suppression can be used as a marker for visual processing stages. Namely, observers' ability (or inability) to use perceptually suppressed information for other tasks is informative about the relative organization of different mental processes (cf. Blake, Tadin, Sobel, Raissian, & Chong, 2006; Glasser, Tsui, Pack, & Tadin, 2011; He, Cavanagh, & Intriligator, 1996). To make the intuition explicit, if perceptually suppressed motion can still generate a reliable directional oculomotor response (as we predict), this would provide evidence that the oculomotor mechanisms can have access to information that is not available to perception. This would then indicate that oculomotor mechanisms involved in this task either precede the neural mechanisms underlying perceptual suppression and/or they occur in parallel.
To test these hypotheses, we measured observers' perceptual sensitivity to small and large high-contrast moving stimuli, while simultaneously recording the evoked tracking eye movements. Consistent with previous findings, our observers required longer stimulus durations to discriminate motion direction as the stimulus size increased. However, variations in perceptual sensitivity to motion direction did not predict the associated oculomotor responses. For small stimuli, observers' perception was consistently more reliable than their oculomotor responses. Increasing the stimulus size had opposite effects on perceptual and oculomotor sensitivity: Larger stimuli resulted in a strong degradation of observers' perceptual sensitivity but improved the discriminability of their oculomotor responses. Remarkably, in several cases, decoding motion direction from eye movements was more accurate than observers' perceptual judgments of the same stimuli. Both between- and within-subjects analyses revealed independence of oculomotor and perceptual responses, suggesting a limited interaction between two systems. Together, these results show that the tuning properties of the oculomotor and perceptual systems differ, that the oculomotor system can have access to perceptually suppressed motion information, and that oculomotor and perceptual responses reflect the activity of independent processes.
Experimental procedures
Stimuli were created in MATLAB with the Psychophysics Toolbox (Brainard, 1997) and Video Toolbox (Pelli, 1997) and shown on a customized digital light processing (DLP) projector (DepthQ WXGA 360 driven by a NVIDIA Quadro FX 4800 at 1280 × 720 resolution). The projector frame rate was 360 Hz, resulting in discrete 2.78-ms frames. DLP projectors are natively linear, and this was verified with a Minolta LS-110 photometer. Viewing was binocular at 135 cm, with each pixel subtending 2 arcmin of visual angle. The ambient illumination was 1.8 cd/m2 and a 0.6 neutral density filter (Kenko Tokina Co., Japan) was used to lower the background gray-level luminance to 113.7 cd/m2.
All stimuli were presented foveally. Stimulus size was defined as the radius of the raised cosine spatial envelope. Contrast was defined as the peak contrast within the spatial envelope. All stimuli were presented in a square-wave temporal envelope. Observers were stabilized in a bite bar and forehead rest to maximize eye-tracking accuracy. Four naïve but experienced psychophysical observers participated in the experiments. All experiments complied with institutionally reviewed procedures for human observers.
Eye tracking
Eye position was monitored with a desk-mounted Eyelink 1000 video eye tracker (SR Research) at 500 Hz. Recording was binocular, but only data from the observers' dominant eyes was analyzed. Data was analyzed offline. Raw eye position was smoothed with a cubic Savitzky-Golay filter over a 38 ms window. Trials with blinks and saccades (as identified by the default Eyelink algorithm) between 200 ms prior to stimulus onset and 300 ms after stimulus onset were excluded from analysis (2.7% of all trials).
Experiment 1
The aim of the first experiment was to compare oculomotor and perceptual sensitivity to large (r = 8°), high-contrast (99%) moving sinusoidal gratings (SF = 1 c/°, TF = 8 Hz). We also measured perceptual and oculomotor sensitivity to motion direction of small gratings (r = 1°, contrast = 99%, SF = 1 c/°, TF = 8 Hz) in three observers. This allowed us to estimate the strength of perceptual spatial suppression for each observer, defined by the difference in thresholds for large and small stimuli (Tadin et al., 2003). For all conditions, we used the method of constant stimuli to measure motion direction discrimination at 8–10 durations while monitoring eye position. At least 80 trials per duration, which varied between 50 and 200 ms for large stimuli, were collected. Thresholds were estimated from Weibull fits obtained using Palamedes (Prins & Kingdom, 2009).
At the beginning of each trial, a fixation ring (0.25° across) appeared. Once observers' eyes settled in a 1° × 1° window around the fixation spot for 200 ms, the fixation spot disappeared. After an additional 200 ms, the stimulus was shown. The screen remained gray until the observer indicated the perceived direction of motion by key press. Feedback was not provided. Observers were told the eye tracker was to monitor their fixation and that the stimuli would not play until they looked at the fixation cross. They were given no other instructions regarding their eye movements.
For each trial, the horizontal displacement of the eyes between the onset of the stimulus and 300 ms after onset was taken as the stimulus-induced eye movement (Figure 1). This relatively long window was chosen to improve the signal to noise ratio; because our stimuli were not optimized to elicit the strongest oculomotor response, the resultant eye movements were smaller than previously reported OFR magnitudes. Using such a late analysis window does raise a potential concern about eye movements altering the retinal stimulus, however the majority of stimuli were briefer than the OFR latency. This means that the stimulus was gone from the screen before the eyes began to move, precluding an interaction between OFR and the retinal stimulus. Additionally, a 300-ms time window is comparable to windows used in other eye-tracking studies (e.g., Spering, Pomplun, & Carrasco, 2011). Repeating the analysis using several shorter time windows did not qualitatively change the results reported below (i.e., we still found oculomotor advantage for short stimulus durations and statistical independence between oculomotor and perceptual responses).
Figure 1.
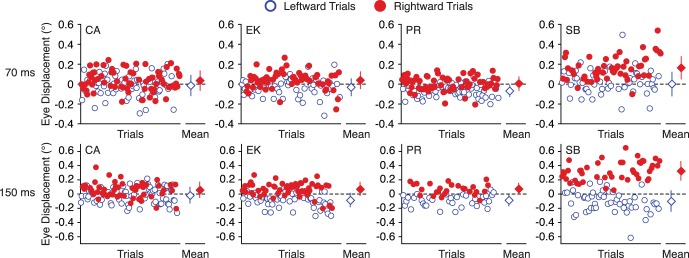
Trial-by-trial (circles) and mean (diamond) eye displacements in response to 70 ms and 150 ms of leftward (open blue) and rightward (filled red) motion of large (r = 8°) stimuli. While some observers show roughly balanced responses (CA and EK), others show leftward (PR) or rightward (SB) biases. Error bars represent standard deviation.
To convert these eye displacements into a measure of oculometric accuracy, we used receiver operating characteristic (ROC) analysis (Green & Swets, 1966) to measure the discriminability of eye movements elicited by leftward and rightward trials (Figure 2). ROC analysis is an ideal technique for measuring the discriminability of these evoked eye movements, because it effectively quantifies the difference between leftward and rightward trials and is insensitive to any asymmetries or biases in the elicited eye movements (e.g., Figure 2A). For each stimulus duration, the area under the ROC curve (aROC) was taken as the oculometric accuracy (Britten, Shadlen, Newsome, & Movshon, 1992; Glasser et al., 2011). The variability of this measurement was estimated using a resampling analysis of 2,500 random trial assignments.
Figure 2.
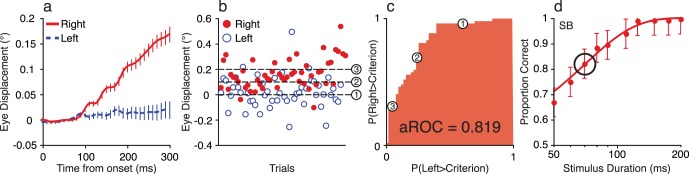
Computing the oculometric function from eye movement position. (A) Observer SB's average horizontal gaze position while she discriminated the direction of large high-contrast, moving gratings. Stimulus duration was 70 ms. Dashed blue and solid red curves show average eye position for leftwards and rightward moving stimuli, respectively. Error bars are SEM. (B) Eye displacements in the horizontal direction 300 ms after stimulus onset for individual trials. Rightward and leftward motions are shown by filled red and open blue symbols, respectively. Positive displacements represent rightward eye movements. (C) Signal detection theory was used to decode stimulus motion direction from eye position. ROC analysis compares the proportion of trials of each motion direction that exceed a criterion, for all possible values of the criterion. Three different criteria (marked 1–3) are shown in Panel B, and their corresponding locations on the ROC curve are marked in Panel C. The area under the ROC curve (aROC), an unbiased nonparametric measure of discriminability, was taken as the accuracy with which an ideal observer could discriminate stimulus direction from eye position recordings. (D) This analysis was repeated separately for each duration tested. The circle marks the duration shown in Panels A–C. Error bars (SD) were estimated by resampling.
A second oculometric analysis looked at the correspondence between perceptual and oculomotor choices on a trial-by-trial basis (Stone & Krauzlis, 2003). The proportion of trials where oculomotor and perceptual processes yield the same response is indicative of the degree to which they reflect common processing. Borrowing an analogy from Stone and Krauzlis (2003), if two observers report coin-flip results from two different coins, they would be expected to agree only 50% of the time. But if they were reading the same coin, they would agree 100% of the time.
We collapsed each eye movement into a categorical left/right judgment. For each observer and stimulus duration, we set the criterion such that the number of trials judged left equaled the number of trials that actually moved to the left. If the perceptual and oculomotor processes were completely independent of each other, the proportion of trials with the same responses would be given by:
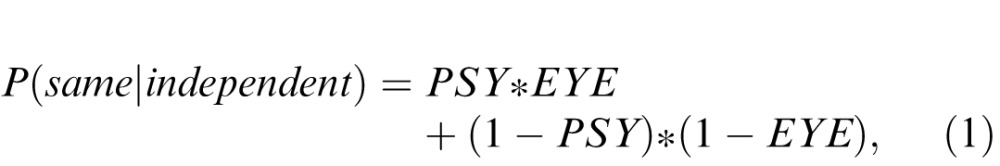 |
where PSY and EYE are the psychometric and oculometric accuracies for each duration and direction of motion (e.g., 70 ms of leftward motion). Expected overlap was then collapsed across directions to yield a single value for each duration. Shared noise between the processes would result in an increased proportion of trials judged the same by the perceptual and oculomotor systems and would be suggestive of shared neural substrates. The ceiling for the possible range depends on the difference between the two accuracies, and is given by:
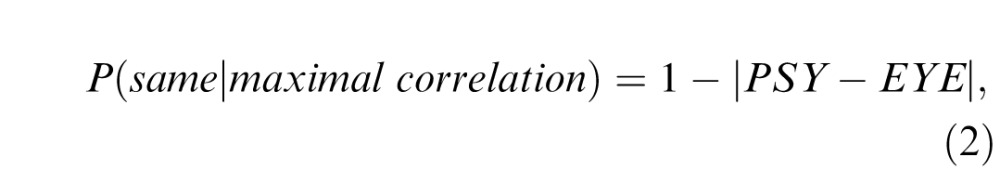 |
again computed separately for each duration and direction and then pooled across directions.
Experiment 2
The aim of the second experiment was to measure the OFR using a stimulus optimized to elicit large OFRs. This served as a control experiment, allowing us to compare the magnitude of observers' oculomotor responses to previously published reports, and further, to investigate observed differences in observers' oculomotor sensitivity in Experiment 1. The stimuli were large (r = 12°), high contrast (99%) moving sinusoidal gratings (SF = 0.25 c/°, TF = 10 Hz). We replicated a standard procedure for eliciting the OFR (Sheliga et al., 2005). Briefly, at the beginning of each trial, a stationary grating of random phase appeared with a fixation spot (0.25° across). After the subject fixated within a 1° × 1° window around the fixation spot for a randomized duration between 600 and 900 ms, the stimulus moved for 200 ms, then was replaced by the background color for a 500 ms inter-trial interval. The measure of OFR amplitude was the difference between rightward and leftward trials during a window 95–115 ms following stimulus onset (Barthélemy, Vanzetta, & Masson, 2006).
Results
Experiment 1
We compared the observers' ability to perceptually discriminate motion direction of small and large stimuli. All observers required considerably longer stimulus presentations to discriminate large than small moving stimuli (Figures 3 and 4). These results, revealing strong spatial suppression, are consistent with previous studies (Glasser & Tadin, 2011; Tadin et al., 2003). To compare perceptual and oculomotor processing of moving stimuli, we simultaneously recorded observers' eye gaze while they discriminated the motion direction of small (r = 1°, n = 3) and large (r = 8°, n = 4), high contrast (99%), moving gratings (SF = 1 c/°, TF = 8 Hz).
Figure 3.
A comparison of psychometric (open blue circles) and oculometric functions (filled red circles) for small (r = 1°) stimuli. The curves are maximum-likelihood Weibull fits. For all observers, perceptual accuracy was considerably higher than their oculometric accuracy. Psychometric error bars are binomial SD, while oculometric error bars (SD) were estimated by resampling.
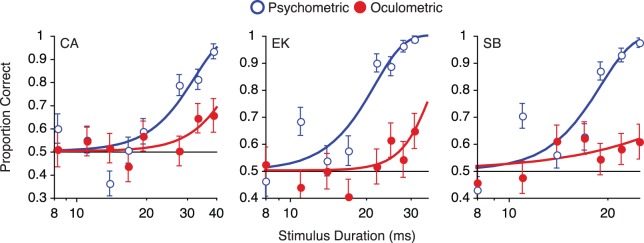
Figure 4.

Top row: A comparison of psychometric (open blue circles) and oculometric functions (filled red circles) for large (r = 8°) stimuli. The curves are maximum-likelihood Weibull fits. Note that one observer's oculometric accuracy is better than their psychometric accuracy across durations (SB), two show the effect at shorter durations (EK and PR), while one observer's perceptual judgments were always more reliable (CA). Psychometric error bars are binomial SD, while oculometric error bars (SD) were estimated by resampling. Bottom row: The difference between oculomotor and perceptual sensitivity for each duration. Error bars represent 95% confidence intervals.
To index how reliably the eye movements reflected the direction of stimulus motion, we used signal detection theory (Green & Swets, 1966) to compute an “oculometric” function (Kowler & McKee, 1987). ROC analysis is well suited to describe these data, because some observers show an asymmetry in their evoked eye movements (Figure 1). ROC analysis quantifies the discriminability between leftward and rightward trials and is therefore not sensitive to biases in the observers' data. We took the area under the ROC curve (aROC), a scalar nonparametric measure of discriminability, as the proportion of trials where an ideal observer could correctly discriminate the direction of the stimulus's motion from the evoked eye movements (Figure 2).
Observers' perceptual and oculomotor responses to small stimuli are shown in Figure 3. As expected from previous results, observers demonstrated high perceptual sensitivity (cf. Glasser & Tadin, 2011; Lappin et al., 2009), but the small elicited eye movements (cf. Barthélemy, Vanzetta, & Masson, 2006) could not be reliably discriminated. We considered the possibility that the low oculometric accuracy for small moving stimuli might be attributable to the short stimulus durations. To test this alternative explanation, we further probed one observer (EK) at much longer durations, between 100 and 200 ms. Even though these durations are almost an order of magnitude above her perceptual direction discrimination threshold, her oculometric accuracy never exceeded 75%. In summary, for small moving stimuli, observers' perceptual sensitivity far exceeded their oculomotor sensitivity.
For large stimuli, we found results opposite to those for small moving stimuli (Figure 4). Three of the four observers showed evidence of higher oculomotor than perceptual sensitivity. Subject SB demonstrated better oculometric accuracy than perceptual accuracy across the entire dynamic range of the oculometric function. Subjects EK and PR showed similar effects for brief stimuli, but this advantage disappeared at longer durations. Subject CA's oculometric accuracy lagged far behind his perceptual accuracy, never reaching 75% correct, which prevented recovery of a reliable oculometric threshold estimate (we will return to this individual variability in Experiment 2). It is important to note that these oculometric functions almost certainly underestimate the true oculomotor sensitivity to motion. For example, noise in eye position measurements would attenuate our measurements of oculomotor sensitivity without affecting perceptual estimates.
As observer EK was tested at an extended range of durations for both small and large stimuli, we can directly compare the size tuning of her perceptual and oculomotor sensitivity (Figure 5). While her perceptual sensitivity exceeds her oculomotor sensitivity for small stimuli, the relationship is reversed for large stimuli. Moreover, while increasing the stimulus size degrades her perceptual performance, it improves the discriminability of her eye movements (cf. Barthélemy, Vanzetta, & Masson, 2006; Tadin et al., 2003). While EK's low accuracy for small stimuli prevents us from reliably estimating her oculometric threshold, at the longest duration (200 ms), her oculometric accuracy for large stimuli far exceeded her accuracy for small stimuli (p < 0.0001, calculated from the binomial distribution). Together, these results provide further evidence for dissociability of occulomotor and perceptual processing of brief moving stimuli.
Figure 5.
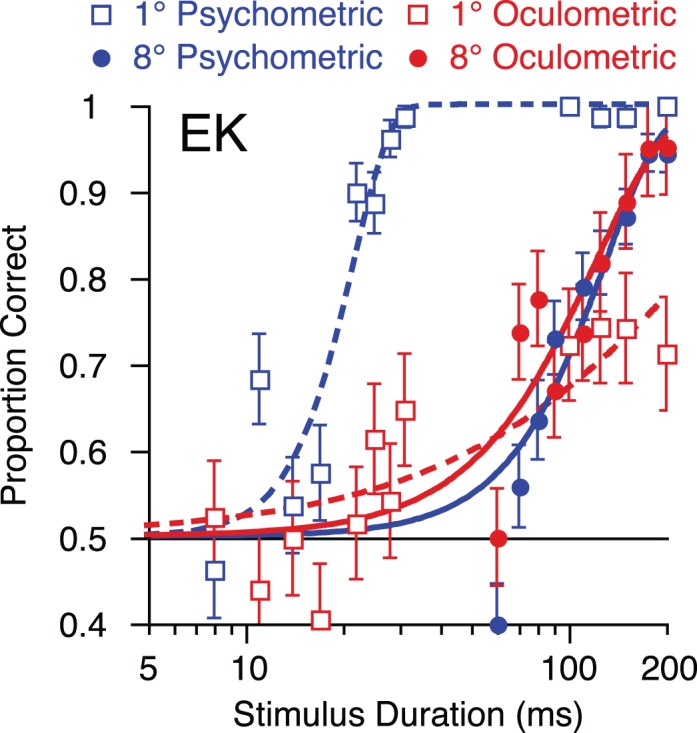
Dissociated oculomotor and perceptual processing for small and large moving stimuli across a large range of stimulus durations (observer EK). For small stimuli (open symbols, dashed lines), perceptual sensitivity (blue) is superior to oculomotor sensitivity (red); the relationship is reversed at large size (filled symbols, solid lines). Further, while perception is degraded with increasing size, oculomotor performance improves. The curves are Weibull fits, error bars on the psychometric functions (blue) represent binomial error and SD on the oculometric functions (solid red), as estimated by resampling.
Next, we compared perceptual and oculomotor judgments on a trial-by-trial basis. Looking at the correlation between these responses can reveal the presence of shared noise, which is indicative of the degree to which the two process share neural signals (Stone & Krauzlis, 2003). For example, consider a situation where an observer's oculomotor and perceptual accuracy were both 80%. If perception and the oculomotor response relied on the same underlying mechanisms, one would expect the same oculomotor and perceptual response on nearly every trial (e.g., both “leftward”). However, if the two measures reflected completely independent mechanisms, the response of one measure would not be predictive of the other's response, and therefore only 68% of trials would be expected to agree (Equation 1).
This analysis uses a criterion to reduce the eye movement for each trial into a binary direction decision (Stone & Krauzlis, 2003). We set the criterion such that the distribution of oculomotor decisions matched the distribution of trial directions (i.e., if 48/100 trials actually moved to the left, the 48 trials with the leftmost eye movements were judged left). Next, we computed the proportion of trials where the observer's eye movements and perception yielded the same decision (Figure 6), and compared the resultant values to two benchmarks. The first benchmark represents the proportion of response overlap that is expected if perceptual and oculomotor responses were completely independent (Equation 1; dashed line in Figure 6). The second benchmark represents response overlap expected if perceptual and oculomotor responses were derived from shared mechanisms (Equation 2; solid line in Figure 6). The results closely track the independent mechanisms benchmark. Only one duration out of 37 (70 ms for observer EK) did not include the independent mechanisms benchmark within the 95% confidence interval. In other words, this analysis indicates dissociated processing of perceptual and oculomotor signals.
Figure 6.
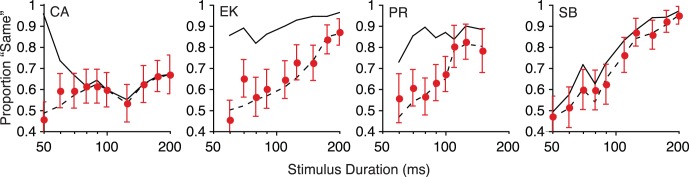
Correspondence between perceptual and oculomotor direction judgments. The solid line indicates the proportion of trials that would agree if the oculomotor and perceptual system were as correlated as possible, given their respective accuracies. The dashed line indicates the expected proportion of trials where perceptual and oculomotor decisions would agree if the two processes were completely independent. The error bars indicate binomial 95% confidence intervals.
To ensure that the obtained result is not dependent on this specific criterion, we repeated the analysis for every possible criterion (i.e., every trial is left, all but one trial is left, …, every trial is right). For each criterion, we calculated the independent and maximum correlation bounds, the proportion of trials giving the same response, and checked to see whether the 95% confidence interval (CI) around this value contained the independent bound. As the oculomotor criteria get more extreme (e.g., 90% of trials classified as right), the closer the two bounds come together, leading to many comparisons that overlap both bounds. Nonetheless, out of 4,089 comparisons, only 2.3% did not include the independent bound in the 95% CI. Roughly a third of these comparisons are from EK's 70 ms duration. In sum, this additional analysis shows that the independence result (Figure 6) holds regardless of the criterion used.
Experiment 2
In the second experiment, we further investigated the individual differences in oculomotor sensitivity measured in Experiment 1. As we found that perceptual sensitivity did not predict oculomotor performance, we hypothesized that individual differences in oculomotor sensitivity may simply reflect differences in typical OFR magnitude across observers. For example, poor oculomotor sensitivity for observer CA (Figure 4) may be due to a generally weak OFR for that particular individual. Here, we measured the OFR using a stimulus chosen to elicit large eye movements, while keeping the procedure as close as was reasonable to the one used in Experiment 1 (see Experimental procedures). The evoked OFRs are shown in Figure 7A. To compute a measure of eye movement directionality, we simply subtracted eye position measured in trials with leftward motion from trials with rightward motion. Additionally, we focused on a time window between 95 and 115 ms that is comparable to time windows used in previous OFR studies (Barthélemy, Vanzetta, & Masson, 2006). The resultant OFRs are (Figure 7A), on average, comparable to values previously reported using a scleral search coil (Sheliga et al., 2005). All observers generated reliable OFRs, though the smallest (observer CA) was only half the size of the largest (observer SB). We then compared the magnitude of the evoked OFRs to the oculometric thresholds measured in Experiment 1. We found that increased OFR magnitude (Figure 7B), and not the observers' perceptual sensitivity (Figure 7C), was associated with better oculomotor sensitivity. For example, observer CA, who had by far the best perceptual sensitivity in Experiment 1, had the worst oculometric accuracy in Experiment 1, as well as the smallest OFR. These results are also support our assumption that the eye movements measured in Experiment 1 reflect the same mechanisms as the conventionally measured OFR.
Figure 7.
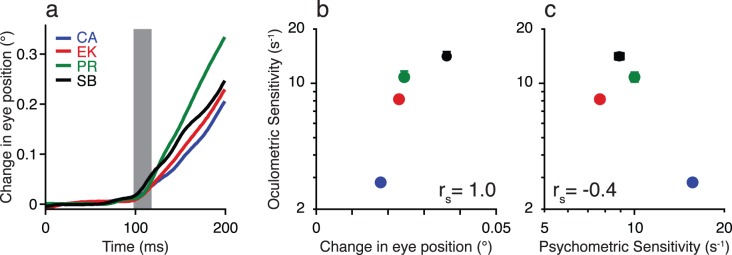
The ocular following response (OFR) and its relationship to oculomotor sensitivity. (A) Eye displacement over time, rightward trial average minus leftward trial average. (B) The relationship between OFR magnitude in Experiment 2 and oculometric sensitivity (1/threshold in seconds) in Experiment 1. Larger OFR (as measured by the change in eye position 95–115 ms after stimulus onset) was associated with higher oculometric sensitivity. (C) The relationship between psychometric and oculometric sensitivity (1/threshold in seconds) in Experiment 1. Error bars in B and C are standard errors of the thresholds estimated by bootstrapping.
Discussion
We compared observers' ability to discriminate the direction of high-contrast moving gratings with the discriminability of reflexively evoked eye movements. The results revealed that the reliability of eye movements was not constrained by observers' conscious percepts; subjects with better perceptual sensitivity do not necessarily show better oculomotor sensitivity and vice versa. Further, we demonstrate that the oculomotor system can at times reliably discriminate moving stimuli that do not generate discriminable perceptual experiences. Notably, this result was obtained without explicitly asking observers to follow the moving stimulus; observers were simply instructed to fixate the moving stimuli.
Our measures of perceptual and oculomotor sensitivity show markedly different size tuning as well. For small stimuli, observers' percepts were much more reliable than their oculomotor responses. However, as the stimulus size increased, perceptual performance deteriorated (demonstrating spatial suppression), while oculomotor performance improved (demonstrating spatial summation). It should be noted that our results do not preclude oculomotor spatial suppression for even larger sizes. Indeed, for stimuli in the 30°–45° range, OFRs reliably exhibit surround suppression (Barthélemy, Vanzetta, & Masson, 2006). Instead, our results indicate that for stimuli that exhibit strong perceptual suppression, OFRs show the opposite spatial tuning—a result supporting our main hypothesis of dissociable perceptual and oculomotor processing of moving stimuli.
One caveat that complicates the interpretation of our oculomotor size tuning data is the uneven effect of measurement noise on the recovered oculometric functions. Others and we have demonstrated that small stimuli elicit smaller eye movements than larger stimuli, at least over the range of sizes tested here. As a result, the signal-to-noise ratio for eye movements elicited by small stimuli is lower than for large stimuli. This means that while all of our oculometric functions underestimate our observers' oculomotor sensitivity, this is likely more of an issue for small stimuli. Determining which portion of the observed variability can be attributed to the oculomotor system versus to the measurement is difficult, and may ultimately require replication with a different technology (e.g., search coils). However, it seems unlikely that more precise measurements would alter our overall findings.
Another striking feature of the results reported here is the high degree of subject-to-subject variability in both psychometric and oculometric sensitivity. A number of factors have been previously shown to affect psychophysical spatial suppression, including age (Betts, Taylor, Sekuler, & Bennett, 2005), disorders like schizophrenia, depression, and migraine (Battista, Badcock, & McKendrick, 2010; Golomb et al., 2009; Tadin et al., 2006), autism (Foss-Feig, Tadin, Schauder, & Cascio, 2013), and even intelligence (Melnick, Harrison, Park, Bennetto, & Tadin, 2013). Similarly, a great deal of subject-to-subject variability in the overall magnitude of the OFR has been previously reported (Gellman, Carl, & Miles, 1990; Masson & Perrinet, 2012). Here, that variability was reflected in a separate measure of observers' oculomotor sensitivity. The key finding is that psychometric and oculometric judgments do not covary more often than would be expected by chance. This suggests that the two processes operate relatively independently, despite taking the same stimulus as input.
Neural substrates
These findings may seem surprising given evidence that suggests motion perception and pursuit eye movements share common anatomical substrates. Converging evidence from neurophysiology (Pack, Hunter, & Born, 2005), TMS (Tadin et al., 2011), and tDCS (Agosta et al., in review) have implicated cortical area MT in psychophysical spatial suppression. Areas MT and MST have also been connected to pursuit eye movements (Lisberger & Movshon, 1999; Newsome, Wurtz, Dursteler, & Mikami, 1985), and to the OFR specifically (Kawano, Shidara, Watanabe, & Yamane, 1994). One explanation for this apparent discrepancy is that the signals giving rise to perception and reflexive ocular following may be carried by different populations of neurons within the same areas.
Roughly half of neurons in area MT demonstrates center-surround receptive field organization, while the other half (so-called “wide-field” neurons) integrates information across a wider region of space (Born & Tootell, 1992; Churan, Khawaja, Tsui, & Pack, 2008). If the oculomotor system is primarily driven by wide-field neurons and motion perception mostly relies on surround-suppressed neurons, it would match previously reported spatial tuning and contrast dependencies (Barthélemy, Vanzetta, & Masson, 2006; Tadin et al., 2003). OFR can also exhibit surround suppression, but it occurs only for very large stimuli (greater than 20°–40° across; Barthélemy, Vanzetta, & Masson, 2006; Miles, Kawano, & Optican, 1986). Such an arrangement would also be entirely consistent with the pattern of results observed here.
Another attractive possibility is that the advantage seen here for oculomotor responses may reflect activity in the retino-tectal pathway (Spering & Carrasco, 2012; Spering, Pomplun, & Carrasco, 2011). While conscious perception largely relies on the geniculo-striate pathway, the retino-tectal pathway has been associated with the processing of stimuli that are not consciously perceived (Huxlin et al., 2009; Tamietto et al., 2010). Processing of (perceptually) weak motion signals by a parallel pathway is consistent with both the observed tuning differences, as well as the relative independence of perceptual and oculomotor decisions.
Perception versus action?
This finding joins a growing body of evidence showing that oculomotor responses need not be limited by nor bound to perception (e.g., Sheliga et al., 2005, 2006; Spering, Pomplun, & Carrasco, 2011; Tavassoli & Ringach, 2010). Additionally, a similar dissociation has been demonstrated between the processing of motion for the purposes of perception and smooth pursuit eye movements. While both processes must initially rely on the same motion-sensitive mechanisms, subsequent motion processing and readout for perception and pursuit can be dissociated (e.g., Churchland et al., 2003; Priebe & Lisberger, 2004).
There are also several studies utilizing different stimuli and metrics, which nonetheless arrive at conclusions quite similar to those reported here. Gegenfurtner, Xing, Scott, & Hawken (2003) simultaneously measured observers' perceptual and oculomotor judgments of speed perturbations. Even though they found similar perceptual and oculomotor sensitivity, they observed no correlation between oculomotor and perceptual errors, suggesting that the two behaviors reflect independent processing. Simoncini, Perrinet, Montagnini, Mamassian, and Masson (2012) found a dissociation between perceptual and oculomotor ability to integrate the motion of a novel stimulus that contains information across a range of spatial scales. Evidently, the oculomotor system is able to make use of information distributed across spatial scales while the perceptual system is not. Differential integration by the oculomotor and perceptual systems, albeit across space rather than spatial frequency, is our central finding as well.
Such differences between perceptual and oculomotor processing have traditionally been considered in the framework of dissociation between perception and action (Goodale & Milner, 1992). While such a distinction has undoubtedly been successful in explaining a range of findings in behavior, neuropsychology, and physiology, these data are also consistent with a more general strategy of modularity (Marr, 1982).
Breaking down large, complicated computations into smaller independent processes makes a (potentially obvious) prediction. That is, the sensitivity of a given process can (and should) be matched to both the information it uses and to its computational goals, regardless of whether it is for the purpose of perception or action. For example, observers use motion information for a wide variety of perceptual tasks, including perceiving the motion of objects, figure-ground segmentation, computing 3-D structure, and monitoring self-motion (Nakayama, 1985). While these processes operate on the same physical input, the types and scales of information that are important for each process clearly vary, and so do observers' sensitivity to them. By this logic, comparing the tuning of these different perceptual processes may also help clarify their computational goals and functional roles (Glasser & Tadin, 2011).
In this particular case, the observed differences in tuning and limited overlap of perceptual and oculomotor responses might be anticipated from differences in the two processes. We and others have suggested that psychophysical spatial suppression may be crucial for figure-ground segmentation (Born et al, 2000; Tadin & Lappin, 2005a). Consistent with this idea, observers are maximally sensitive to small, high-contrast (object-like) stimuli, and their sensitivity drops off as size increases (becoming more background like). Conversely, OFR has been proposed to be a way to stabilize the retinal image of stationary objects following unexpected motion (Masson & Perrinet, 2012; Miles, Kawano, & Optican, 1986), which benefits from integration across a large area to generate an accurate estimate of global motion (Braddick, 1993). It is these differences in priorities and computation, more than a perception versus action distinction, which may be a useful way to conceptualize the results.
Conclusion
We have demonstrated that oculomotor and perceptual sensitivity to the same moving stimuli can be dissociated. Using stimulus parameters that elicit both a reliable oculomotor response and psychophysical spatial suppression, we compared observers' psychometric and oculometric functions. Individual variability in both the strength of perceptual suppression and the reliability of the oculomotor response caused some observers to demonstrate higher sensitivity in their oculometric judgments than their perceptual judgments at brief durations, and this relationship varied with stimulus size. Further analysis indicated that perceptual and oculomotor responses agreed no more often than would be expected if they were independent processes. This suggests that the mechanisms underlying behavioral spatial suppression lie either subsequent to or (more likely) in parallel to those underlying reflexive ocular following.
Acknowledgments
This work was supported by NIH NEI Awards R01 EY019295 (to D. T.), P30 EY001319, and T32 EY007125.
Commercial relationships: none.
Corresponding author: Davis M. Glasser.
Email: davis.glasser@nyu.edu.
Address: Center for Neural Science & Department of Psychology, New York University, New York, NY, USA.
Contributor Information
Davis M. Glasser, Email: davis.glasser@nyu.edu.
Duje Tadin, Email: duje@cvs.rochester.edu.
References
- Agosta S., Tadin D., Miranda P. C., Salvador R., Ruffini G., Pascual-Leone A., Battelli L. (in review). Dissociating mechanisms of spatial suppression and summation in human extrastriate cortex. [Google Scholar]
- Barthélemy F. V., Vanzetta I., Masson G. S. (2006). Behavioral receptive field for ocular following in humans: Dynamics of spatial summation and center-surround interactions. Journal of Neurophysiology , 95 (6), 3712–3726 [DOI] [PubMed] [Google Scholar]
- Battista J., Badcock D. R., McKendrick A. M. (2010). Center-surround visual motion processing in migraine. Investigative Ophthalmology & Visual Science , 51 (11), 6070–6076, http://www.iovs.org/content/51/11/6070. [PubMed] [Article] [DOI] [PubMed] [Google Scholar]
- Betts L. R., Taylor C. P., Sekuler A. B., Bennett P. J. (2005). Aging reduces center-surround antagonism in visual motion processing. Neuron , 45 (3), 361–366 [DOI] [PubMed] [Google Scholar]
- Blake R., Tadin D., Sobel K. V., Raissian T. A., Chong S. C. (2006). Strength of early visual adaptation depends on visual awareness. Proceedings of the Royal Society B: Biological , 103 (12), 4783–4788 [DOI] [PMC free article] [PubMed] [Google Scholar]
- Born R. T., Groh J. M., Zhao R., Lukasewycz S. J. (2000). Segregation of object and background motion in visual area MT: Effects of microstimulation on eye movements. Neuron , 26 (3), 725–734 [DOI] [PubMed] [Google Scholar]
- Born R. T., Tootell R. B. H. (1992). Segregation of global and local motion processing in primate middle temporal visual area. Nature , 357 (6378), 497–499 [DOI] [PubMed] [Google Scholar]
- Braddick O. (1993). Segmentation versus integration in visual motion processing. Trends in Neurosciences , 16 (7), 263–268 [DOI] [PubMed] [Google Scholar]
- Bradley D. C., Chang G. C., Andersen R. A. (1998). Encoding of three-dimensional structure-from-motion by primate area MT neurons. Nature , 392 (6677), 714–717 [DOI] [PubMed] [Google Scholar]
- Brainard D. H. (1997). The Psychophysics Toolbox. Spatial Vision , 10 (4), 433–436 [PubMed] [Google Scholar]
- Britten K. H., Shadlen M. N., Newsome W. T., Movshon J. A. (1992). The analysis of visual motion: A comparison of neuronal and psychophysical performance. The Journal of Neuroscience , 12 (12), 4745–4765 [DOI] [PMC free article] [PubMed] [Google Scholar]
- Churan J., Khawaja F. A., Tsui J. M. G., Pack C. C. (2008). Brief motion stimuli preferentially activate surround-suppressed neurons in macaque visual area MT. Current Biology , 18 (22), R1051–R1052 [DOI] [PubMed] [Google Scholar]
- Churan J., Richard A. G., Pack C. C. (2009). Interaction of spatial and temporal factors in psychophysical estimates of surround suppression. Journal of Vision , 9 (4): 28 1–15, http://www.journalofvision.org/content/9/4/15, doi:10.1167/9.4.15. [PubMed] [Article] [DOI] [PubMed] [Google Scholar]
- Churchland A. K., Gardner J. L., Chou I. H., Priebe N. J., Lisberger S. G. (2003). Directional anisotropies reveal a functional segregation of visual motion processing for perception and action. Neuron , 37 (6), 1001–1011 [DOI] [PubMed] [Google Scholar]
- Foss-Feig J. H., Tadin D., Schauder K. B., Cascio C. J. (2013). A substantial and unexpected enhancement of motion perception in autism. Journal of Neuroscience , 33 (19), 8243–8249 [DOI] [PMC free article] [PubMed] [Google Scholar]
- Gegenfurtner K. R., Xing D., Scott B. H., Hawken M. J. (2003). A comparison of pursuit eye movement and perceptual performance in speed discrimination. Journal of Vision , 3 (11): 28 865–876, http://www.journalofvision.org/content/3/11/19, doi:10.1167/3.11.19. [PubMed] [Article] [DOI] [PubMed] [Google Scholar]
- Gellman R. S., Carl J. R., Miles F. A. (1990). Short latency ocular-following responses in man. Visual Neuroscience , 5 (2), 107–122 [DOI] [PubMed] [Google Scholar]
- Glasser D. M., Tadin D. (2011). Increasing stimulus size impairs first- but not second-order motion perception. Journal of Vision , 11 (13): 28 1–8, http://www.journalofvision.org/content/11/13/22, doi:10.1167/11.13.22. [PubMed] [Article] [DOI] [PMC free article] [PubMed] [Google Scholar]
- Glasser D. M., Tsui J. M. G., Pack C. C., Tadin D. (2011). Perceptual and neural consequences of rapid motion adaptation. Proceedings of the National Academy of Sciences, USA , 108 (45), E1080–E1088 [DOI] [PMC free article] [PubMed] [Google Scholar]
- Golomb J. D., McDavitt J. R. B., Ruf B. M., Chen J. I., Saricicek A., Maloney K. H., Bhagwagar Z. (2009). Enhanced visual motion perception in major depressive disorder. Journal of Neuroscience , 29 (28), 9072–9077 [DOI] [PMC free article] [PubMed] [Google Scholar]
- Gomi H., Abekawa N., Shimojo S. (2013). The hand sees visual periphery better than the eye: Motor-dependent visual motion analyses. Journal of Neuroscience , 33 (42), 16502–16509 [DOI] [PMC free article] [PubMed] [Google Scholar]
- Goodale M. A., Milner A. D. (1992). Separate visual pathways for perception and action. Trends in Neurosciences , 15 (1), 20–25 [DOI] [PubMed] [Google Scholar]
- Green D. M., Swets J. A. (1966). Signal detection theory and psychophysics. New York: John Wiley and Sons; [Google Scholar]
- He S., Cavanagh P., Intriligator J. (1996). Attentional resolution and the locus of visual awareness. Nature , 383 (6598), 334–337 [DOI] [PubMed] [Google Scholar]
- Huxlin K. R., Martin T., Kelly K., Riley M., Friedman D. I., Burgin W. S., Hayhoe M. (2009). Perceptual relearning of complex visual motion after V1 damage in humans. Journal of Neuroscience , 29 (13), 3981–3991 [DOI] [PMC free article] [PubMed] [Google Scholar]
- Kawano K., Shidara M., Watanabe Y., Yamane S. (1994). Neural activity in cortical area MST of alert monkey during ocular following responses. Journal of Neurophysiology , 71 (6), 2305–2324 [DOI] [PubMed] [Google Scholar]
- Kowler E., McKee S. P. (1987). Sensitivity of smooth eye movement to small differences in target velocity. Vision Research , 27 (6), 993–1015 [DOI] [PubMed] [Google Scholar]
- Lappin J. S., Tadin D., Nyquist J. B., Corn A. L. (2009). Spatial and temporal limits of motion perception across variations in speed, eccentricity, and low vision. Journal of Vision , 9 (1): 28 1–14, http://www.journalofvision.org/content/9/1/30, doi:10.1167/9.1.30. [PubMed] [Article] [DOI] [PubMed] [Google Scholar]
- Lisberger S. G., Morris E. J., Tychsen L. (1987). Visual motion processing and sensory-motor integration for smooth pursuit eye movements. Annual Review of Neuroscience , 10, 97–129 [DOI] [PubMed] [Google Scholar]
- Lisberger S. G., Movshon J. A. (1999). Visual motion analysis for pursuit eye movements in area MT of macaque monkeys. Journal of Neuroscience , 19 (6), 2224–2246 [DOI] [PMC free article] [PubMed] [Google Scholar]
- Marr D. (1982). Vision. San Francisco: W. H. Freeman; [Google Scholar]
- Masson G. S., Perrinet L. U. (2012). The behavioral receptive field underlying motion integration for primate tracking eye movements. Neuroscience and Biobehavioral Reviews , 36 (1), 1–25 [DOI] [PubMed] [Google Scholar]
- Masson G. S., Yang D.-S., Miles F. A. (2002). Reversed short-latency ocular following. Vision Research , 42 (17), 2081–2087 [DOI] [PMC free article] [PubMed] [Google Scholar]
- Melnick M. D., Harrison B. R., Park S., Bennetto L., Tadin D. (2013). A strong interactive link between sensory discriminations and intelligence. Current Biology , 23 (11), 1013–1017 [DOI] [PMC free article] [PubMed] [Google Scholar]
- Miles F. A., Kawano K., Optican L. M. (1986). Short-latency ocular following responses of monkey. I. Dependence on temporospatial properties of visual input. Journal of Neurophysiology , 56 (5), 1321–1354 [DOI] [PubMed] [Google Scholar]
- Nakayama K. (1985). Biological image motion processing: A review. Vision Research , 25 (5), 625–660 [DOI] [PubMed] [Google Scholar]
- Nakayama K., Silverman G. H. (1985). Detection and discrimination of sinusoidal grating displacements. Journal of the Optical Society of America A , 2 (2), 267–274 [DOI] [PubMed] [Google Scholar]
- Newsome W. T., Wurtz R. H., Dursteler M. R., Mikami A. (1985). Deficits in visual motion processing following ibotenic acid lesions of the middle temporal visual area of the macaque monkey. Journal of Neuroscience , 5 (3), 825–840 [DOI] [PMC free article] [PubMed] [Google Scholar]
- Pack C. C., Hunter J. N., Born R. T. (2005). Contrast dependence of suppressive influences in cortical area MT of alert macaque. Journal of Neurophysiology , 93 (3), 1809–1815 [DOI] [PubMed] [Google Scholar]
- Pelli D. G. (1997). The VideoToolbox software for visual psychophysics: Transforming numbers into movies. Spatial Vision , 10 (4), 437–442 [PubMed] [Google Scholar]
- Priebe N. J., Lisberger S. G. (2004). Estimating target speed from the population response in visual area MT. Journal of Neuroscience , 24 (8), 1907–1916 [DOI] [PMC free article] [PubMed] [Google Scholar]
- Prins N., Kingdom F. A. A. (2009). Palamedes: Matlab routines for analyzing psychophysical data. Retrieved from http://www.palamedestoolbox.org [Google Scholar]
- Rothkirch M., Stein T., Sekutowicz M., Sterzer P. (2012). A direct oculomotor correlate of unconscious visual processing. Current Biology, 2 (13), R514–R515 [DOI] [PubMed] [Google Scholar]
- Saijo N., Murakami I., Nishida S., Gomi H. (2005). Large-field visual motion directly induces an involuntary rapid manual following response. Journal of Neuroscience , 25 (20), 4941–4951 [DOI] [PMC free article] [PubMed] [Google Scholar]
- Sheliga B. M., Chen K. J., FitzGibbon E. J., Miles F. A. (2005). Initial ocular following in humans: A response to first-order motion energy. Vision Research , 45 (25-26), 3307–3321 [DOI] [PMC free article] [PubMed] [Google Scholar]
- Sheliga B. M., Chen K. J., FitzGibbon E. J., Miles F. A. (2006). The initial ocular following responses elicited by apparent-motion stimuli: Reversal by inter-stimulus intervals. Vision Research , 46 (6-7), 979–992 [DOI] [PMC free article] [PubMed] [Google Scholar]
- Sheliga B. M., FitzGibbon E. J., Miles F. A. (2008). Spatial summation properties of the human ocular following response (OFR): Evidence for nonlinearities due to local and global inhibitory interactions. Vision Research , 48 (17), 1758 [DOI] [PMC free article] [PubMed] [Google Scholar]
- Simoncini C., Perrinet L. U., Montagnini A., Mamassian P., Masson G. S. (2012). More is not always better: Adaptive gain control explains dissociation between perception and action. Nature Neuroscience , 15 (11), 1596–1603 [DOI] [PubMed] [Google Scholar]
- Spering M., Carrasco M. (2012). Similar effects of feature-based attention on motion perception and pursuit eye movements at different levels of awareness. Journal of Neuroscience , 32 (22), 7594–7601 [DOI] [PMC free article] [PubMed] [Google Scholar]
- Spering M., Pomplun M., Carrasco M. (2011). Tracking without perceiving: A dissociation between eye movements and motion perception. Psychological Science , 22 (2), 216–225 [DOI] [PMC free article] [PubMed] [Google Scholar]
- Stone L. S., Krauzlis R. J. (2003). Shared motion signals for human perceptual decisions and oculomotor actions. Journal of Vision , 3 (11): 28 725–736, http://www.journalofvision.org/content/3/11/7, doi:10.1167/3.11.7. [PubMed] [Article] [DOI] [PubMed] [Google Scholar]
- Tadin D., Kim J., Doop M. L., Gibson C., Lappin J. S., Blake R., Park S. (2006). Weakened center-surround interactions in visual motion processing in schizophrenia. Journal of Neuroscience , 26 (44), 11403–11412 [DOI] [PMC free article] [PubMed] [Google Scholar]
- Tadin D., Lappin J. S. (2005a). Linking psychophysics and physiology of center-surround interactions in visual motion processing. In Jenkin M. R. M., Harris L. R. (Eds.), Seeing spatial form (pp 279–314) Oxford UK: Oxford University Press; [Google Scholar]
- Tadin D., Lappin J. S. (2005b). Optimal size for perceiving motion decreases with contrast. Vision Research , 45 (16), 2059–2064 [DOI] [PubMed] [Google Scholar]
- Tadin D., Lappin J. S., Gilroy L. A., Blake R. (2003). Perceptual consequences of centre-surround antagonism in visual motion processing. Nature , 424 (6946), 312–315 [DOI] [PubMed] [Google Scholar]
- Tadin D., Silvanto J., Pascual-Leone A., Battelli L. (2011). Improved motion perception and impaired spatial suppression following disruption of cortical area MT/V5. Journal of Neuroscience , 31 (4), 1279–1283 [DOI] [PMC free article] [PubMed] [Google Scholar]
- Tamietto M., Cauda F., Corazzini L. L., Savazzi S., Marzi C. A., Goebel R., De Gelder B. (2010). Collicular vision guides nonconscious behavior. Journal of Cognitive Neuroscience , 22 (5), 888–902 [DOI] [PubMed] [Google Scholar]
- Tavassoli A., Ringach D. L. (2010). When your eyes see more than you do. Current Biology , 20 (3), R93–R94 [DOI] [PMC free article] [PubMed] [Google Scholar]