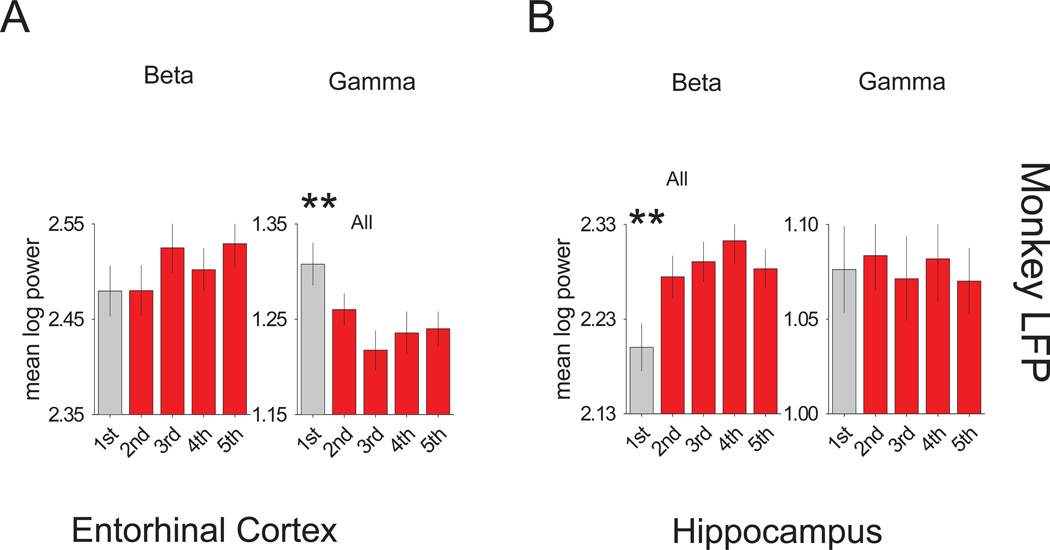
Figure 3. Immediate novelty signals of the monkey LFP.
Individual bar graphs depict the fixation task comparisons between first (grey) versus the second, third, fourth and fifth (red) trials (± SEM of the differences). (A) Results for the monkey entorhinal LFP signal analyses showing the mean log power for the beta (left) and gamma (right) bandwidth spectra. (B) Results for the monkey hippocampal LFP signal analyses showing the mean log power for the beta (left) and gamma (right) bandwidth spectra. *** = p <0.005 and ** = p <0.01. See also Figure S2–6.

