Abstract
Transformation of osteoblasts into osteocytes is marked by changes in volume and cell shape. The reduction of volume and the entrapment process are correlated with the synthesis activity of the cell which decreases consequently. This transformation process has been extensively investigated by transmission electron microscopy (TEM) but no data have yet been published regarding osteoblast-osteocyte dynamic histomorphometry. Scanning electron microscope (SEM) densitometric analysis was carried out to determine the osteoblast and open osteocyte lacunae density in corresponding areas of a rabbit femur endosteal surface. The lining cell density was 4900.1 ± 30.03 n mm−2, the one of open osteocyte lacunae 72.89 ± 22.55 n mm−2. This corresponds to an index of entrapment of one cell every 67.23 osteoblasts (approximated by defect). The entrapment sequence begins with flattening of the osteoblast and spreading of equatorial processes. At first these are covered by the new apposed matrix and then also the whole cellular body of the osteocyte undergoing entrapment. The dorsal aspect of the cell membrane suggests that closure of the osteocyte lacuna may be partially carried out by the same osteoblast-osteocyte which developed a dorsal secretory territory. A significant proportion of the endosteal surface was analysed by SEM, without observing any evidence of osteoblast mitotic figures. This indicates that recruitment of the pool of osteogenic cells in cortical bone lamellar systems occurs prior to the entrapment process. No further additions occurred once osteoblasts were positioned on the bone surface and began lamellar apposition. The number of active osteoblasts on the endosteal surface exceeded that of the cells which become incorporated as osteocytes (whose number was indicated by the number of osteocyte lacunae). Therefore such a balance must be equilibrated by the osteoblasts' transformation in resting lining cells or by apoptosis. The current work characterised osteoblast shape changes throughout the entrapment process, allowing approximate calculation of an osteoblast entrapment index in the rabbit endosteal cortex.
Keywords: osteoblast, osteocyte, osteocyte entrapment
Introduction
As bone apposition progresses in growing bones, osteoblasts transform into osteocytes on the external periosteal surface, inside the cortical cutting cones and on the endosteal surface of long bones (Ham, 1957; Cooper et al. 1966; Baud, 1968). Reduction in cell volume, and ergastoplasmic reticulum, as well as osteoblast secretory territory adaptation, has been documented in osteons by TEM (Marotti et al. 1976; Palumbo et al. 1990). The secretory territory extension was previously determined for parietal bones of rats by Jones (1974) using SEM and a cell microdissection technique with a tungsten needle. The entrapment model developed by Marotti et al. (1992) suggested that transformation from osteoblast to osteocyte was initiated by decreased cell synthesis activity. However, so far no quantitative data have been described regarding the density of osteoblasts that line growing bone surfaces or the fraction of such cells undergoing transformation into osteocyte. Whether the entrapment model applies to all sites of bone apposition has not yet been investigated. However, the bone apposition rate has been extensively investigated using fluorescent markers (Lee et al. 1965; Manson & Waters, 1965; Villanueva & Frost, 1970; Martin, 1994; Parfitt, 1994), revealing a link between the lamellar architecture of collagen in secondary osteons and the number and position of osteogenic cells (Ascenzi & Bonucci, 1968; Reid, 1986; Giraud-Guille, 1988; Kerschnitzki et al. 2011; Pazzaglia et al. 2011), as well as in the endosteal and the periosteal lamellar systems. As such the entrapment process plays a key role in the structural organisation of bone matrix, and osteocyte lacunae topography is determined based on the final position of osteoblasts that have been embedded into the matrix (Pazzaglia et al. 2010).
This SEM study analysed the dynamic histomorphometry of osteoblast-osteocyte transformation in an easy, accessible system, the endosteal surface of the distal femur of a rabbit. Specifically, densitometric analysis of the sheet of osteoblasts was performed and the proportion of cells undergoing entrapment was evaluated. This provides further insight into the entrapment process, which has not been previously described in earlier studies using TEM.
The aim of the present study was to classify and quantify changes in osteoblast shape throughout the entrapment process, helping to elucidate how cortical framework is progressively built and how osteoblasts trapped in the calcified matrix can maintain connections within this biological scaffold.
Materials and methods
Six male New Zealand rabbits (Bettinardi Giuseppe, Momo, Novara, Italy) weighing 2.5–3.0 kg and 5 months of age, which corresponds approximately to the period when the longitudinal growth of the metaphyseal plate slows down, were used in all experiments. The animals were housed in a controlled environment (22 ± 1 °C, 55 ± 5% relative humidity, 12 h light/12 h dark cycle), with free access to food and tap water. The study was approved by the Animal Ethic Committee of the University of Milan (protocol no. 18/2010) and it was carried out in accordance with the Guide for the Care and Use of Laboratory Animals (NIH Publication No. 85–23, revised 1996). At least 7 days were allowed for animals to acclimatise before any experimental manipulations began.
Rabbits were euthanised with an appropriate dose of ketamine chlorhydrate (Imalgene®, Mevial Italia SpA, Assago, Italy) and xylazine (Rompum®, Bayer AG, Leverkusen, Germany). Both left and right femur was disarticulated at the level of the hip and knee, then dissected from soft tissues. The distal half of femur diaphysis (about 2 cm long) of the left and right side were separated from the extremities using a hand saw and the cylinder was split longitudinally into two hemidiaphyses (ventral and dorsal) using a chisel. The marrow was removed by gentle irrigation with cacodylate buffer, which was applied using a syringe. Dorsal hemicortex specimens from both the left and right femur were fixed in a buffered solution of glutaraldehyde (2% in sodium cacodylate 0.1 mol) for 2 min, then stored at 4 °C until further processing for SEM.
Left femur
Group A. Specimens were washed in phosphate-buffered saline (PBS) and processed in a solution of 1% osmium tetraoxide and 1.25% potassium ferrocyanide for 2 h. They were then dehydrated in ascending grades of acetone, subjected to critical point drying in CO2 through five washings at temperatures between −5 °C and 5 °C. Finally, specimens were withdrawn in air at 40 °C, coated with 10 nm of gold palladium in an Emitech K550 vacuum sputter (Edax Inc., Mahwah, NJ, USA) and then studied in direct mode with a Philips XL30 SEM-FEG scanning electron microscope (Philips, Eindhoven, Netherlands).
Group B. After assessment of osteoblast density was completed, specimens were removed from the stabs, rehydrated and immersed in a bath of 1% osmium tetraoxide and 1.25% potassium ferrocyanide for 6 h. They were then washed repeatedly in PBS, dehydrated and again processed for SEM analysis.
Right femur
Group C. Similarly, right femur specimens were also washed in PBS and kept in a solution of 1% osmium tetraoxide and 1.25% potassium ferrocyanide for 2 h. They were washed again in PBS for 10 min, then transferred into an ultrasonic bath set to 30 kHz for 30 s to detach part of the cells adhering to the substrate and to expose zones of the underlying matrix. Specimens were dehydrated in ascending grades of ethanol, subjected to critical point drying and processed for SEM as described earlier.
SEM morphometry
On each endosteal dorsal hemicortex of coated Group A specimens a 5 × 2 mm rectangular area (Fig. 1) was marked with a thin scalpel using a stereoscopic microscope (25× magnification). This area (module) corresponded to the mid-portion of the endosteal femur surface, where the surface is almost flat and regular, with only the Haversian canals of the cortex opening into the marrow canal as previously described (Pazzaglia et al. 2009).
Figure 1.
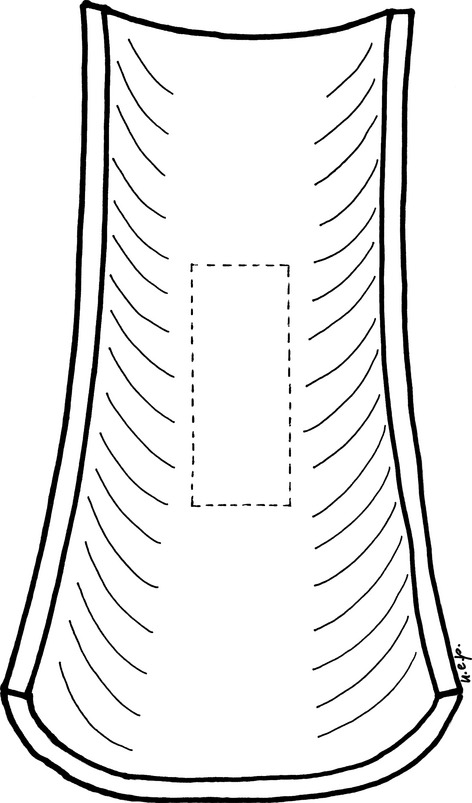
Scheme showing the dorsal hemicortex of the rabbit distal femur diaphysis. The central sector is nearly flat similar to that of the ventral hemicortex. A rectangular module (5 × 2 mm) oriented along the longitudinal axis was traced to mark the boundary of the central fields used to assess osteoblasts and open osteocyte lacunae density.
Keeping the electronic beam perpendicular to the surface under examination, with a working distance of 10 mm and 15 kV, rectangular fields at 250× magnification (corresponding to an area of 0.489 × 0.368 mm = 0.180 mm2) were selected within a marked rectangular module at regular distances from the borders and positioned similar to a chessboard. Of all 55 fields within each module, 25 were scanned (those including a complete sheet of cells) and the corresponding images acquired. The total area of these fields corresponded to an endosteal area of 4.5 mm2 (45% of the module area). Using the images acquired, the number of lining cells was counted and density was assessed.
After re-hydration of the same Group A specimens, they were kept in a bath of osmium tetraoxide and potassium ferrocyanide for 6 h to completely remove any soft tissue. Specimens were then dehydrated in ascending grades of ethanol, critical point dried and coated again for further SEM analysis. Referring to the previously mentioned rectangular modules on the endosteal surface, the same fields previously evaluated for density of lining cells were scanned to assess open osteocyte lacunae (Group B).
The cell surface area was assessed in right femur dorsal hemicortex (ultrasonicated group C). Approximately 40% of the original cell layer had been detached by ultrasonication, thus exposing a large area of underlying bone surface. In the remaining osteoblast populations adhering to the surface, two morphological types were observed: those with a convex dome, marginal shrinkage and a non-adhering cell border (type C1), and those which were flattened on the bone surface with spreading equatorial, cytoplasmic processes (type C2) (Fig. 3). A SEM 800× enlargement of C1 and C2 sample populations of 50 cells was randomly selected. The surface area of the two osteoblast classes was measured using the software cell (Soft Imaging System, GmbH, Munster, Germany).
Figure 3.
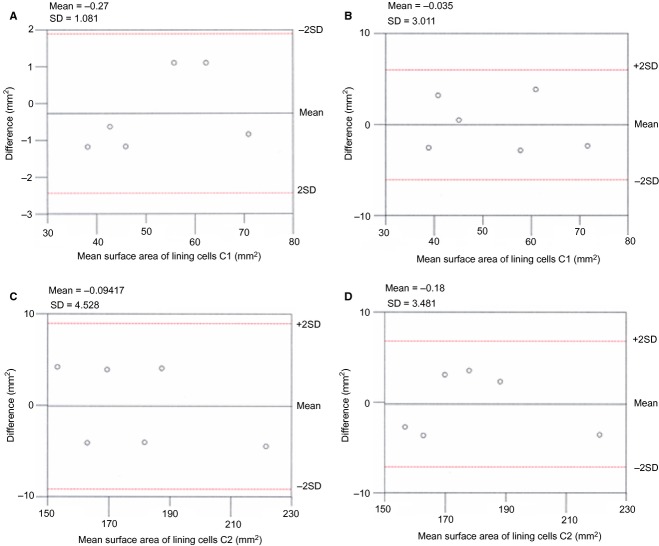
Scatterplots showing: (A) mean surface area of lining cells C1 paired measurements (intraobserver) plotted against differences in surface area assessment; (B) mean surface area of lining cells C1 paired measurements (interobserver) plotted against differences in surface area assessment; (C) mean surface area of lining cells C2 paired measurements (intraobserver) plotted against differences in surface area assessment; (D) mean surface area of lining cells C2 paired measurements (interobserver) plotted against differences in surface area assessment.
Statistical analysis
Mean osteoblast (Group A) and mean open lacunae (Group B) densities on the endosteal surface of the six dorsal, left hemicortices were calculated and compared using Student's t-test. The average surface of regular, domed osteoblasts (type C1) and that of the flattened cells (type C2) in each right hemicortex were also compared. Significance was defined at P < 0.05.
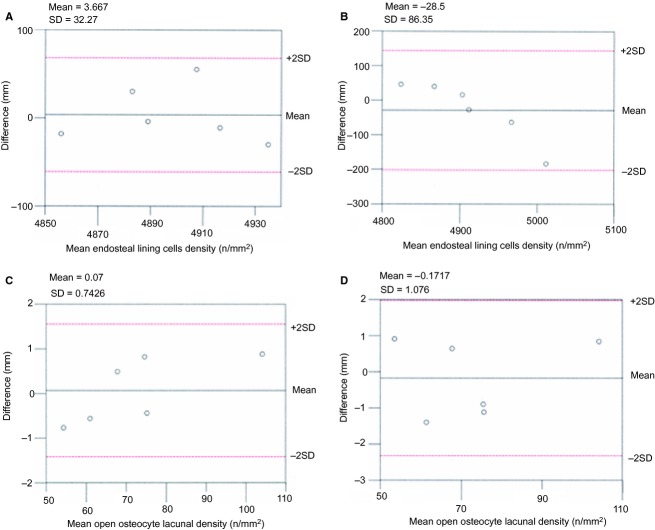
The numbers of osteoblasts and open osteocyte lacunae, and the surface area of domed and flattened osteoblasts, were examined independently by two observers (U.E.P. and T.C.). Repeated measurements at 1-month intervals were performed for cells/open osteocyte lacunae counting and assessment of the osteoblast surface area. The resulting series of paired measurements and the differences of means analysis (Bland & Altman, 2010) were applied to these datasets. The differences between each pair of measurements (intra- and interobservers) were plotted against differences in the density assessment of lining cells (Fig. 2) and the assessment of the surface area of lining cells C1 and C2 (Fig. 3). By analysing the difference between the paired measurements, the only source of variability was the measurement error, which was likely to follow a normal distribution. The variation of the differences in all the interobserver data was wider than in the corresponding intraobserver sets, but with an acceptable degree of agreement (within ± 2 SD) in both series.
Figure 2.
Scatterplots showing: (A) mean of paired measurements (intraobserver) plotted against differences in the density assessment of lining cells; (B) mean of paired measurements (interobserver) plotted against differences in the density assessment of lining cells; (C) mean of paired measurements (intraobserver) plotted against differences in the density assessment of open osteocyte lacunae; (D) mean of paired measurements (interobserver) plotted against differences in the density assessment of open osteocyte lacunae.
Results
Left femur endosteal hemisurfaces were lined by a continuous sheet of polygonal or fusiform cells with convex domes. No adhesion between the border of adjoining cells or bone surface was observed. Marginal overlapping of the cells was an occasional finding. The osteoblast bone face could not be analysed since it was below the cell body. The endosteal cell sheet was continuous with osteoblasts lining the Haversian canals, which opened into the marrow canal (Fig. 4A). No mitotic figures were observed.
Figure 4.
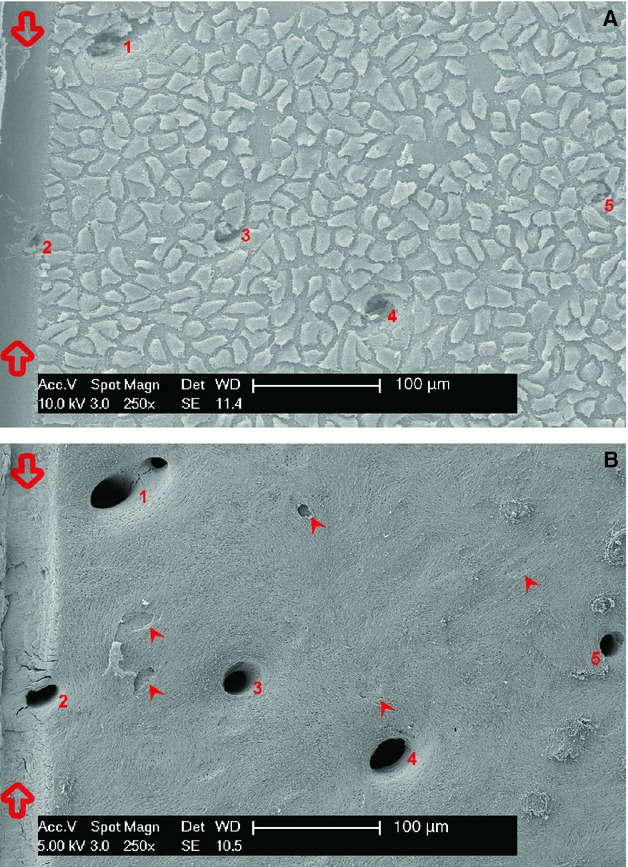
(A) Scanning electron microscopy (SEM)/secondary electron imaging (SEI) (magnification 250×). The groove on the left (between empty arrows) corresponds to the border of the rectangular module used as reference for densitometry. The sheet of endosteal lining cells (osteoblasts) was exposed after marrow removal with cacodylate buffer irrigation. The cells are homogeneously distributed on the endosteal surface and are continuous with those lining the cortical vascular canals abutting the medullary canal (numbered from 1 to 5). Shrinkage led to the observed intercellular gap and floating cell boundaries. (B) SEM/SEI + OsO4 + K3[Fe(CN)6] (osmium tetraoxide and potassium ferrocyanide) (magnification 250×). The same field after maceration with osmium tetraoxide and potassium ferrocyanide shows the cortex vascular canals opening into the medullary canal (numbered 1 to 5). Osteocyte lacunae appear of different depth and correspond to a more or less advanced phase of osteocyte entrapment (arrowheads). The holes of the radial canalicula mark the boundary of the entrapping cell territory. Smaller canalicula holes are homogeneously distributed on the whole endosteal surface corresponding to the dendrites of full active osteoblasts (not committed to entrapment).
The average density of lining cells (osteoblasts) was significantly higher than the average density of open lacunae in the corresponding fields (Table 1) after all the cells had been removed by maceration with osmium tetraoxide and potassium ferrocyanide (Fig. 4B). This corresponded to a ratio of entrapment of one cell per 67.23 osteoblasts.
Table 1.
Comparison of mean density of lining cells (osteoblasts) and open osteocyte lacunae in corresponding SEM endosteal modules and fields (A). Comparison of mean surface area between lining cells type C1 and C2 (B).
| A | Left hemicortex n | LINING CELLS (A) | OPEN LACUNAE (B) | P |
|---|---|---|---|---|
| Mean density (n mm−2) | 6 | 4900.99 ± 30.03 | 72.89 ± 22.55 | P ≤ 0.001 |
| B | n | Lining cells (C1) | n | Lining cells (C2) | P |
|---|---|---|---|---|---|
| Mean surface (μm2) | 6 | 52.46 ± 12.22 | 6 | 179.3 ± 22.06 | P ≤ 0.001 |
Ultrasonication of the right endosteal hemicortices (Group C) left fields with a lower cell density or partially cell-devoid spaces: this allowed us to document shape modulation and widening of the area covered by the expansion of the cell. The average osteoblast surface area of population C2 was significantly higher (P < 0.001) than the one of population C1 (Table 1).
The entrapment process begins with the flattening and spreading of equatorial processes of an osteoblast, which changes the shape of the domed cells (Fig. 5). The entrapment process was followed by coverage of the cell equatorial processes and cellular body by matrix. The plane of the bone surface grew with advancement of the endosteal apposition front. C1 osteoblasts were positioned around the forming lacuna at a higher level of the cell undergoing entrapment (Fig. 6A).
Figure 5.
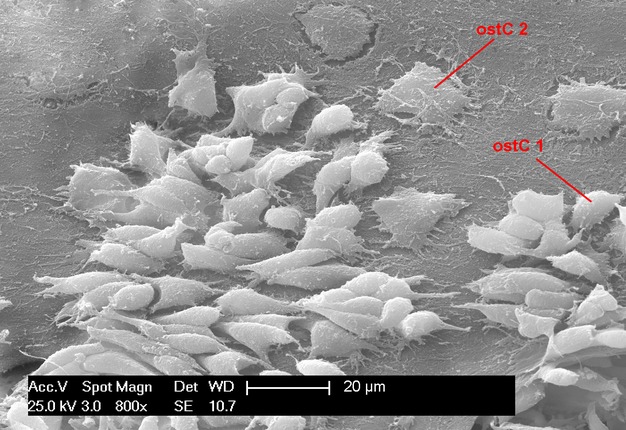
SEM/SEI (magnification 800×). Endosteal surface of the right femur hemicortex, after ultrasonication treatment which mechanically detached a portion of lining cells. The lower cell surface density allowed observation of the relationship of cells and their membrane processes with the underlying bone substrate. The image illustrates the shape modulation that is undergone during entrapment. Osteoblasts of population C2 (ostC2) had a flattened bone surface and spread equatorial dendrites. The osteoblast population C1 (ostC1) showed reduced marginal adhesion to the bone, and the mean surface area was significantly lower than that of the C2 population. Different phases of entrapment are also evident in the top right and left corner, as well as the top middle of the figure.
Figure 6.
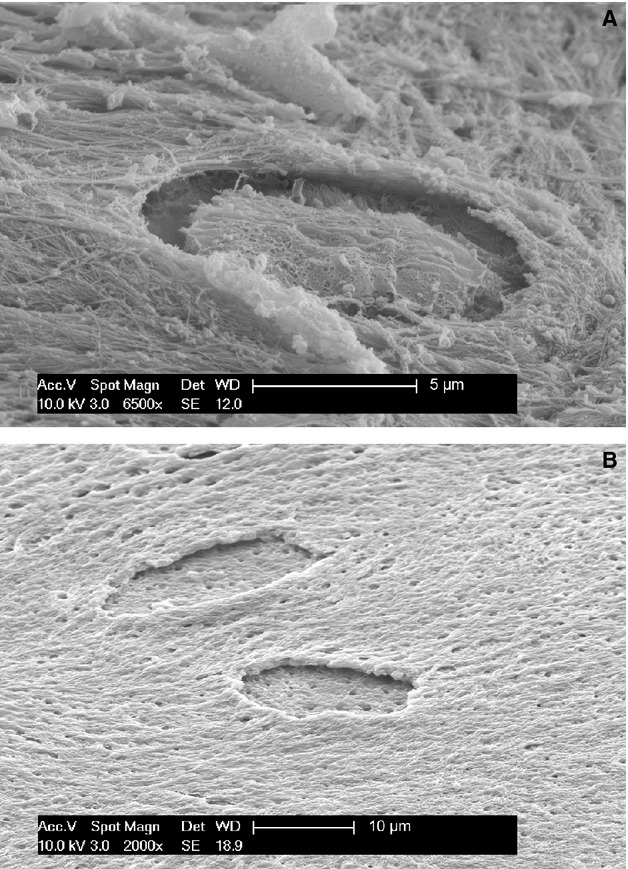
(A) SEM/SEI (magnification 6500×). Progression of osteocyte entrapment, which occurs centripetally as the basal floor of the endosteal surface grows upwards. The dorsal osteocyte membrane possessed crests and vesicles, suggesting development of a dorsal secretory territory during this phase of entrapment. (B) SEM/SEI OsO3 + K3[Fe(CN)6] (magnification 2000×). Detail of two unfinished osteocyte lacunae after maceration with osmium tetraoxide and potassium ferrocyanide. The floor of the lacuna is almost flat, with the openings of the radial canalicula of the osteocyte undergoing entrapment. The lacunar edges appear undermined due to entrapment process centripetal progression. The holes on the bone surface correspond to openings of canalicula left by dendrites of the regular osteoblast layer (removed by maceration).
The specimens macerated in osmium tetraoxide and potassium ferrocyanide (Group B) showed a flat lacunar floor (Fig. 6B); the dorsal aspect (corresponding to the dome) also now appeared flattened with an irregular membrane wrinkled by crests and small vesicles (Fig. 6A). When the lacunar roof had been completed, only thin fissures and a small bump marked the original position of the osteocyte (Fig. 7).
Figure 7.
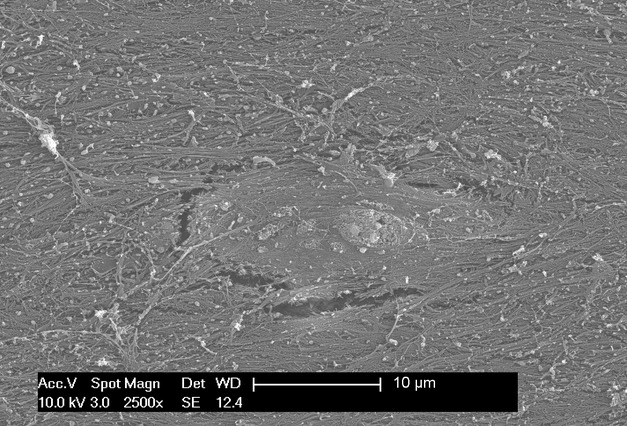
SEM/SEI (magnification 2500×). Detail of an osteocyte lacuna which has almost completed coverage of the roof. The endosteal surface is flat, but a small bump and fissures reveal the position of the recently closed lacuna.
As observed in an earlier study (Pazzaglia et al. 2009), the distal rabbit endosteal surface of the diaphysis is smooth and regular, with only the openings of the Haversian canals abutting the marrow canal. Only more distally (at the level of the metaphysis) could endosteal resorption zones be found (Fig. 8). In all, 136 fields of a total of 150 scanned in the six dorsal hemi-sections of the distal femurs were centred on formative zones lined by the sheet of osteoblasts described earlier. The remaining 14 fields at the more distal level of the endosteal surface showed resorption zones containing osteoclasts. They were characterised by confluent resorption pits (Fig. 8), where the femur flares at the level of the metaphysis.
Figure 8.
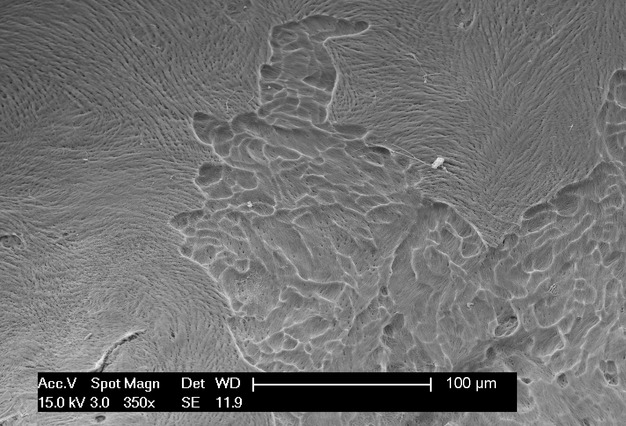
SEM/SEI OsO4 + K3[Fe(CN)6] (magnification 350×) An endosteal resorption zone after maceration with osmium tetraoxyde and potassium ferrocyanide illustrating the superficial and confluent resorption pits produced by the osteoclasts in the distal metaphysis.
Discussion
The endosteal osteoblast sheet can be exposed in a rabbit model by irrigation of the internal hemicortex. The marrow cells were easily removed because the endosteal surface is smooth and regular, unlike that of humans and other mammals (Pazzaglia et al. 2009). It was assumed that the weak irrigation pressure was not capable of detaching the osteoblasts from the bone surface; this was supported by the observation that a complete sheet of cells was continuous with cells lining the Haversian canals. Fixation and processing led to cell shrinkage, which widened the gap between the cells and facilitated counting by making cells appear to be in a single layer (Fig. 4A). Density was calculated under the assumption that the sheet of cells had no detachment and was complete. Very few cell-free spots were observed in each SEM field: as such, measurements of osteoblast density may have been slightly underestimated, but not enough to influence the significant association between osteoblast and open osteocyte lacunae densities. There was no bias of this type in osmium tetraoxide and potassium ferrocyanide-treated fields (Fig. 4B).
The field area is also conditioned by the concavity of the endosteal surface, therefore density assessment in this study was limited to the central fields of the ventral and dorsal hemicortices since the rabbit distal midshafts are nearly flat.
Shrinkage altered the determination of the C1 osteoblast surface area because cells were less adherent to the bone surface. However, this parameter was not used for calculation of cell volume, but to illustrate the cellular adhesion for the purpose of distinguishing the sequential steps of the entrapment process.
Reduction of cell volume and depletion of the ergastoplasmic reticulum supported the hypothesis that osteoblasts committed to being embedded within the matrix (pre-osteocyte or osteoblast/osteocyte) also reduced their synthesis activity (Palumbo, 1986; Palumbo et al. 1990; Marotti et al. 1995). In addition to characterisation of intracytoplasmic structures and the polarisation of the secretory surface of transforming osteoblasts, TEM has been used to describe variations in cell shape and interconnections between bone lining cells and marrow stromal cells (Miller et al. 1980, 1989; Bowman & Miller, 1986; Miller & Jee, 1987; Yamazaki & Eyden, 1995). However, a wide extension of the endosteal lining cells cannot be examined using this method and densitometric assessment is not possible. However, spatial distribution of cells over a large endosteal area can be examined using SEM, allowing a densitometric determination.
Using ultrathin sections conducted transversally to the endosteal surface of rabbit femurs, Luk et al. (1974) were able to distinguish between formative, resting and resorptive areas. The criteria used to differentiate the first two classes were osteoblast size and thickness, which correlated with cell functional activity. Our observations in the same experimental model (but visualised from above) allowed the characterisation of changes in cell shape during the transition from osteoblast to osteocyte. Adhesion of the sheet of osteoblasts to the internal surface of the femur medullary canal was able to withstand the mechanical stress of irrigation, unlike other cell types of the endosteal membrane. This is consistent with the presence of dendrites from the bone face of the osteoblasts penetrating into the underlying bone matrix. In attempts to explain the orientation of the fibrils in sequential lamellae, it was hypothesised that there is a free degree of mobility of the apposing osteoblasts (Boyde & Hobdel, 1969; Jones et al. 1975). However, more recently it has been suggested that osteoblasts have very limited freedom or no freedom at all with regard to lateral sliding. As such, inside a lamellar system they can only move perpendicularly to the plane of apposition (Pazzaglia et al. 2010, 2012a). During a more advanced cell incapsulation phase (with the lacunar roof still open) foldings in the dorsal membrane were observed, with differing vesicles and filaments than those from the smooth dome of a regular osteoblast sheet. These observations suggested that the closure of the osteocyte lacuna may be partially facilitated by the same osteoblast-osteocyte developing a dorsal secretory territory. This hypothesis is consistent with the widely shared belief that osteoblasts exhibit polarized secretory activity, but with collagen extrusion directed towards the lacunar roof. It is also consistent with the concept that osteocyte domain is derived from the architecture of the osteonal lacunar-canalicular system (Pazzaglia et al. 2012a,b2012b; Pazzaglia & Congiu, 2013). However, when a complete roof for the lacuna has been built, any further apposition outside of the lacuna by the osteocyte itself is not possible. At this point, the cell can only implement an internal matrix apposition by shrinking the size of the cellular body. Lacunar roof thickness can only be increased externally by osteoblasts remaining on the endosteal surface.
The morphology and systemic/local regulation of bone remodelling has been reviewed recently by Hadjidakis and Androulakis (2006). They reported 15% entrapment of mature osteoblasts in new matrix. However, previously this percentage has been only approximated. In the present study, the estimated osteoblast density was much higher than that of counted osteocyte lacunae in the corresponding fields after surface maceration. This technique allowed quantitative evaluation corresponding to an entrapment index of one cell every 67.23 osteoblasts in the interval necessary to complete the passages from the flattening of the pre-osteocyte to the closure of the lacuna. This implies a more substantial role for apoptosis in bone remodelling to provide a balance between the number of recruited osteoblasts against the number of osteocytes and resting surface cells within the lamellae system. The observed densities and entrapment index were measured on the endosteal appositional zone of the femur's marrow canal. Due to continuity between the sheet of osteoblasts lining the endosteum and that of the intracortical canals, which opened into the marrow, it was possible to extrapolate that the entrapment process follows the same modulation process as osteon refilling. This does not imply that the endosteal entrapment index calculated in rabbit femur would be the same inside cortical osteons or human bones, since geometric parameters differ (Pazzaglia et al. 2012b,c2012c; Pazzaglia & Congiu, 2013). Likewise, there is no evidence that the bone apposition rate would be the same in all the other sites of tubular bones, such as the periosteum, endosteum and cortical cutting cones (Rauch et al. 2007). During computation of the endosteal entrapment index, osteoblasts that had flattened on the bone surface but not yet formed a banked edge of the lacuna were not counted. As a result, the index should be considered an approximation. Even with these limitations, the entrapment index gives a rough estimate of the percentage of osteoblasts that have transformed into osteocytes which, to the best of our knowledge, has not been previously reported.
The secretory territory of rat osteoblast in parietal bones has been estimated to be 143 ± 33 μm with an approximate daily matrix production (measured with a tetracycline label) of 470 μm3 per osteoblast (Jones, 1974). Other values of appositional bone rate were obtained in other animal models or humans by measuring the linear separation between two tetracycline bone markers and the area of interposed bone (Harris, 2006; Marotti, 1963; Lee et al. 1965; Manson & Waters, 1965; Villanueva & Frost, 1970; Melsen & Mosekilde, 1978; Martin, 1994). The rate of deposition seems to be related to age, single bones and different skeletal sites in the same bone.
By using tritiated thymidine, Owen & MacPherson (1963a,b1963b) examined the rate of movement of cells from the pre-osteoblast to the osteoblast and osteocyte compartments of the periosteum of rabbits during its most active period on the periosteal surface. It was estimated that an osteoblast produced approximately two or three times its own volume of matrix before becoming either an osteocyte or a relatively inactive osteoblast lining a Haversian canal.
The method employed throughout the current study did not allow application of a time scale. Yet, occurrence of sequential steps was documented by observing the top to bottom position of the cells (Fig. 9). We hypothesise that the cell sheet lining the endosteal surface was formed by previously differentiated osteoblasts with varying degrees of adhesion to bone substrate. Therefore, the dynamic histomorphometry we examined exclusively concerned the osteoblast-osteocyte transformation in the endosteal lamellar system. This is consistent with the observation by Owen & MacPherson (1963a) that incorporation of osteoblasts into the bone was not a random process, but regulated by systemic, local and mechanical factors (Ali et al. 1990; Guignandon et al. 1997, 2003; Zhang et al. 2011). The changes in osteoblast shape that accompanied the entrapment process may be interpreted as part of ‘adaptation' in bones that occurs during an individual's lifetime (Currey, 2003). Certainly, these changes primarily determine the lacunar-canalicular system geometry and, secondarily, nutrition, mineral homeostasis and mechanical behaviour of the bone.
Figure 9.
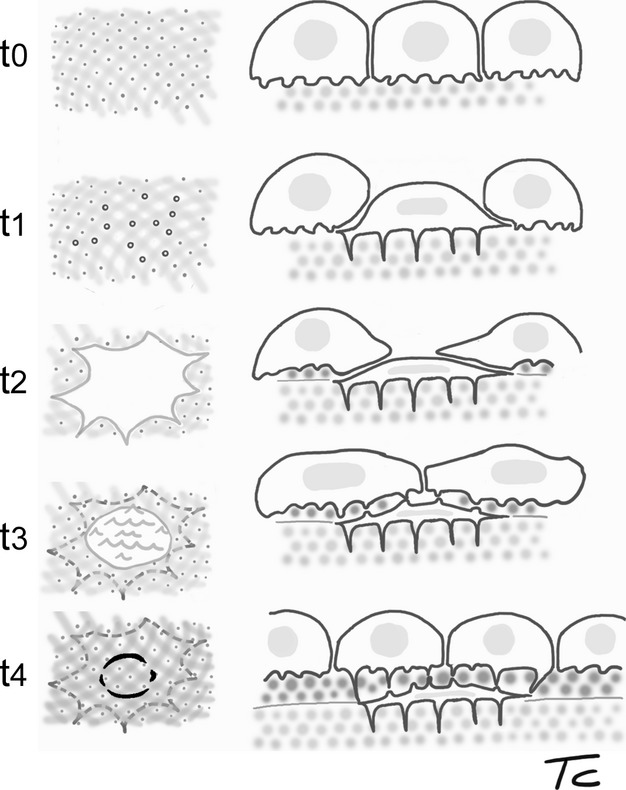
Scheme illustrating the sequential steps of osteoblast-osteocyte transformation and cell entrapment, based on SEM surface observations from the current study. The left column shows the surface as seen from the top: sequential steps t0 and t1 correspond to osmium tetraoxide/ferrocyanide macerated surfaces, used to show the canalicula holes; t3 and t4 schematise the bone surface after removal of the osteoblast superficial layer. The dotted circles indicate the perimeters of entrapping or entrapped osteocytes. The right column represents the corresponding top to deep position of the cells with respect to the endosteal surface of the femur.
Conclusion
This study provides the first report that the number of osteoblasts active on the endosteal surface of rabbit femur exceeds the number of cells that become incorporated as osteocytes. As such, the balance should be equilibrated by osteoblasts transforming in resting lining cells or undergoing apoptosis. If the entrapment index is correlated to bone apposition rate, which varies according to species, the specific bone, age of individuals and even geometrical constraint of a closed lamellar system such as an osteon, this suggests that the entrapment index will be different at the level of the endosteum, periosteum and within the secondary osteons.
The application of SEM provided a novel morphological and quantitative approach to examine the osteoblast-osteocyte transition, enriching previous TEM studies (Palumbo et al. 1990; Marotti et al. 1992). Our results are consistent with the ‘osteoblastic formative areas' described by Luk et al. (1974) in the same young adult rabbit model. Polarisation of the osteoblast secretory territory towards the lacunar roof in the final phase of entrapment provides new insight on the formation of the lacunar-canalicular system. These data may contribute to a better understanding of osteoblast/osteocyte shape modulation and lacunar-canalicular development in both normal bone remodelling and metabolic bone diseases.
Acknowledgments
The study was carried out using a scanning electron microscope belonging to Centro Grandi Strumenti of the University of Insubria and was supported by research funds of Brescia University, ‘Department of Medical and Surgical Specialties, Radiological Sciences and Public Health'.
The authors acknowledge the contribution of the Scientific Committee of the ‘Mario Boni Foundation' in the experimental design and preparation of the manuscript.
The authors state that they have no conflict of interest.
References
- Ali NN, Mehuish PB, Boyde A, et al. Parathyroid hormone, but not prostaglandin E2, changes the shape of osteoblasts maintained on bone in vitro. J Bone Miner Res. 1990;5:115–121. doi: 10.1002/jbmr.5650050204. [DOI] [PubMed] [Google Scholar]
- Ascenzi A, Bonucci E. The compressive properties of single osteons. Anat Rec. 1968;161:377–391. doi: 10.1002/ar.1091610309. [DOI] [PubMed] [Google Scholar]
- Baud CA. Submicroscopic structure and functional aspects of the osteocyte. Clin Orthop Relat Res. 1968;56:227–236. [PubMed] [Google Scholar]
- Bland JM, Altman DG. Statistical methods for assessing agreement between two methods of clinical measurement. Int J Nurs Studies. 2010;47:931–936. [PubMed] [Google Scholar]
- Bowman BM, Miller SC. The proliferation and differentiation of the bone-lining cell in estrogen: induced osteogenesis. Bone. 1986;7:351–357. doi: 10.1016/8756-3282(86)90255-3. [DOI] [PubMed] [Google Scholar]
- Boyde A, Hobdel MH. Scanning electron microscopy of lamellar bone. Z Zellforsch. 1969;93:213–231. doi: 10.1007/BF00336690. [DOI] [PubMed] [Google Scholar]
- Cooper RR, Milgram JW, Robinson RA. Morphology of the osteon. An electron microscopic study. J Bone Joint Surg. 1966;48A:1239–1271. [PubMed] [Google Scholar]
- Currey JD. The many adaptations of bone. J Biomech. 2003;36:1487–1495. doi: 10.1016/s0021-9290(03)00124-6. [DOI] [PubMed] [Google Scholar]
- Giraud-Guille MM. Twisted plywood architecture of collagen fibrils in human compact bone osteons. Calcif Tissue Int. 1988;42:167–180. doi: 10.1007/BF02556330. [DOI] [PubMed] [Google Scholar]
- Guignandon A, Usson Y, Laroche N, et al. Effects of intermittent or continuous gravitational stresses on cell-matrix adhesion: quantitative analysis of focal contacts in osteoblastic ROS 17/2.8 cells. Exp Cell Res. 1997;236:66–75. doi: 10.1006/excr.1997.3703. [DOI] [PubMed] [Google Scholar]
- Guignandon A, Akhouayri O, Laroche N, et al. Focal contacts organization in osteoblastic cells under microgravity and cyclic deformation conditions. Adv Space Res. 2003;32:1561–1567. doi: 10.1016/S0273-1177(03)90396-6. [DOI] [PubMed] [Google Scholar]
- Hadjidakis DJ, Androulakis II. Bone remodeling. Ann NY Acad Sci. 2006;1092:385–396. doi: 10.1196/annals.1365.035. [DOI] [PubMed] [Google Scholar]
- Ham CW. Histology. Philadelphia: JB Lippincott Company; 1957. [Google Scholar]
- Harris WH. A microscopic method of determining rates of bone growth. Nature. 1960;188:1038–1039. doi: 10.1038/1881038a0. [DOI] [PubMed] [Google Scholar]
- Hadjidakis DJ, Androulakis II. Bone remodeling. Ann NY Acad Sci. 2006;1092:385–396. doi: 10.1196/annals.1365.035. [DOI] [PubMed] [Google Scholar]
- Jones SJ. Secretory territories and rate of matrix production of osteoblasts. Calcif Tissue Res. 1974;14:309–315. doi: 10.1007/BF02060305. [DOI] [PubMed] [Google Scholar]
- Jones SJ, Boyde A, Pawley JB. Osteoblasts and collagen orientation. Cell Tissue Res. 1975;159:73–80. doi: 10.1007/BF00231996. [DOI] [PubMed] [Google Scholar]
- Kerschnitzki M, Wagermaier W, Roschger P, et al. The organization of the osteocyte network mirrors the extracellular matrix orientation in bone. J Struct Biol. 2011;173:303–311. doi: 10.1016/j.jsb.2010.11.014. [DOI] [PubMed] [Google Scholar]
- Lee WR, Marshall JH, Sissons HA. Calcium accretion and bone formation in dogs: an experimental comparison between the results of Ca-45 kinetic analysis and tetracycline labelling. J Bone Joint Surg. 1965;47B:157–180. [PubMed] [Google Scholar]
- Luk SC, Nopajaroonsri C, Simon GI. The ultrastructure of endosteum: a topographic study in young adult rabbits. J Ultrastruct Res. 1974;46:165–183. doi: 10.1016/s0022-5320(74)80054-7. [DOI] [PubMed] [Google Scholar]
- Manson JD, Waters NE. Observations on the rate of maturation of the cat osteon. J Anat. 1965;99(Pt 3):539–549. [PMC free article] [PubMed] [Google Scholar]
- Marotti G. Quantitative studies on bone reconstruction. The reconstruction in homotypic shaft bones. Acta Anat. 1963;52:291–333. [PubMed] [Google Scholar]
- Marotti G, Zallone AZ, Ledda M. Number, size and arrangement of osteoblasts in osteons at different stages of formation. Calcif Tissue Int. 1976;21(suppl):96–101. [PubMed] [Google Scholar]
- Marotti G, Ferretti M, Muglia MA, et al. A quantitative evaluation of osteoblast-osteocyte relationships on growing endosteal surface of rabbit tibiae. Bone. 1992;13:363–368. doi: 10.1016/8756-3282(92)90452-3. [DOI] [PubMed] [Google Scholar]
- Marotti G, Ferretti M, Remaggi F, et al. Quantitative evaluation on osteocyte canalicular density in human secondary osteons. Bone. 1995;16:125–128. doi: 10.1016/s8756-3282(94)00019-0. [DOI] [PubMed] [Google Scholar]
- Martin RB. On the histologic measurement of osteonal BMU activation frequency. Bone. 1994;15:547–549. doi: 10.1016/8756-3282(94)90279-8. [DOI] [PubMed] [Google Scholar]
- Melsen F, Mosekilde L. Tetracycline double-labeling of iliac trabecular bone in 41 normal adults. Calcif Tissue Res. 1978;26:99–102. doi: 10.1007/BF02013242. [DOI] [PubMed] [Google Scholar]
- Miller SC, Jee WSS. The bone lining cell: a distinct phenotype? Calc Tissue Int. 1987;41:1–5. doi: 10.1007/BF02555122. [DOI] [PubMed] [Google Scholar]
- Miller SC, Bowman BM, Smith JM, et al. Characterization of endosteal bone-lining cells from fatty marrow bone sites in adult beagles. Anat Rec. 1980;198:163–173. doi: 10.1002/ar.1091980204. [DOI] [PubMed] [Google Scholar]
- Miller SC, De Saint-Georges L, Bowman BM, et al. Bone lining cells: structure and function. Scanning Microsc. 1989;3:953–961. [PubMed] [Google Scholar]
- Owen M, MacPherson S. Cell population kinetics of an osteogenic tissue (I) J Cell Biol. 1963a;19:19–32. doi: 10.1083/jcb.19.1.33. [DOI] [PMC free article] [PubMed] [Google Scholar]
- Owen M, MacPherson S. Cell population kinetics of an osteogenic tissue (II) J Cell Biol. 1963b;19:33–44. doi: 10.1083/jcb.19.1.33. [DOI] [PMC free article] [PubMed] [Google Scholar]
- Palumbo C. A three-dimensional ultrastructural study of osteoid-osteocytes in the tibia of chick embryos. Cell Tissue Res. 1986;246:125–131. doi: 10.1007/BF00219008. [DOI] [PubMed] [Google Scholar]
- Palumbo C, Palazzini S, Zaffe D, et al. Osteocyte differentiation in the tibia of newborn rabbits: an ultrastructural study of the formation of cytoplasmic processes. Acta Anat. 1990;137:350–358. doi: 10.1159/000146907. [DOI] [PubMed] [Google Scholar]
- Parfitt AM. Osteonal and hemi-osteonal remodeling: the spatial framework for signal traffic in adult human bone. J Cell Biochem. 1994;55:273–286. doi: 10.1002/jcb.240550303. [DOI] [PubMed] [Google Scholar]
- Pazzaglia UE, Congiu T. The cast imaging of the osteon lacunar-canalicular system and the implications with functional models of intracanalicular flow. J Anat. 2013;222:193–202. doi: 10.1111/joa.12004. [DOI] [PMC free article] [PubMed] [Google Scholar]
- Pazzaglia UE, Congiu T, Raspanti M, et al. Anatomy of the intracortical canal system: scanning electron microscopy study in rabbit femur. Clin Orthop Relat Res. 2009;467:2446–2456. doi: 10.1007/s11999-009-0806-x. [DOI] [PMC free article] [PubMed] [Google Scholar]
- Pazzaglia UE, Congiu T, Marchese M, et al. The shape modulation of osteoblast-osteocyte transformation and its correlation with fibrillar organization in secondary osteons. A SEM study employing the graded osmic maceration technique. Cell Tissue Res. 2010;340:533–540. doi: 10.1007/s00441-010-0970-z. [DOI] [PubMed] [Google Scholar]
- Pazzaglia UE, Congiu T, Zarattini G, et al. The fibrillar organization of the osteon and cellular aspects of its development. A morphological study using the SEM fractured cortex technique. Anat Sci Int. 2011;86:128–134. doi: 10.1007/s12565-010-0099-x. [DOI] [PubMed] [Google Scholar]
- Pazzaglia UE, Congiu T, Marchese M, et al. The canalicular system and the osteoblasts domain in human secondary osteons. Anat Hist Embryol, 41, 2012a;410:418. doi: 10.1111/j.1439-0264.2012.01150.x. [DOI] [PubMed] [Google Scholar]
- Pazzaglia UE, Congiu T, Franzetti E, et al. A model of osteoblast-osteocyte kinetics in the development of secondary osteons in rabbits. J Anat. 2012b;220:372–383. doi: 10.1111/j.1469-7580.2012.01477.x. [DOI] [PMC free article] [PubMed] [Google Scholar]
- Pazzaglia UE, Congiu T, Marchese M, et al. Morphometry and patterns of lamellar bone in human Haversian systems. Anat Rec. 2012c;295:1421–1429. doi: 10.1002/ar.22535. [DOI] [PubMed] [Google Scholar]
- Rauch F, Travers R, Glorieux FH. Intracortical remodeling during human bone development. A histomorphometric study. Bone. 2007;40:274–280. doi: 10.1016/j.bone.2006.09.012. [DOI] [PubMed] [Google Scholar]
- Reid SA. A study of lamellar organization in juvenile and adult human bone. Anat Embryol. 1986;174:329–338. doi: 10.1007/BF00698783. [DOI] [PubMed] [Google Scholar]
- Villanueva AR, Frost HM. Evaluation of factors determining the tissue-level haversian bone formation rate in man. J Dent Res. 1970;49:836–846. doi: 10.1177/00220345700490042201. [DOI] [PubMed] [Google Scholar]
- Yamazaki K, Eyden BP. A study of intercellular relationships between trabecular bone and marrow stromal cells in the murine femoral metaphysis. Anat Embryol. 1995;192:9–20. doi: 10.1007/BF00186987. [DOI] [PubMed] [Google Scholar]
- Zhang R, Lu Y, Ye L, et al. Unique roles of phosphorus in endochondral bone formation and osteocyte maturation. J Bone Min Res. 2011;26:1047–1056. doi: 10.1002/jbmr.294. [DOI] [PMC free article] [PubMed] [Google Scholar]


