DOI: 10.1111/j.1469-7580.2011.01321.x Cobb and Panagiotopoulou (2011) assesses the effect of the presence of developing incisor tooth crypts on strain in the developing mandibular symphysis using finite element analysis. The paper also includes a secondary study investigating the sensitivity of the same finite element mandible model to the inclusion of the periodontal ligament (PDL). This was assessed by comparing the strains between a model with (PDL Model) and without the PDL (No PDL Model). The results presented in the paper for the No PDL model are incorrect (Table 1, Table 2, Figs 5 and 6). In order to model the mandible without PDL in the finite elements analysis, the PDL region should have been assigned the material properties of the surrounding cortical bone, with a Young's modulus of elasticity of 17GPa (17000MPa), but in error it was modelled with a value of 0.017GPa (17MPa).
Table 1.
Strain Magnitude from the FEA of the PDL model and the No PDL model.
| PDL model | No PDL model | |||||
|---|---|---|---|---|---|---|
| Location | Maximum Principal Strain (με) | Minimum Principal Strain (με) | Maximum Shear Strain (με) | Maximum Principal Strain (με) | Minimum Principal Strain (με) | Maximum Shear Strain (με) |
| 1 | 114.66 | −50.76 | 165.42 | 137.59 | −58.58 | 196.15 |
| 2 | 229.24 | −102.20 | 331.44 | 238.75 | −103.60 | 342.25 |
| 3 | 97.49 | −293.59 | 391.08 | 99.40 | −296.93 | 396.38 |
| 4 | 179.48 | −96.43 | 275.91 | 180.54 | −96.45 | 276.94 |
| 5 | 135.18 | −80.19 | 215.37 | 132.66 | −93.88 | 226.58 |
| 6 | 76.58 | −87.26 | 163.84 | 69.95 | −84.20 | 154.19 |
| 7 | 108.71 | −60.85 | 169.57 | 76.38 | −46.27 | 122.56 |
| 8 | 56.14 | −45.02 | 101.16 | 47.03 | −38.53 | 85.55 |
| 9 | 148.38 | −97.53 | 245.91 | 157.49 | −99.77 | 257.21 |
| 10 | 85.63 | −112.82 | 198.45 | 84.83 | −113.89 | 198.77 |
| 11 | 57.14 | −73.94 | 131.09 | 55.33 | −58.61 | 114.01 |
| 12 | 93.33 | −99.42 | 192.75 | 84.89 | −89.38 | 174.25 |
| 13 | 249.12 | −125.11 | 374.24 | 242.96 | −121.59 | 364.47 |
| 14 | 57.83 | −69.94 | 127.77 | 55.81 | −67.60 | 123.40 |
| 15 | 47.12 | −148.57 | 195.68 | 38.67 | −121.96 | 160.61 |
| 16 | 12.65 | −29.87 | 42.52 | 12.21 | −32.87 | 45.07 |
| 17 | 20.39 | −31.02 | 51.41 | 19.50 | −36.71 | 56.20 |
| 18 | 39.27 | −95.69 | 134.96 | 38.84 | −93.20 | 132.04 |
| 19 | 81.22 | −59.97 | 141.18 | 82.06 | −60.82 | 142.83 |
| 20 | 60.52 | −52.37 | 112.89 | 63.05 | −51.04 | 114.17 |
Table 2.
Orientation of maximum principal strain, minimum principal strain and maximum shear strain from the F EA of the PDL model and the No PDL model.
| PDL model | No PDL model | |||||||||||
|---|---|---|---|---|---|---|---|---|---|---|---|---|
| Maximum Principal Strain | Minimum Principal Strain | Maximum Principal Strain | Minimum Principal Strain | |||||||||
| Location | x | y | z | x | y | z | x | y | z | x | y | z |
| 1 | 0.08 | 0.94 | 0.01 | 0.76 | 0.03 | 0.51 | 0.10 | 0.93 | −0.02 | 0.77 | 0.03 | 0.50 |
| 2 | 0.17 | 0.91 | −0.05 | 0.70 | 0.03 | 0.50 | 0.20 | 0.90 | −0.09 | 0.69 | 0.03 | 0.50 |
| 3 | −0.12 | 0.39 | 0.67 | 0.90 | −0.07 | 0.27 | −0.13 | 0.36 | 0.68 | 0.90 | −0.07 | 0.27 |
| 4 | −0.17 | −0.06 | 0.71 | 0.41 | 0.10 | 0.14 | −0.18 | −0.06 | 0.71 | 0.41 | 0.10 | 0.14 |
| 5 | 0.45 | 0.60 | −0.44 | 0.68 | −0.04 | 0.66 | 0.53 | 0.63 | −0.42 | 0.58 | −0.05 | 0.68 |
| 6 | 0.20 | 0.11 | 0.03 | −0.36 | 0.45 | −0.23 | 0.49 | 0.18 | −0.26 | −0.46 | 0.54 | −0.35 |
| 7 | 0.82 | 0.24 | −0.48 | 0.28 | 0.08 | 0.45 | 0.81 | 0.24 | −0.48 | 0.27 | 0.07 | 0.44 |
| 8 | 0.67 | 0.15 | −0.38 | 0.21 | −0.02 | 0.31 | 0.70 | 0.14 | −0.35 | 0.22 | −0.05 | 0.35 |
| 9 | 0.35 | −0.08 | 0.33 | 0.45 | 0.29 | −0.22 | 0.32 | −0.07 | 0.35 | 0.55 | 0.29 | −0.28 |
| 10 | −0.04 | 0.21 | 0.06 | 0.43 | 0.27 | −0.27 | 0.11 | 0.14 | 0.20 | 0.56 | 0.29 | −0.37 |
| 11 | 0.27 | −0.08 | 0.49 | 0.78 | −0.02 | −0.39 | 0.26 | −0.07 | 0.50 | 0.78 | −0.03 | −0.37 |
| 12 | 0.49 | −0.09 | 0.72 | 0.76 | 0.38 | −0.44 | 0.45 | −0.08 | 0.72 | 0.77 | 0.38 | −0.41 |
| 13 | 0.06 | 0.80 | −0.02 | −0.07 | 0.06 | 0.55 | 0.07 | 0.80 | −0.02 | −0.07 | 0.06 | 0.55 |
| 14 | 0.12 | 0.97 | 0.04 | 0.40 | −0.05 | −0.08 | 0.14 | 0.97 | 0.04 | 0.37 | −0.05 | −0.04 |
| 15 | −0.17 | −0.02 | 0.48 | −0.01 | 1.00 | 0.02 | −0.17 | −0.02 | 0.48 | −0.01 | 1.00 | 0.02 |
| 16 | 0.51 | 0.01 | 0.79 | 0.08 | 0.98 | 0.00 | 0.51 | 0.01 | 0.78 | 0.11 | 0.98 | −0.03 |
| 17 | 0.57 | 0.00 | 0.68 | 0.18 | 0.87 | −0.02 | 0.56 | 0.01 | 0.68 | 0.19 | 0.91 | −0.02 |
| 18 | 0.71 | 0.00 | 0.70 | −0.03 | 1.00 | 0.02 | 0.71 | 0.00 | 0.70 | −0.01 | 1.00 | 0.01 |
| 19 | 0.12 | 0.03 | 0.16 | 0.72 | −0.14 | −0.47 | 0.23 | −0.19 | 0.41 | 0.73 | −0.17 | −0.44 |
| 20 | 0.44 | −0.15 | 0.77 | 0.74 | 0.51 | −0.24 | 0.40 | −0.17 | 0.79 | 0.76 | 0.50 | −0.20 |
Fig 5.

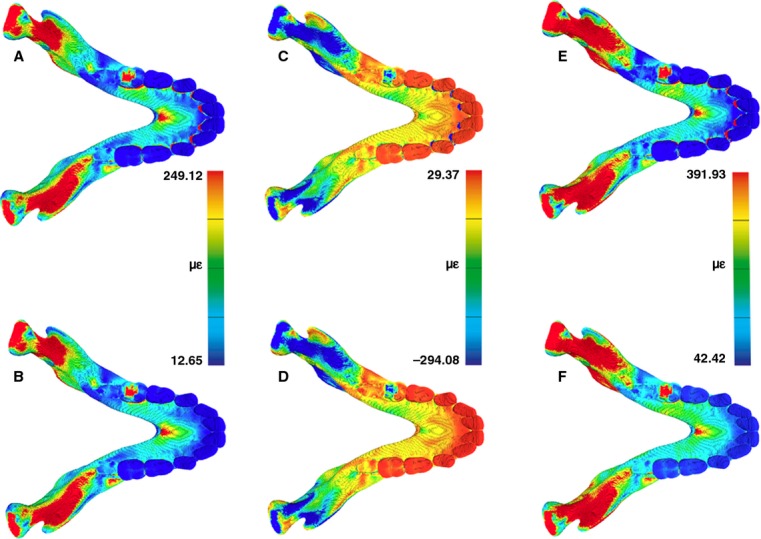
Comparison of strain magnitude patterns from the FEA of the PDL model (A, C, E) and the No PDL model (B, D, F). Maximum principal strain (A, B), minimum principal strain (C, D) and maximum shear strain (E, F) are displayed.
Fig 6.

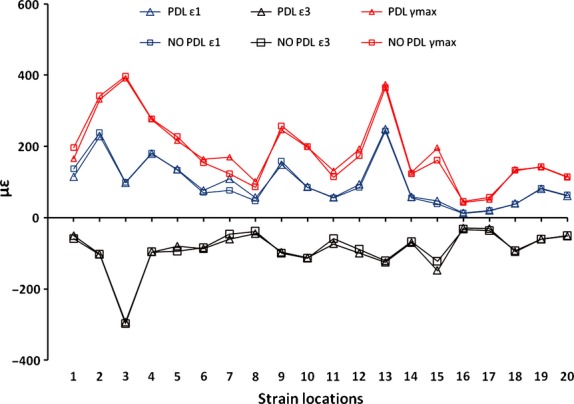
Strain magnitude from the FEA of the PDL model and the No PDL model. Strain is displayed from all 20 strain locations shown in Fig. 3.
The correct results are presented in this erratum (Table 1, Table 2, Figs 5 and 6). In the majority of locations the ε1, ε3 and γmax strain magnitudes and patterns (relative magnitudes between regions) between the PDL and No PDL models are very similar, differing by up to 5% (Table 1; Figs 5 and 6). However, there are higher differences in strain magnitude, approximately 10-30%, between the PDL and No PDL models in some locations (at strain locations 1, 7, 8, 15 for ε1, ε3 and γmax; and in addition 5, 11, 12, 16, 17 for ε3, and 11 for γmax). The ε1 and ε3 strain orientations in the PDL and No PDL models differ by less than 5 degrees in all locations, apart from ε1 at strain locations 6, 10 and 19, which differ by 35, 52 and 31 degrees respectively.
The revised results demonstrate that overall there are small differences in strains between the PDL and No PDL models, but there are some notable differences at some locations. These strain differences between the PDL and No PDL models, however, do not affect the overall interpretation of the main results of this study, which assesses the effect of the presence of developing incisor tooth crypts on strain in the developing mandibular symphysis.
The mechanical effect of the presence of developing incisors is assessed through the comparison of two models, the Crypt and No Crypt FE models, which do not include the PDL tissue. The consistent exclusion of the PDL from the Crypt and No Crypt models means that variations in strain magnitudes due to the absence of the PDL are constant. In addition, the comparison of the Crypt and No Crypt models is based on relative rather than absolute strain magnitude, and so the exclusion of the PDL does not impact its interpretation and thus the main findings of the paper.
Reference
- Cobb SN, Panagiotopoulou O. Balancing the spatial demands of the developing dentition with the mechanical demands of the catarrhine mandibular symphysis. J Anat. 2011;218:96–111. doi: 10.1111/j.1469-7580.2010.01321.x. [DOI] [PMC free article] [PubMed] [Google Scholar] [Retracted]


