

Abstract
Background and Purpose
Gambogic acid (GA) and methyl jasmonate (MJ) are increasingly being recognized as novel natural anticancer compounds. Here, we investigated the antitumour effects of GA in combination with MJ on human bladder cancer cells.
Experimental Approach
Cell viability was detected by cell counting kit-8 assay. Cell apoptosis was assessed by Hoechst 33258 staining and flow cytometry. Protein levels were determined by immunoblotting and expressions of mRNA and miRNAs by RT-PCR. Differential expressions of a group of downstream genes were identified using microarray analysis.
Key Results
MJ significantly sensitized bladder cancer cells to GA-induced growth inhibition and apoptosis while sparing normal fibroblasts. MJ enhanced GA-induced activation of caspase-3 and caspase-9, and down-regulated the expression of XIAP. Furthermore, treatment of bladder cancer cells with a combination of GA and MJ induced synergistic inhibition of the enhancer of zeste homologue 2 (EZH2) expression, whereas miR-101 expression was up-regulated. Conversely, knockdown of miR-101 restored this decreased expression of EZH2 and suppressed the inhibitory effect of GA and MJ on the growth of bladder cancer cells. Microarray analysis showed that genes closely associated with bladder cancer development were significantly down-regulated by GA and MJ. In a s.c. xenograft mouse model of human bladder carcinoma, the combination of GA and MJ exerted an increased antitumour effect compared with GA alone.
Conclusion and Implications
MJ sensitizes bladder cancer cells to GA-induced apoptosis by down-regulating the expression of EZH2 induced by miR-101. Thus, the combination of selective anti-cancer agents MJ and GA could provide a novel strategy for treating human bladder cancer.
Keywords: gambogic acid, methyl jasmonate, miR-101, EZH2, apoptosis, sensitization
Introduction
Bladder cancer is the fifth most common tumour worldwide, and it is the second most common cause of death in patients with urological malignancy (Jemal et al., 2009). More than 90% of bladder cancers are transitional cell cancer. Although treatment strategies for bladder cancer range from transurethral resection for superficial tumours to systemic chemotherapy for locally advanced or metastatic bladder cancer, more and more patients still have high recurrence and metastasis, and overall survival is still poor. Therefore, current therapy is far from satisfactory, indicating the need for innovative therapies.
Recently, extensive work has been done to evaluate the therapeutic efficacy and safety of natural compounds for treating cancer. Gambogic acid (GA) is a natural product derived from gamboge, the resin secreted from the Garcinia hanburyi tree in Southeast Asia (Yu et al., 2006). GA possesses diverse biological properties such as antioxidant, anti-inflammatory, antiviral, anti-infectious, and neuroprotective effects (Jang et al., 2007; Panthong et al., 2007). Additionally, GA inhibits the growth of several types of cancer including prostate cancer, gastric carcinoma and lung carcinoma in vitro and in vivo (Wu et al., 2004; Yu et al., 2006; Yi et al., 2008). A variety of possible mechanisms are proposed for the anticancer effect of GA. These include suppression of the anti-apoptotic protein survivin (Wang et al., 2008a), induction of apoptosis-associated protein p53 (Rong et al., 2010), activation of GSK-3β (Li et al., 2009), and down-regulation of the murine double minute-2 (MDM2) oncogene and subsequent induction of p21 (Rong et al., 2010). GA has also been shown to directly bind to c-myc and transferrin receptors (Kasibhatla et al., 2005), to block VEGF signalling (Lu et al., 2007), and to inhibit the expression of 14-3-3 protein sigma and stathmin (Wang et al., 2008b). In addition, GA has been identified as a novel Hsp90 inhibitor that is known to be selectively toxic to malignant cells (Zhang et al., 2010; Davenport et al., 2011). However, the effect of GA on bladder cancer and the underlying mechanism are still largely unknown.
Another group of plant stress hormones called jasmonates, and some of their synthetic derivatives, selectively exhibit anti-cancer activity in vitro and in vivo (Fingrut and Flescher, 2002). Moreover, it has been reported that methyl jasmonate (MJ) induces synergistic cytotoxic effects when combined with other anti-cancer agents on several types of cancer cell lines, including pancreas, breast, prostate and lung, as well as cancer cells derived from chronic lymphocytic leukaemia (Heyfets and Flescher, 2007; Yeruva et al., 2010; Raviv et al., 2011; Milrot et al., 2013). Among the naturally occurring jasmonates, MJ is the most active (Flescher, 2007). We previously demonstrated that the combination of MJ and Smac peptide enhanced the apoptosis-inducing effect in a synergistic manner by releasing and activating inhibitor of apoptosis proteins (IAPs)-binding caspase-3 (Jiang et al., 2011). However, whether MJ possesses a synergistic anticancer effect when combined with GA in human bladder cancer cells has yet to be explored.
Polycomb group (PcG) proteins are key regulators of development and are required for establishing and maintaining proper cell identity during differentiation of embryonic stem cells (Lee et al., 2006). Polycomb repressive complex 2 (PRC2) consists of enhancer of zeste homologue 2 (EZH2), EED, and SUZ12, and is the core component of polycomb-mediated transcriptional silencing, in which EZH2 behaves as a histone methyltransferase that specifically induces transcriptional incompetent histone H3 lysine 27 tri-methylation (H3K27me3) to the targeted genes (Cao et al., 2002). EZH2 expression is significantly increased in transitional cell carcinoma of the bladder compared with normal urothelium (Raman et al., 2005), and there is a significant correlation between EZH2 level and histological grade as well as invasiveness of bladder cancer (Weikert et al., 2005). Given that EZH2 plays a crucial role in bladder cancer, we sought to determine whether GA and MJ could exert anticancer effects by targeting EZH2. The results from the present study indicate that MJ enhances the apoptosis-inducing potential of GA by down-regulating the expression of EZH2 induced by miR-101. Furthermore, it seems that down-regulation of EZH2 might lead to differential expressions of a group of downstream genes and change several pathways. Our findings reveal a novel strategy of combining GA and MJ to treat human bladder cancer.
Methods
Reagents
GA, MJ, and DMSO were all purchased from Sigma (St Louis, MO, USA). For in vitro experiments, GA was dissolved in DMSO and stored as 25 mmol·L−1 aliquots at −20°C. MJ was prepared into stock solutions at a concentration of 1 mol·L−1 in DMSO and stored at −4°C. Further dilutions of GA and MJ were performed in culture medium. For in vivo studies, GA was dissolved in 0.9% NaCl, and MJ was dissolved in a lipid formulation – lipofundin (LPF; B Braun Melsungen, Melsungen, Germany).
Cell culture
The human bladder cancer cell lines T24 and BIU-87 were obtained from American Type Culture Collection and cultured in RPMI-1640 medium (Gibco, Grand Island, NY, USA) supplemented with 10% FBS (HyClone, Logan, UT, USA). All studies involving animals are reported in line with the ARRIVE guidelines for reporting experiments involving animals (Kilkenny et al., 2010; McGrath et al., 2010). Primary human skin fibroblasts were established from explants of human adult skin biopsies obtained from informed healthy volunteers (aged 21–49 years). Cells were grown as monolayer cultures in DMEM (Gibco) with 15% FBS (HyClone). Cells at subcultures 5 to 10 were used in the experiments. All culture media were also supplemented with 100 U mL−1 penicillin and 100 μg mL−1 streptomycin (HyClone). All cells were maintained in a humidified atmosphere, at 37°C with 5% CO2. During exposure to the compounds, the medium was replaced with treatment medium containing different agents.
Patients and specimens
Forty patients who had undergone radical cystectomy for urothelial (transitional cell) carcinomas of the bladder at Department of Urology of the Union Hospital of Tongji Medical College between 2011 and 2012 were selected for this study. None of the patients received anticancer therapy before surgical resection. A summary of clinical data is presented in Table 1. Fresh bladder cancer tissues and surrounding nontumour adjacent bladder tissues (at least 2 cm distant from the tumour site) were evaluated by at least two experienced pathologists. The 2004 World Health Organization Consensus Classification and Staging System for bladder neoplasms was used to classify specimens (Chan, 2005). All tumours were staged as non-invasive (pTa) tumours, tumours with invasion of the lamina propria (pT1), and tumours with invasion of the muscularis propria or beyond (pT2-pT4). Histologically, the study included patients with low-grade papillary urothelial carcinomas (LGPUC) and high-grade (papillary and non-papillary) urothelial carcinomas (HGUC). Each sample was divided into fragments, which were snap frozen in liquid nitrogen and stored at −80°C for RNA extraction. The research was approved by the Institutional Review Board of Tongji Medical College of Huazhong University of Science and Technology, and informed consent was obtained from each patient before surgery.
Table 1.
EZH2 expression and clinicopathological factors
| Expression of EZH2 | |||||||
|---|---|---|---|---|---|---|---|
| Factors | Case | P-value | Low | % | High | % | |
| Overall | 40 | n = 12 | n = 28 | ||||
| Gender | Male | 25 | 7 | 58 | 18 | 64 | 1.000 |
| Female | 15 | 5 | 42 | 10 | 36 | ||
| Age at surgery | <55 | 19 | 8 | 67 | 11 | 39 | 0.112 |
| >55 | 21 | 4 | 33 | 17 | 61 | ||
| Size (mm) | <10 | 18 | 6 | 50 | 12 | 43 | 0.803 |
| 10–30 | 13 | 3 | 25 | 10 | 36 | ||
| >30 | 9 | 3 | 25 | 6 | 21 | ||
| Depth of tumour invasion | T = 1, 2 | 22 | 7 | 58 | 15 | 54 | 0.781 |
| T = 3, 4 | 18 | 5 | 42 | 13 | 46 | ||
| Lymph node metastasis | Absent | 25 | 9 | 75 | 16 | 57 | 0.453 |
| Present | 13 | 3 | 25 | 10 | 36 | ||
| Unknown | 2 | 0 | 0 | 2 | 7 | ||
| Distant metastasis | Absent | 15 | 5 | 42 | 10 | 36 | 1.000 |
| Present | 25 | 7 | 58 | 18 | 64 | ||
| Lymphatic permeation | Absent | 22 | 6 | 50 | 16 | 57 | 0.677 |
| Present | 18 | 6 | 50 | 12 | 43 | ||
| Venous permeation | Absent | 26 | 9 | 75 | 17 | 61 | 0.613 |
| Present | 14 | 3 | 25 | 11 | 39 | ||
| Tumour node metastasis stage | I, II | 22 | 10 | 83 | 12 | 43 | 0.018 |
| III, IV | 18 | 2 | 17 | 16 | 57 | ||
| Grade | LGPUC | 13 | 8 | 67 | 5 | 18 | 0.008 |
| HGUC | 27 | 4 | 33 | 23 | 82 | ||
In vitro cell viability assay
Cell viability was determined by the cell counting kit-8 assay (CCK-8; Dojindo Laboratories, Kumamoto, Japan). Absorbance at 450 nm was measured on Opsys MR spectrophotometer (DYNEX Technologies, Denkendorf, Germany), using Windows Revelation QuickLink software. Cells were plated at a density of 1 × 10⁴ cells per well in 96-well plates, and then allowed to adhere overnight. At the end of the treatment period, 10 μL of water-soluble formazan dye was added to each well, and incubated for additional 2 h at 37°C in the dark. Each experimental condition was performed in triplicate and repeated at least three times. All values were normalized with respect to the viability of untreated cells.
Morphological observation of apoptotic cells
The changes in cellular morphology were detected by Hoechst 33258 staining (Sigma). Cells were seeded in six-well plates and allowed to adhere overnight. After drug incubation, the cells were fixed with 4% formaldehyde in PBS at 4°C for 10 min. After three washes with PBS, the cells were stained with 10 mg L−1 Hoechst 33258 at 4°C in the dark for 20 min. Morphological characteristics of apoptosis, such as cell shrinkage and nuclear condensation, were analysed using a fluorescence microscope (Olympus, Tokyo, Japan).
Quantitation of apoptosis rates
Apoptosis and necrosis were assessed by flow cytometry following fluorescein isothiocyanate (FITC)-conjugated Annexin V (Annexin V-FITC) and propidium iodide (PI) staining (BD Pharmingen, San Diego, CA, USA). Briefly, after a 24 h drug treatment, cells were collected by trypsinization, pooled, washed twice with PBS and incubated with Annexin V-FITC and PI, according to the manufacturer's instructions. Cells were analysed by flow cytometry (FACScan, Becton Dickinson, Mountain View, CA, USA) according to methods published previously. Data analysis was performed using CellQuest analysis software (Becton Dickinson) and expressed as percentage of positive cells.
Western blot analysis
Cells were collected, and lysed with 1 × cell lysis buffer (Promega, Madison, WI, USA). The tumour tissues were surgically excised from the mice and frozen in liquid nitrogen. Then the tissues were homogenized in tumour lysis buffer, and the lysates were collected. Protein concentration was determined using a BCA Protein Assay kit (Thermo Fisher Scientific, Waltham, MA, USA), as described previously. Equal amounts of total proteins were boiled in sample buffer and separated by SDS-PAGE. Following alternative immunoblot analysis with antibodies [mouse anti-human GAPDH, rabbit anti-human X-linked IAP (XIAP), rabbit anti-human EZH2 (Santa Cruz Biotechnology, Santa Cruz, CA, USA); mouse anti-human caspase-3, mouse anti-human caspase-9 (Cell Signaling Technology, Danvers, MA, USA) ], immunoreactive bands were visualized by using the specific HRP-conjugated secondary antibody and the ECL system (Amersham Biosciences, Piscataway, NJ, USA). The optical density of the bands (integrated area in arbitrary units AU) was measured by using NIH Image (National Institutes of Health, Bethesda, MD, USA).
RT-PCR analysis
Total RNA was isolated with the Trizol Reagent (Invitrogen by Life Technologies, Carlsbad, CA, USA), according to the manufacturer's instructions, and then converted to cDNA using random primers and Transcriptor First Strand cDNA Synthesis Kit (Takara Biotechnology, Dalian, China). Quantitative real-time PCR (qPCR) analysis was performed using the Applied Biosystems 7700HT Real-Time PCR System. The PCR primers for EZH2 and GAPDH were designed by Premier Primer 5.0 software (Premier Biosoft International, Palo Alto, CA, USA) (Table 2). PCR reactions were performed as follows: an initial predenaturation step for 30 s at 95°C, followed by amplification of 40 cycles at 95°C for 5 s and at 60°C for 30 s, melting curve analysis was performed at the end. Ct value of each sample was calculated and the transcript levels were analysed by 2−ΔΔCt method.
Table 2.
Sequences in the study
| Oligonucleotides | Sequence (5′- to 3′) |
|---|---|
| Pre-miR-101 forward | TGCTGTACAGTACTGTGATAACTGAAGTTTTGGCCACTGACTGACTTCAGTTAACAGTACTGTA |
| Pre-miR-101 reverse | CCTGTACAGTACTGTTAACTGAAGTCAGTCAGTGGCCAAAACTTCAGTTATCACAGTACTGTAC |
| Primers for quantitative real-time PCR | |
| U6 forward | CTCGCTTCGGCAGCACATA |
| U6 reverse | AACGCTTCACGAATTTGCGT |
| GAPDH forward | GAAGGTGAAGGTCGGAGTC |
| GAPDH reverse | GAAGATGGTGATGGGATTTC |
| EZH2 forward | CCCTGACCTCTGTCTTACTTGTGGA |
| EZH2 reverse | ACGTCAGATGGTGCCAGCAATA |
Quantification of miRNA expression
The levels of mature miRNAs in tissues and cell lines were determined using Bulge-Loop miRNAs qPCR Primer Set (RiboBio Co., Ltd., Guangzhou, China). After cDNA was synthesized with a miRNA-specific stem-loop primer, qPCR was performed with the specific primers. The miRNA levels were normalized to those of U6 small nuclear RNA.
miRNA target prediction
miRNA targets were predicted using the algorithms, including TargetScan, miRDB, RNA22, and miRanda Human miRNA Targets. To identify the genes commonly predicted by these four different algorithms, results of predicted targets were intersected using miRWalk.
Pre-miR-101 construct and stable transfection
According to the pre-miR-101 (5′-TACAGTACTGTGATAACTGAA-3′) sequence documented in miRNA Registry database, oligonucleotides encoding miR-101 precursor (Table 1) were subcloned into the BamHI and XhoI restrictive sites of pPG/miR/EGFP (GenePharma Co., Ltd., Shanghai, China), and verified by DNA sequencing. The plasmids pPG/miR/EGFP and pPG-miR-101-EGFP were transfected into tumour cells, and stable cell lines were screened by administration of Blasticidin (Invitrogen). Additionally, anti-miR-101 or negative control inhibitors (RiboBio Co., Ltd.) were transfected into tumour cells with Lipofectamine 2000 (Life Technologies, Inc.).
Luciferase reporter assay
To construct a luciferase reporter plasmid, human EZH2 3′-untranslated region (UTR) fragment containing putative binding sites for miR-101 was inserted between the restrictive sites XhoI and NotI of firefly/Renilla luciferase reporter vector pmiR-RB-REPORT (RiboBio Co., Ltd.). The mutated 3′-UTR generated using the fusion PCR method had three bases changed, from GUACUGU to CUAGUCU, at each of the two putative miR-101-binding sites. The inserts from all cloned plasmids were validated by DNA sequencing analysis. For luciferase reporter assays, 5 × 10⁴ cells were initially plated in a 24-well plate, and then transfected with pmiR-RB-EZH2 3′-UTR (30 ng) or its mutant construct. Firefly and Renilla luciferase activities were consecutively measured 24 h after transfection following the dual-luciferase assay instruction (Promega). The Renilla luciferase signal was normalized to the internal firefly luciferase transfection control.
Gene expression microarray
Total RNA from six tubes of T24 cells (three from the control group, three from the GA and MJ co-treatment group) were harvested using TRIzol (Invitrogen) according to the manufacturer's protocol. The RNA content was measured using a Nanodrop ND-1000 spectrophotometer, and denaturing gel electrophoresis was conducted. Next, the samples were amplified, labelled using the Agilent Quick Amp labelling kit, and hybridized to Agilent whole human genome 4 × 44 K oligo microarray (Agilent Technologies, Palo Alto, CA, USA). After hybridization and washing, the processed slides were scanned with the Agilent DNA microarray scanner using the settings recommended by Agilent Technologies. The resulting text files extracted from the Agilent Feature Extraction Software (version 11.0.1.1, Agilent Technologies) were imported into the Agilent GeneSpring GX software (version 12.1, Agilent Technologies) for further analysis. Background intensity was cut off before normalization. The microarray datasets were normalized in GeneSpring GX using the Agilent FE one-colour scenario (mainly median normalization). Genes with an fold change of ≥2 and a P-value of ≤0.05 between two groups were identified as differentially expressed genes. Functional analysis of the differentially expressed genes was performed using gene ontology (GO; http://www.geneontology.org/) and the KEEG PATHWAY Database (http://www.genome.jp/kegg/pathway.html).
Tumour xenografts and in vivo treatment
T24 cells (1 × 10⁶) were injected s.c. into 4- to 6-week-old nude mice in 100 μL PBS to produce tumour growth. When the tumour volumes reached an average of approximately 100 mm3, mice were randomly divided into four groups, and each group contained six mice, half male and half female. MJ at 60 mg kg−1 or GA at 1.5 mg kg−1 or their combination was administered i.v. to animals once every other day, starting one day after cell inoculation, until day 21. GA was dissolved in 0.9% NaCl, and MJ was dissolved in a lipid formulation –LPF (B Braun Melsungen, Melsungen, Germany). Control mice were treated with the vehicle alone. These doses of MJ and GA were found to be well tolerated by animals in our preliminary experiments. The tumour volumes were measured every other day in two dimensions with Vernier calipers and calculated using the following equation: length × width2 × 0.5. After .3 weeks of treatment with the drugs, the mice were killed and weighed simultaneously. No mice died or had to be killed before the end of the in vivo experiment. The tumours were removed, photographed and weighed. Additionally, tumour tissues from the in vivo experiments were collected for Western blot analysis and qPCR. Mice were housed under a 12 h light–dark cycle routinely fed basal rodent chow and watered ad libitum. All procedures for the animal experiments were approved by the Animal Care Committee of Tongji Medical College.
Statistical analysis
Statistical analysis was performed using the Statistical Package for the Social Sciences (SPSS) 15.0 software (SPSS Inc., Chicago, IL, USA) and with GraphPad Prism Version 5 (GraphPad Software, La Jolla, CA, USA). For the statistical analysis of clinicopathological features and mRNA expression of EZH2, EZH2 expression in tumour tissue was divided by that in matched normal mucosa (T/N expression ratio). Samples were then classified into two groups, with the low-expression group having a T/N ≤2, and the high expression group having a T/N >2. Associations between categorical variables were assessed using the X2 test. Student's t-test was used to compare continuous variables, summarized as means ± SD, between two groups. P < 0.05 was considered statistically significant.
Results
MJ sensitizes GA-induced growth inhibition of bladder cancer cells
To determine whether MJ possesses a synergistic anticancer effect when combined with GA in human bladder cancer cells, GA, MJ and GA in combination with MJ were first evaluated for anticancer activity in T24, BIU-87 and FB cells by the CCK-8 assay. The results indicated that all the cells responded in a dose- and time-dependent manner to GA (Figure 1A). MJ inhibited cell viability of T24 and BIU-87 cells, but not human fibroblast cells, in a dose- and time-dependent fashion (Figure 1B). Moreover, the inhibitory effects of GA on viability were significantly enhanced when it was co-administered with MJ in T24 and BIU-87 cells (Figure 1C). Our data showed that 2.5, 5, 7.5 μΜ GA and 0.75 mM MJ alone, when compared with the untreated control, decreased cell viability of T24 cells by 15.6, 34.0, 53.9 and 19.7% for 24 h, but the two agents used together reduced that of the cells by 68.2, 87.6 and 92.7%, respectively, which was significantly higher than the sum of their separate effects (Figure 1C). Similar cooperative effects could be seen in BIU-87 cells (Figure 1C). These findings suggest that MJ can potentiate the inhibitory effect of GA on the growth bladder cancer cells. In addition, GA in combination with MJ showed no enhanced cytotoxicity in FB cells (Figure 1C). Together, these results indicate that MJ may be a promising candidate to selectively sensitize cancer cells to GA treatment.
Figure 1.

MJ sensitizes GA-induced growth inhibition of bladder cancer cells in vitro. (A) T24, BIU-87 and fibroblasts (FB) were incubated with DMSO (5 mM) or indicated concentrations of GA (1.0, 2.5, 5.0, 7.5 μΜ) for different periods of time (24, 48 and 72 h). (B) All cells were treated with DMSO (5 mM) or different concentrations of MJ (0.5, 0.75, 1.5 and 2.0 mM) for different periods of time (24, 48 and 72 h). (C) All cells were pre-incubated with or without 0.75 mM MJ for 3 h, followed by treatment with GA (2.5, 5.0, 7.5 μΜ) for 24 h. Cell viability was detected by the CCK-8 assay, as described in Methods. * P < 0.05 versus control. # P < 0.05 versus GA treatment alone. Results are the means ± SD in triplicate.
MJ enhances GA-induced apoptosis
To confirm that apoptosis was involved in MJ-enhanced cell death, we examined apoptosis induced by MJ in combination with GA. Hoechst 33258 staining indicated that the administration of GA resulted in condensed and odd-shaped nuclei, characteristic changes of apoptosis. Treatment of cells with MJ further enhanced GA-induced apoptosis of T24 and BIU-87 cells (Figure 2A, B). The Annexin V/PI-staining flow cytometry analysis was performed to quantify the number of apoptotic cells. Compared with the untreated control, both the low concentration of GA and MJ alone increased the cellular apoptotic rate to a small extent. Meanwhile, the maximum increase in apoptotic cells was noted when the two agents were used in combination, which was significantly higher than the sum of apoptotic rates induced by the drugs separately (Figure 2C, D). In addition, compared with apoptotic cells, the necrotic cells made up only a small section of the dead cells.
Figure 2.

MJ enhances GA-induced apoptosis. T24 cells were stimulated for 24 h with different concentrations of GA (2.5, 5.0 μΜ) and MJ (0.75, 1.5 mM), alone or as combination of GA (2.5 μΜ) and MJ (0.75 mM). Then, cells were harvested for Hoechst 33258 staining florescence microscopy (A; magnification 200×) as well as annexin V/PI double staining and flow cytometry (C). BIU-87 cells were incubated with indicated concentrations of GA (5.0, 7.5 μΜ) and MJ (0.75, 1.5 mM), alone or a combination of GA (5.0 μΜ) and MJ (0.75 mM) for 24 h. Cells were then collected for Hoechst 33258 staining florescence microscopy (B; magnification 200×), and annexin V/PI double staining and flow cytometry (D). * P < 0.05 versus control. For T24 cells, # P < 0.05 versus 2.5 μΜ GA treatment alone. For BIU-87 cells; # P < 0.05 versus 5.0 μΜ GA treatment alone. Results are the means ± SD in triplicate.
MJ increases GA-induced activation of caspase-3 and caspase-9, and down-regulation of XIAP
Next we examined the proteolytic induction of caspase-9, the apical caspase in the mitochondria-initiated apoptosis pathway, and caspase-3, the critical executioner of apoptosis, by Western blot. The results indicated that GA alone induced the production of caspase-3 and caspase-9 precursors to their active products and induced XIAP cleavage in a dose-dependent fashion in T24 (Figure 3A) and BIU-87 (Figure 3B) cells. Co-treatment of cells with MJ further increased GA-induced activation of caspase-3 and caspase-9, as well as down-regulating the level of XIAP protein at relatively low dosage, while MJ itself showed a minimal effect.
Figure 3.

MJ increases GA-induced activation of caspase-3 and caspase-9 and XIAP down-regulation. (A) T24 cells were treated with DMSO (5 mM) or different concentrations of GA (2.5, 5.0 μΜ) or MJ (0.75, 1.5 mM), alone or a combination of GA (2.5 μΜ) and MJ (0.75 mM) for 24 h. Cells were then lysed and analysed for caspase-3 (processing), caspase-9 (processing) and XIAP protein levels by Western blot. (B) BIU-87 cells were incubated with DMSO (5 mM) or the indicated concentrations of GA (5.0, 7.5 μΜ) and MJ (0.75, 1.5 mM), alone or a combination of GA (5.0 μΜ) and MJ (0.75 mM) for 24 h. Then, the protein levels of caspase-3 (processing), caspase-9 (processing), and XIAP were analysed by Western blot. GAPDH was used as the equivalent loading control. * P < 0.05 versus control. For T24 cells, # P < 0.05 versus 2.5 μΜ GA treatment alone. For BIU-87 cells, # P < 0.05 versus 5.0 μΜ GA treatment alone. Results are the means ± SD in triplicate.
MJ enhances GA-induced inhibition of EZH2 expression
We further investigated the mechanisms underlying the reduction of cell viability and the induction of apoptosis by detecting the expression of EZH2. Our data showed that EZH2 levels in cancerous tissues were significantly higher than those in the noncancerous tissues (Figure 4A). A significant relationship was found between high EZH2 expression and high stage cancer (III and IV; P = 0.018) and the histological score (HGUC; P = 0.008, Table 1). Because EZH2 plays an important role in bladder cancer development, we examined whether GA and MJ exhibit anticancer effects by targeting EZH2. GA reduced the expression of EZH2 in a dose-dependent manner in T24 (Figure 4B, D) and BIU-87 (Figure 4C, E) cells, while MJ showed slight effects. Moreover, co-treatment of cells with MJ significantly enhanced GA-induced down-regulation of EZH2 expression at a relatively low dosage.
Figure 4.
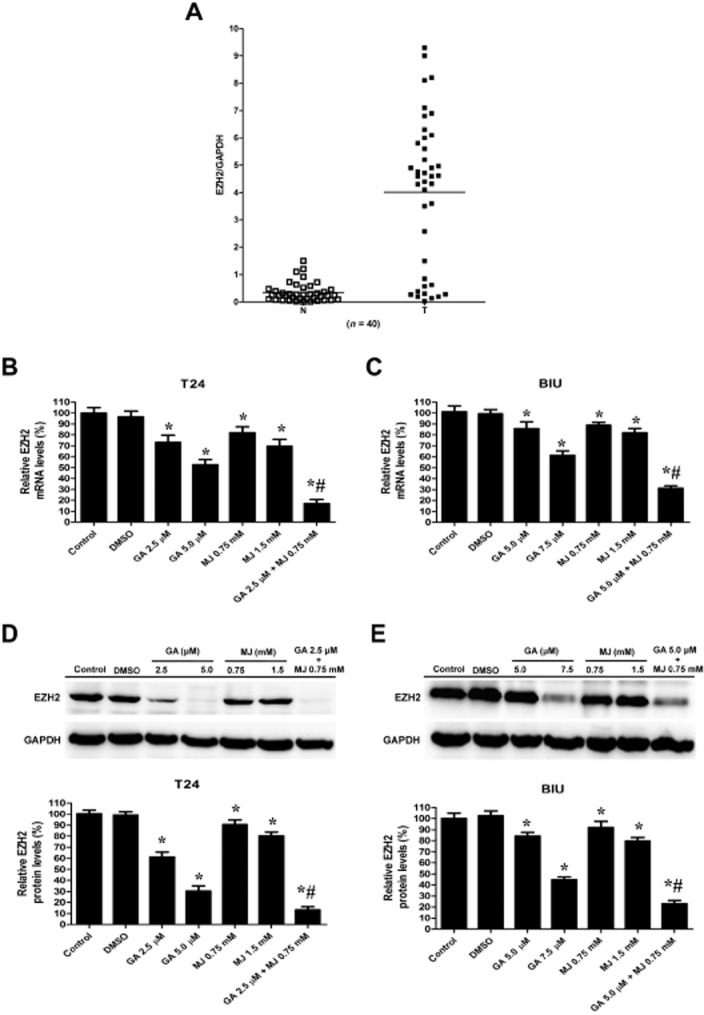
MJ enhances GA-induced down-regulation of EZH2 expression. (A) Real-time quantitative RT-PCR analysis of bladder cancer tissues (n = 40) revealed increased EZH2 mRNA level in bladder cancer, compared with adjacent normal tissue. Data are presented as individual samples with the line indicating the mean. T24 cells were treated with DMSO (5 mM) or different concentrations of GA (2.5, 5.0 μΜ) or MJ (0.75, 1.5 mM), alone or a combination of GA (2.5 μΜ) and MJ (0.75 mM) for 24 h. Then, cells were obtained for real-time quantitative RT-PCR (B) and Western blot (D) to detect the mRNA and protein levels of EZH2 respectively. BIU-87 cells were incubated with DMSO (5 mM) or indicated concentrations of GA (5.0, 7.5 μΜ) and MJ (0.75, 1.5 mM), alone or a combination of GA (5.0 μΜ) and MJ (0.75 mM) for 24 h. Cells were then analysed by real-time quantitative RT-PCR (C) and Western blot (E) for EZH2 mRNA and protein levels, respectively. GAPDH was used as the internal control in two experiments. * P < 0.05 versus control. For T24 cells, # P < 0.05 versus 2.5 μΜ GA treatment alone. For BIU-87 cells, # P < 0.05 versus 5.0 μΜ GA treatment alone. Results are the means ± SD in triplicate.
MJ potentiates GA-induced up-regulation of miR-101 expression
Previous studies have indicated that miRNAs function as endogenous repressors of target genes by interfering with the expression of tumour-associated genes (Wang et al., 2009; Sachdeva and Mo, 2010). This function of miRNAs plays a crucial role in the expression of EZH2 (Ciarapica et al., 2009; Lu et al., 2011). Here, we sought to find out whether down-regulation of the carcinogenic gene EZH2 by GA and MJ was associated with miRNAs. Four commonly utilized target prediction algorithms (TargetScan, miRDB, RNA22 and miRanda) were investigated for possible interactions with EZH2. The intersection of these three algorithms identified four potential miRNA candidates: miR-101, miR-138, miR-600 and miR-1301. Our data showed that co-treatment of GA and MJ at low dosages, which were slightly effective when used separately, up-regulated the expression of miR-101 significantly when given as a combination (Figure 5A, B), while the other three miRNAs were not affected. To confirm the role of miR-101 in bladder cancer, we analysed the expression of miR-101 in the same set of 40 pairs of bladder cancers and their adjacent normal tissues, which were used to detect EZH2 expression. As shown in Figure 5C, 32 of 40 cases exhibited a marked decrease in relative levels of miR-101 copy number in cancer tissues as compared with that in matched normal tissues.
Figure 5.

MJ enhanced GA-induced up-regulation of miR-101 expression. (A) T24 cells were treated with different concentrations of GA (2.5, 5.0 μΜ) or MJ (0.75, 1.5 mM), alone or a combination of GA (2.5 μΜ) and MJ (0.75 mM) for 24 h. Cells were then harvested and RNA was extracted for real-time quantitative RT-PCR to detect miR-101, miR-138, miR-600, and miR-1301 mRNA levels. (B) BIU-87 cells were incubated with indicated concentrations of GA (5.0, 7.5 μΜ) and MJ (0.75, 1.5 mM), alone or a combination of GA (5.0 μΜ) and MJ (0.75 mM) for 24 h. Then cells were collected and RNA was isolated to determine the mRNA levels of miR-101, miR-138, miR-600, and miR-1301. (C) Real-time quantitative RT-PCR analysis of bladder cancer tissues (n = 40) shows that miR-101 is down-regulated in tumours compared with adjacent normal tissue. Data are presented as individual samples with the line indicating the mean. Each experiment was duplicated and the value for miRNAs was normalized to U6. * P < 0.05 versus control. For T24 cells, # P < 0.05 versus 2.5 μΜ GA treatment alone. For BIU-87 cells, # P < 0.05 versus 5.0 μΜ GA treatment alone. Results are the means ± SD in triplicate.
miR-101 directly targets EZH2 and knockdown of miR-101 suppresses the growth inhibition induced by GA in combination with MJ
In order to ascertain that miR-101 may be directly involved in suppressing the expression of EZH2, the PCR products containing intact target sites or a mutation of miR-101 seed recognition sequence (Figure 6A) were cloned into the luciferase reporter vector. The plasmids were transfected into T24 and BIU-87 cells stably transfected with empty vector (mock) or miR-101 precursor. The Renilla luciferase activity normalized to that of firefly was significantly reduced in the tumour cells stably transfected with miR-101 precursor (Figure 6B), and the effect was abolished by mutating the predicted miR-101-binding site within the 3′-UTR of EZH2, indicating a specific suppressive effect of miR-101 on EZH2 (Figure 6B). Meanwhile, knockdown of miR-101 with anti-miR-101 inhibitor increased the luciferase activity in T24 and BIU-87 cells (Figure 6C), whereas mutation of miR-101 recognition site abolished these effects (Figure 6C). Moreover, transfection of miR-101 precursor into two bladder cancer cell lines caused a loss of EZH2 protein expression (Figure 6D). These results collectively demonstrate that EZH2 is indeed a direct target of miR-101. Furthermore, transfection of anti-miR-101 inhibitor blocked the expression of miR-101 induced by the combination of GA and MJ (Figure 6E), and consequently restored miR-101-induced loss of EZH2 protein expression (Figure 6F). In addition, we also found that knockdown of miR-101 increased cell viability (Figure 6G), and inhibited cell apoptosis induced by GA and MJ co-treatment in T24 and BIU-87 cells (Figure 6H, I).
Figure 6.
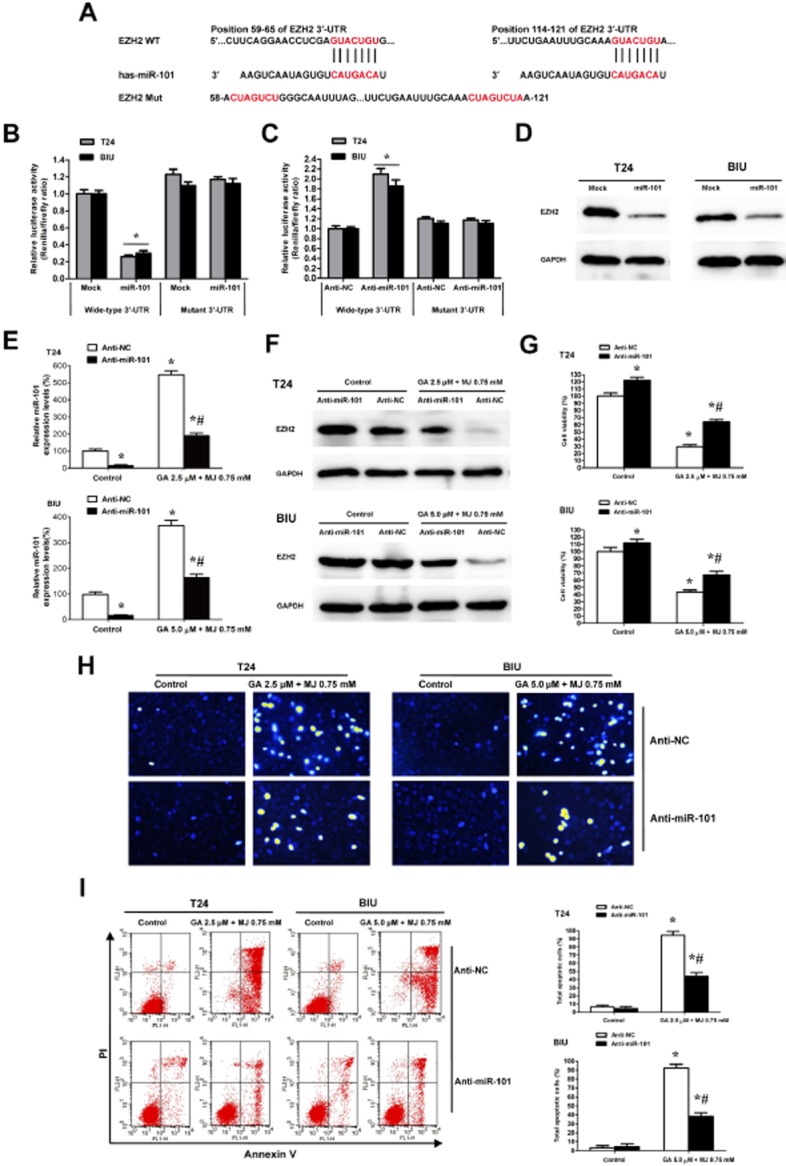
miR-101 directly targets EZH2 and knockdown of miR-101 suppresses the antitumour effect induced by GA in combination with MJ. (A) 3′-UTR of EZH2 has two presumed sites that can bind with the seed region of miR-101. Sequence of the intact miR-101-binding site (wide-type; WT) and its mutation (Mut) within the luciferase reporter vector is shown. The mutated 3′-UTR has three bases changed, from GUACUGU to CUAGUCU. (B) Stable transfection of miR-101 precursor into T24 and BIU cells resulted in decreased luciferase activities of EZH2 3′-UTR reporter, when compared with those stably transfected with empty vector (mock). These effects were abolished by the mutation in the putative miR-101-binding site within the 3′-UTR of EZH2. (C) Transfection of anti-miR-101 inhibitor (100 nM) into T24 and BIU cells increased the luciferase activity when compared with those transfected with negative control inhibitor (anti-NC, 100 nM), whereas mutation of miR-101 recognition site abolished these effects. (D) Western blots indicated that stable transfection of miR-101 precursor resulted in decreased EZH2 protein levels in T24 and BIU-87 cells. Transfection of anti-miR-101 inhibitor (100 nM) blocked expression of miR-101 induced by the combination of GA and MJ (E), and consequently restored the miR-101-induced loss of EZH2 protein expression (F). CCK-8 assay indicated that transfection of anti-miR-101 inhibitor (100 nM), but not of anti-NC, resulted in increased cell viability in T24 and BIU cells treated with or without the combination of GA and MJ (G). Hoechst 33258 staining (H) and Annexin V/PI double staining and flow cytometry (I) revealed the decreased apoptosis in GA and MJ treated cells transfected with anti-miR-101 inhibitor (100 nM). * P < 0.05 versus control, # P < 0.05 versus anti-NC. Results are the means ± SD in triplicate.
GA and MJ co-treatment changes the gene expression profile
We used microarray gene expression profile analysis to provide a more comprehensive view of the mechanism. Our results revealed that the expression of 3582 genes was significantly altered in the combination-treated group compared with those in the untreated control group (data not shown). To determine whether specific biological pathways or functional gene groups were differentially affected by GA and MJ co-treatment, we analysed our microarray dataset using the GO and KEGG software (Supporting Information Tables S1 and S2). We found significant down-regulation of 23 signalling pathways including the DNA replication pathway, cell cycle pathway and pathways in cancer (Table 3). Many genes in the cell cycle pathway were consistently down-regulated, that is Cyclin A2 (CCNA2), Cyclin B1 (CCNB1) and Cyclin E1 (CCNE1) were reduced by 20.3, 7.6 and 2.4 times, respectively, the expression of the cyclin-dependent kinase 1 (CDK1) was down-regulated by 25.4 times, and the transcriptional factors E2F2 and E2F1 were reduced by 27.0 and 11.6 times, respectively. Intriguingly, genes associated with pathways in cancer were also down-regulated, that is B-cell lymphoma-2 (BCL2), fibroblast growth factor receptor 3 (FGFR3) and MDM2 at fold change of −5.6, −2.0, −2.8 and −2.0 respectively. Altogether, 501 GO terms, including tumour-related GO terms such as cell cycle, cell division and cell proliferation were significantly decreased.
Table 3.
The pathways most enriched as found by KEGG
| Pathway ID | Pathway name | Selection counts2006 | Count2006 | Enrichment2008 |
|---|---|---|---|---|
| Down-regulated pathways | ||||
| hsa03030 | DNA replication | 27 | 36 | 22.19064 |
| has04110 | Cell cycle | 48 | 124 | 21.17736 |
| hsa03460 | Fanconi anaemia pathway | 30 | 52 | 19.51810 |
| hsa03430 | Mismatch repair | 14 | 23 | 9.794446 |
| hsa03440 | Homologous recombination | 15 | 28 | 9.372881 |
| hsa00240 | Pyrimidine metabolism | 25 | 101 | 6.649322 |
| hsa03410 | Base excision repair | 13 | 33 | 6.200618 |
| hsa03420 | Nucleotide excision repair | 15 | 46 | 5.828512 |
| hsa04114 | Oocyte meiosis | 24 | 112 | 5.205605 |
| hsa00230 | Purine metabolism | 30 | 166 | 4.769290 |
| hsa05166 | Human T lymphocyte virus type 1 infection | 38 | 263 | 3.634506 |
| hsa04115 | p53 signalling pathway | 15 | 68 | 3.609288 |
| hsa00670 | One carbon pool by folate | 7 | 19 | 3.355224 |
| hsa05222 | Small cell lung cancer | 17 | 87 | 3.345462 |
| hsa05200 | Pathways in cancer | 43 | 328 | 3.107403 |
| hsa00900 | Terpenoid backbone biosynthesis | 7 | 21 | 3.053525 |
| hsa04914 | Progesterone-mediated oocyte maturation | 16 | 86 | 2.938970 |
| hsa03013 | RNA transport | 24 | 157 | 2.824326 |
The count of the DE genes' entities directly associated with the listed Pathway ID.
The count of the chosen background population genes' entities associated with the listed pathway ID.
The enrichment score value of the pathway ID, it equals ‘–log10(P-value)’.
MJ enhances GA-induced growth inhibition of bladder cancer cells in vivo
We further assessed the in vivo effects of GA combined with MJ on the growth of bladder cancer xenograft tumours. As shown in Figure 7A, there was no significant difference in the average body weight for each cohort of mice throughout the in vivo experiments. Meanwhile, the tumour inhibitory ratios of MJ, GA and the combination group on day 21 were 18.4, 32.5 and 78.5% respectively (Figure 7B). MJ and GA also reduced the tumour weight significantly when given as a combination (Figure 7C, D). Moreover, compared with the other three groups, the mRNA and protein levels of EZH2 were dramatically down-regulated, and the mRNA level of miR-101 was up-regulated in the GA and MJ co-treatment group (Figure 7E, F), which was consistent with the results in vitro.
Figure 7.

MJ enhances GA-induced growth inhibition of bladder cancer cells in vivo. Hypodermic injection of T24 cells into athymic nude mice established s.c. xenograft tumours. Treatment with 1.5 mg kg−1 GA, 60 mg kg−1 MJ, or their combination, given i.v., started when the tumour volumes reached an average of approximately 100 mm3 and lasted until day 21 when mice were killed. Whole tumour tissues were processed as described in Methods. The experiment was performed twice. (A) The body weight of pre-dose and post-dose. (B) Data are expressed as the percentage inhibition of tumour growth. (C) Analysis of tumour weight. (D) Appearance of tumour from each cohort of mice on day 21 after T24 cells hypodermic injection. (E) Real-time quantitative RT-PCR analysis of the mRNA levels of EZH2 and miR-101. (F) Tumour lysates were immunoblotted for EZH2. * P < 0.05 versus mock. # P < 0.05 versus GA treatment alone. Results are the means ± SD in triplicate.
Discussion and conclusions
GA has been reported to inhibit cell growth by inducing apoptosis in hepatoma and breast cancer cells (Zhang et al., 2004; Yang et al., 2007), but the mechanism of its selective cytotoxicity is unclear. MJ has been found to selectively exhibit cytotoxicity towards malignant cells while sparing normal blood lymphocytes (Fingrut and Flescher, 2002). However, the relatively high therapeutic dose needed has been the potential drawback for the clinical use of MJ. Nearly all curative chemotherapy regimens for cancer now employ multi-agent drug combinations (Frei and Antman, 2003). They can maximize cell kill while minimizing host toxicities by using agents with non-overlapping dose-limiting toxicities and increase the range of drug activity against tumour cells with endogenous resistance to specific types of therapy (Heyfets and Flescher, 2007). Consequently, we evaluated the combined effects of GA and MJ, to search for super-additive interactions. Our data showed that GA inhibited cell viability of bladder cancer cell lines T24 and BIU-87 in a dose- and time-dependent manner, and MJ significantly enhanced the this inhibitory effect of GA. Moreover, the combination of GA and MJ could synergistically inhibit the growth of T24 cell in vivo. These findings collectively suggest that MJ is a promising candidate for sensitizing cancer cells to GA treatment. A series of synthetic jasmonate derivatives have been investigated and some of them exhibit smaller IC50s compared with MJ (Ishii et al., 2004). Also a number of GA derivatives have been designed that show better physicochemical properties than GA (Sun et al., 2012; Zhang et al., 2012) and are safer with lower toxicity (Chen et al., 2012). Thus, the combinations of more active jasmonate derivatives and GA derivatives could probably provide superior therapeutic indexes. Furthermore, the growth of primary human fibroblasts was almost unaffected by MJ alone. These results correspond with previous findings showing that MJ specifically targets transformed cells (Fingrut and Flescher, 2002; Rotem et al., 2005). It was highlighted in a previous report that GA has a selective anticancer effect because of its higher distribution and longer retention time in tumour cells than in normal cells (Yang et al., 2007). It is noteworthy that the selective cytotoxic effect of GA was not apparent in our study, which might be due to the different cell types, doses or reaction time. Nevertheless, GA in combination with MJ exhibited a selective cytotoxicity, suggesting that co-treatment with MJ is an efficient way to increase the selective cytotoxicity of GA.
In our previous study we demonstrated that MJ induces prostate cancer cell apoptosis mainly through an effect on the intrinsic mitochondrial apoptotic pathway (Jiang et al., 2011). GA has also been shown to compete for BH3 peptide binding sites on several anti-apoptotic members of the Bcl-2 family and neutralize the ability of these proteins to suppress the release of apoptogenic proteins from isolated mitochondria (Zhai et al., 2008). In the present study, we showed that MJ enhances GA-induced apoptosis in T24 and BIU-87 cells and this was accompanied by caspase 3 and 9 activation. These findings provide evidence that the mitochondrial apoptotic pathway is activated both by GA alone and GA in combination with MJ. It is well recognized that XIAP, the most potent member of the human IAP protein to suppress apoptotic cell death (Sun et al., 2000), can be cleaved into the amino-terminal BIR1-2 and BIR3-RING finger fragments by activated caspase-3 during apoptosis (Deveraux et al., 1999). The fact that treatment of bladder cancer cells with the combination of GA and MJ resulted in a synergistic inhibition of XIAP expression was, at least partly, due to the enhanced activity of caspase-3.
EZH2, the catalytic subunit of PRC2, enhances tumourigenesis and is overexpressed in many types of cancer (Bachmann et al., 2006; Matsukawa et al., 2006; Cao et al., 2008). Our results demonstrated that high EZH2 mRNA expression in bladder cancer was correlated with clinicopathological features including tumour stage and grade, which was in agreement with previous studies (Weikert et al., 2005; Wang et al., 2012). Overexpression of EZH2 results in local and genome-wide elevations of the repressive H3K27me3 histone modification, leading to widespread gene repression (Kaur and Cole, 2013). It has been reported that pharmacological disruption of the EZH2-containing PRC2 complex selectively induces apoptosis in cancer cells (Tan et al., 2007). Thus, EZH2 appears to be an attractive target for therapeutic intervention. Our results indicated that GA-induced growth inhibition of bladder cancer cells was significantly enhanced by MJ, which was accompanied by decreased mRNA and protein expression of EZH2 both in vitro and in vivo. In fact, some reports have convincingly shown that inhibition of EZH2 by either DZNep or RNAi leads to reduced proliferation in a subset of breast cancer cell lines (Tan et al., 2007) and reduced proliferation and invasiveness in prostate cancer cell lines (Bryant et al., 2007; Tan et al., 2007). Therefore, we propose that a combination of GA and MJ may be used as chromatin modifying drugs to induce antitumour effects against bladder cancer cells. Additionally, microarray gene expression analysis showed that the cyclins (CCNA2, CCNB1, and CCNE1), the E2Fs (E2F1 and E2F2), BCL2, MDM2 and FGFR3, which are closely associated with the progression of bladder cancer, were significantly inhibited by GA and MJ. By functional analysis, we found that the DNA replication pathway, cell cycle pathway and pathways in cancer were down-regulated, and the GO terms related to cell cycle, cell division and cell proliferation were decreased by GA and MJ. Therefore, the cell cycle and DNA replication may be involved in the anticancer effects of the combination of GA and MJ, which warrants further study.
miRNAs belong to a class of small (19-22nt) non-protein-coding RNAs that tend to negatively regulate genes by binding to the 3′-UTR of the target mRNA via the RNA-induced silencing complex causing mRNA destabilization and/or translational inhibition (Friedman et al., 2009). Recently, miRNAs have been revealed to control epigenetics, which is defined as heritable changes in gene expression without a change in the DNA sequence itself (Egger et al., 2004). DNA methylation and histone modifications are two important mechanisms in the area of epigenetics that have profound roles in gene regulation, development, and carcinogenesis (Jones and Baylin, 2002; Baylin and Ohm, 2006; Klose and Bird, 2006). The cartilage specific miR-140 can target histone deacetylase 4 in mice (Tuddenham et al., 2006). Embryonic stem cell-specific miRNAs have been found to control de novo DNA methylation during differentiation by targeting Rbl2 (Benetti et al., 2008). In addition, it has been reported that the tumour suppressor miR-101 can directly reduce the PcG protein EZH2 in bladder cancer (Friedman et al., 2009). In our study, the dual-luciferase reporter assay results also confirmed that miR-101 directly targets EZH2 in bladder cancer. Furthermore, we demonstrated that the GA and MJ co-treatment resulted in a synergistic up-regulation of miR-101 expression in bladder cancer cells, and transfection of an anti-miR-101 inhibitor restored the miR-101-induced loss of EZH2 protein expression. Each miRNA is predicted to have many targets, and each mRNA may be regulated by more than one miRNA (Lim et al., 2005; Rajewsky, 2006). More studies are required in these areas to further illuminate the therapeutic potential of natural compounds and miRNAs.
In conclusion, we have developed a novel strategy of combining GA with MJ for the treatment of human bladder cancer. MJ enhances GA-induced activation of caspase-3 and caspase-9, and down-regulation of XIAP expression. Moreover, our findings indicate that the comprehensive underlying mechanism is mediated through a down-regulation of EZH2 expression by miR-101, and is thus likely to affect many genes and pathways closely associated with bladder cancer.
Acknowledgments
This research was supported by the National Natural Science Foundation of China (Nos. 81172423, 81272816, 81202018, 81001132, 81072073), and Key Program of Natural Science Foundation of Hubei province in China (No. 2008cda058).
Glossary
- BCL2
B-cell lymphoma-2
- CCK-8
cell counting kit-8
- CCNA2
cyclin A2
- CCNB1
cyclin B1
- CCNE1
cyclin E1
- CDK1
cyclin-dependent kinase 1
- EZH2
enhancer of zeste homologue 2
- FGFR3
fibroblast growth factor receptor 3
- GA
gambogic acid
- GO
gene ontology
- HGUC
high-grade urothelial carcinomas
- LGPUC
low-grade papillary urothelial carcinomas
- MDM2
murine double minute-2
- MJ
methyl jasmonate
- PI
propidium iodide
- PRC2
polycomb repressive complex 2
- qPCR
quantitative real-time PCR
- UTR
untranslated regions
- XIAP
X-linked inhibitor of apoptosis protein
Conflict of interest
None.
Supporting Information
Additional Supporting Information may be found in the online version of this article at the publisher's web-site: http://dx.doi.org/10.1111/bph.12501
The complete list of the gene ontology (GO) terms based on the genes whose changes due to GA and MJ co-treatment. T24 cells were treated with and without a combination of GA (2.5 μΜ) and MJ (0.75 mM) for 24 h. Cells were then harvested and RNA was used for gene expression microarray analysis as described in the Methods section. Genes with a fold change of ≥; 2 and a P value of ≤ 0.05 between two groups were identified as differentially expressed genes. Functional analysis of the differentially expressed genes was performed using GO (http://www.geneontology .org/). All experiments were repeated at least three times.
The complete list of the pathways based on the genes whose changes were due to GA and MJ co-treatment. T24 cells were treated with and without a combination of GA (2.5 μ;Μ) and MJ (0.75 mM) for 24 h. Cells were then harvested and RNA was used for gene expression microarray analysis as described in the Methods section. Genes with a fold change of ≥ 2 and a P value of ≤; 0.05 between two groups were identified as differentially expressed genes. Functional analysis of the differentially expressed genes was performed using the KEEG PATHWAY Database (http://www.genome.jp/ kegg/pathway.html). All experiments were repeated at least three times.
References
- Bachmann IM, Halvorsen OJ, Collett K, Stefansson IM, Straume O, Haukaas SA, et al. EZH2 expression is associated with high proliferation rate and aggressive tumor subgroups in cutaneous melanoma and cancers of the endometrium, prostate, and breast. J Clin Oncol. 2006;24:268–273. doi: 10.1200/JCO.2005.01.5180. [DOI] [PubMed] [Google Scholar]
- Baylin SB, Ohm JE. Epigenetic gene silencing in cancer–a mechanism for early oncogenic pathway addiction? Nat Rev Cancer. 2006;6:107–116. doi: 10.1038/nrc1799. [DOI] [PubMed] [Google Scholar]
- Benetti R, Gonzalo S, Jaco I, Muñoz P, Gonzalez S, Schoeftner S, et al. A mammalian microRNA cluster controls DNA methylation and telomere recombination via Rbl2-dependent regulation of DNA methyltransferases. Nat Struct Mol Biol. 2008;15:268–279. doi: 10.1038/nsmb.1399. [DOI] [PMC free article] [PubMed] [Google Scholar]
- Bryant R, Cross N, Eaton C, Hamdy F, Cunliffe V. EZH2 promotes proliferation and invasiveness of prostate cancer cells. Prostate. 2007;67:547–556. doi: 10.1002/pros.20550. [DOI] [PubMed] [Google Scholar]
- Cao Q, Yu J, Dhanasekaran SM, Kim JH, Mani R-S, Tomlins SA, et al. Repression of E-cadherin by the polycomb group protein EZH2 in cancer. Oncogene. 2008;27:7274–7284. doi: 10.1038/onc.2008.333. [DOI] [PMC free article] [PubMed] [Google Scholar]
- Cao R, Wang L, Wang H, Xia L, Erdjument-Bromage H, Tempst P, et al. Role of histone H3 lysine 27 methylation in Polycomb-group silencing. Science. 2002;298:1039–1043. doi: 10.1126/science.1076997. [DOI] [PubMed] [Google Scholar]
- Chan TY. World Health Organization classification of tumours: pathology & genetics of tumours of the urinary system and male genital organs. Urology. 2005;65:214–215. [Google Scholar]
- Chen T, Zhang RH, He SC, Xu QY, Ma L, Wang GC, et al. Synthesis and antiangiogenic activity of novel gambogic acid derivatives. Molecules. 2012;17:6249–6268. doi: 10.3390/molecules17066249. [DOI] [PMC free article] [PubMed] [Google Scholar]
- Ciarapica R, Russo G, Verginelli F, Raimondi L, Donfrancesco A, Rota R, et al. Deregulated expression of miR-26a and Ezh2 in rhabdomyosarcoma. Cell Cycle. 2009;8:172–175. doi: 10.4161/cc.8.1.7292. [DOI] [PubMed] [Google Scholar]
- Davenport J, Manjarrez JR, Peterson L, Krumm B, Blagg BS, Matts RL. Gambogic acid, a natural product inhibitor of Hsp90. J Nat Prod. 2011;74:1085–1092. doi: 10.1021/np200029q. [DOI] [PMC free article] [PubMed] [Google Scholar]
- Deveraux QL, Leo E, Stennicke HR, Welsh K, Salvesen GS, Reed JC. Cleavage of human inhibitor of apoptosis protein XIAP results in fragments with distinct specificities for caspases. EMBO J. 1999;18:5242–5251. doi: 10.1093/emboj/18.19.5242. [DOI] [PMC free article] [PubMed] [Google Scholar]
- Egger G, Liang G, Aparicio A, Jones PA. Epigenetics in human disease and prospects for epigenetic therapy. Nature. 2004;429:457–463. doi: 10.1038/nature02625. [DOI] [PubMed] [Google Scholar]
- Fingrut O, Flescher E. Plant stress hormones suppress the proliferation and induce apoptosis in human cancer cells. Leukemia. 2002;16:608–616. doi: 10.1038/sj.leu.2402419. [DOI] [PubMed] [Google Scholar]
- Flescher E. Jasmonates in cancer therapy. Cancer Lett. 2007;245:1–10. doi: 10.1016/j.canlet.2006.03.001. [DOI] [PubMed] [Google Scholar]
- Frei E, Antman KH. Principles of dose, schedule, and combination chemotherapy. In: Bast RC, Kufe DW, Pollock RE, Weichselbaum RR, Holland JF, editors. Cancer Medicine. Hamilton: BC Decker; 2003. pp. 817–837. [Google Scholar]
- Friedman JM, Liang G, Liu C-C, Wolff EM, Tsai YC, Ye W, et al. The putative tumor suppressor microRNA-101 modulates the cancer epigenome by repressing the polycomb group protein EZH2. Cancer Res. 2009;69:2623–2629. doi: 10.1158/0008-5472.CAN-08-3114. [DOI] [PubMed] [Google Scholar]
- Heyfets A, Flescher E. Cooperative cytotoxicity of methyl jasmonate with anti-cancer drugs and 2-deoxy-D-glucose. Cancer Lett. 2007;250:300–310. doi: 10.1016/j.canlet.2006.10.013. [DOI] [PubMed] [Google Scholar]
- Ishii Y, Kiyota H, Sakai S, Honma Y. Induction of differentiation of human myeloid leukemia cells by jasmonates, plant hormones. Leukemia. 2004;18:1413–1419. doi: 10.1038/sj.leu.2403421. [DOI] [PubMed] [Google Scholar]
- Jang SW, Okada M, Sayeed I, Xiao G, Stein D, Jin P, et al. Gambogic amide, a selective agonist for TrkA receptor that possesses robust neurotrophic activity, prevents neuronal cell death. Proc Natl Acad Sci USA. 2007;104:16329–16334. doi: 10.1073/pnas.0706662104. [DOI] [PMC free article] [PubMed] [Google Scholar]
- Jemal A, Siegel R, Ward E, Hao Y, Xu J, Thun MJ. Cancer statistics, 2009. CA Cancer J Clin. 2009;59:225–249. doi: 10.3322/caac.20006. [DOI] [PubMed] [Google Scholar]
- Jiang G, Zhao J, Xiao X, Tao D, Gu C, Tong Q, et al. AN N-terminal Smac peptide sensitizes human prostate carcinoma cells to methyl jasmonate-induced apoptosis. Cancer Lett. 2011;302:37–46. doi: 10.1016/j.canlet.2010.12.009. [DOI] [PubMed] [Google Scholar]
- Jones PA, Baylin SB. The fundamental role of epigenetic events in cancer. Nat Rev Genet. 2002;3:415–428. doi: 10.1038/nrg816. [DOI] [PubMed] [Google Scholar]
- Kasibhatla S, Jessen KA, Maliartchouk S, Wang JY, English NM, Drewe J, et al. A role for transferrin receptor in triggering apoptosis when targeted with gambogic acid. Proc Natl Acad Sci USA. 2005;102:12095–12100. doi: 10.1073/pnas.0406731102. [DOI] [PMC free article] [PubMed] [Google Scholar]
- Kaur M, Cole MD. MYC acts via the PTEN tumor suppressor to elicit autoregulation and genome-wide gene repression by activation of the Ezh2 methyltransferase. Cancer Res. 2013;73:695–705. doi: 10.1158/0008-5472.CAN-12-2522. [DOI] [PMC free article] [PubMed] [Google Scholar]
- Kilkenny C, Browne W, Cuthill IC, Emerson M, Altman DG. Animal research: reporting in vivo experiments: the ARRIVE guidelines. Br J Pharmacol. 2010;160:1577–1579. doi: 10.1111/j.1476-5381.2010.00872.x. [DOI] [PMC free article] [PubMed] [Google Scholar]
- Klose RJ, Bird AP. Genomic DNA methylation: the mark and its mediators. Trends Biochem Sci. 2006;31:89–97. doi: 10.1016/j.tibs.2005.12.008. [DOI] [PubMed] [Google Scholar]
- Lee TI, Jenner RG, Boyer LA, Guenther MG, Levine SS, Kumar RM, et al. Control of developmental regulators by Polycomb in human embryonic stem cells. Cell. 2006;125:301–313. doi: 10.1016/j.cell.2006.02.043. [DOI] [PMC free article] [PubMed] [Google Scholar]
- Li R, Chen Y, Zeng L, Shu W, Zhao F, Wen L, et al. Gambogic acid induces G0/G1 arrest and apoptosis involving inhibition of SRC-3 and inactivation of Akt pathway in K562 leukemia cells. Toxicology. 2009;262:98–105. doi: 10.1016/j.tox.2009.04.059. [DOI] [PubMed] [Google Scholar]
- Lim LP, Lau NC, Garrett-Engele P, Grimson A, Schelter JM, Castle J, et al. Microarray analysis shows that some microRNAs downregulate large numbers of target mRNAs. Nature. 2005;433:769–773. doi: 10.1038/nature03315. [DOI] [PubMed] [Google Scholar]
- Lu J, He ML, Wang L, Chen Y, Liu X, Dong Q, et al. MiR-26a inhibits cell growth and tumorigenesis of nasopharyngeal carcinoma through repression of EZH2. Cancer Res. 2011;71:225–233. doi: 10.1158/0008-5472.CAN-10-1850. [DOI] [PubMed] [Google Scholar]
- Lu N, Yang Y, You QD, Ling Y, Gao Y, Gu HY, et al. Gambogic acid inhibits angiogenesis through suppressing vascular endothelial growth factor-induced tyrosine phosphorylation of KDR/Flk-1. Cancer Lett. 2007;258:80–89. doi: 10.1016/j.canlet.2007.08.015. [DOI] [PubMed] [Google Scholar]
- McGrath J, Drummond G, McLachlan E, Kilkenny C, Wainwright C. Guidelines for reporting experiments involving animals: the ARRIVE guidelines. Br J Pharmacol. 2010;160:1573–1576. doi: 10.1111/j.1476-5381.2010.00873.x. [DOI] [PMC free article] [PubMed] [Google Scholar]
- Matsukawa Y, Semba S, Kato H, Ito A, Yanagihara K, Yokozaki H. Expression of the enhancer of zeste homolog 2 is correlated with poor prognosis in human gastric cancer. Cancer Sci. 2006;97:484–491. doi: 10.1111/j.1349-7006.2006.00203.x. [DOI] [PMC free article] [PubMed] [Google Scholar]
- Milrot E, Jackman A, Flescher E, Gonen P, Kelson I, Keisari Y, et al. Enhanced killing of cervical cancer cells by combinations of methyl jasmonate with cisplatin, X or alpha radiation. Invest New Drug. 2013;31:333–344. doi: 10.1007/s10637-012-9870-2. [DOI] [PubMed] [Google Scholar]
- Panthong A, Norkaew P, Kanjanapothi D, Taesotikul T, Anantachoke N, Reutrakul V. Anti-inflammatory, analgesic and antipyretic activities of the extract of gamboge from Garcinia hanburyi Hook f. J Ethnopharmacol. 2007;111:335–340. doi: 10.1016/j.jep.2006.11.038. [DOI] [PubMed] [Google Scholar]
- Rajewsky N. microRNA target predictions in animals. Nat Genet. 2006;38:8–13. doi: 10.1038/ng1798. [DOI] [PubMed] [Google Scholar]
- Raman JD, Mongan NP, Tickoo SK, Boorjian SA, Scherr DS, Gudas LJ. Increased expression of the polycomb group gene, EZH2, in transitional cell carcinoma of the bladder. Clin Cancer Res. 2005;11:8570–8576. doi: 10.1158/1078-0432.CCR-05-1047. [DOI] [PubMed] [Google Scholar]
- Raviv Z, Zilberberg A, Cohen S, Reischer-Pelech D, Horrix C, Berger M, et al. Methyl jasmonate down-regulates survivin expression and sensitizes colon carcinoma cells towards TRAIL-induced cytotoxicity. Br J Pharmacol. 2011;164:1433–1444. doi: 10.1111/j.1476-5381.2011.01419.x. [DOI] [PMC free article] [PubMed] [Google Scholar]
- Rong JJ, Hu R, Song XM, Ha J, Lu N, Qi Q, et al. Gambogic acid triggers DNA damage signaling that induces p53/p21Waf1/CIP1 activation through the ATR-Chk1 pathway. Cancer Lett. 2010;296:55–64. doi: 10.1016/j.canlet.2010.03.016. [DOI] [PubMed] [Google Scholar]
- Rotem R, Heyfets A, Fingrut O, Blickstein D, Shaklai M, Flescher E. Jasmonates: novel anticancer agents acting directly and selectively on human cancer cell mitochondria. Cancer Res. 2005;65:1984–1993. doi: 10.1158/0008-5472.CAN-04-3091. [DOI] [PubMed] [Google Scholar]
- Sachdeva M, Mo YY. MicroRNA-145 suppresses cell invasion and metastasis by directly targeting mucin 1. Cancer Res. 2010;70:378–387. doi: 10.1158/0008-5472.CAN-09-2021. [DOI] [PMC free article] [PubMed] [Google Scholar]
- Sun C, Cai M, Meadows RP, Xu N, Gunasekera AH, Herrmann J, et al. NMR structure and mutagenesis of the third Bir domain of the inhibitor of apoptosis protein XIAP. J Biol Chem. 2000;275:33777–33781. doi: 10.1074/jbc.M006226200. [DOI] [PubMed] [Google Scholar]
- Sun HP, Liu ZL, Xue X, Gao Y, Zhang L, Wang JX, et al. Studies on chemical structure modification and structure activity relationship of derivatives of gambogic acid at C (39) Chem & Biodivers. 2012;9:1579–1590. doi: 10.1002/cbdv.201100415. [DOI] [PubMed] [Google Scholar]
- Tan J, Yang X, Zhuang L, Jiang X, Chen W, Lee PL, et al. Pharmacologic disruption of Polycomb-repressive complex 2-mediated gene repression selectively induces apoptosis in cancer cells. Gene Dev. 2007;21:1050–1063. doi: 10.1101/gad.1524107. [DOI] [PMC free article] [PubMed] [Google Scholar]
- Tuddenham L, Wheeler G, Ntounia-Fousara S, Waters J, Hajihosseini MK, Clark I, et al. The cartilage specific microRNA-140 targets histone deacetylase 4 in mouse cells. FEBS Lett. 2006;580:4214–4217. doi: 10.1016/j.febslet.2006.06.080. [DOI] [PubMed] [Google Scholar]
- Wang H, Albadine R, Magheli A, Guzzo TJ, Ball MW, Hinz S, et al. Increased EZH2 protein expression is associated with invasive urothelial carcinoma of the bladder. Urol Oncol. 2012;30:428–433. doi: 10.1016/j.urolonc.2010.09.005. [DOI] [PubMed] [Google Scholar]
- Wang P, Zou F, Zhang X, Li H, Dulak A, Tomko RJ, et al. microRNA-21 negatively regulates Cdc25A and cell cycle progression in colon cancer cells. Cancer Res. 2009;69:8157–8165. doi: 10.1158/0008-5472.CAN-09-1996. [DOI] [PMC free article] [PubMed] [Google Scholar]
- Wang T, Wei J, Qian X, Ding Y, Yu L, Liu B. Gambogic acid, a potent inhibitor of survivin, reverses docetaxel resistance in gastric cancer cells. Cancer Lett. 2008a;262:214–222. doi: 10.1016/j.canlet.2007.12.004. [DOI] [PubMed] [Google Scholar]
- Wang X, Chen Y, Han Q, Chan C, Wang H, Liu Z, et al. Proteomic identification of molecular targets of gambogic acid: role of stathmin in hepatocellular carcinoma. Proteomics. 2008b;9:242–253. doi: 10.1002/pmic.200800155. [DOI] [PubMed] [Google Scholar]
- Weikert S, Christoph F, Kollermann J, Muller M, Schrader M, Miller K, et al. Expression levels of the EZH2 polycomb transcriptional repressor correlate with aggressiveness and invasive potential of bladder carcinomas. Int J Mol Med. 2005;16:349–353. [PubMed] [Google Scholar]
- Wu Z-Q, Guo Q-L, You Q-D, Zhao L, Gu H-Y. Gambogic acid inhibits proliferation of human lung carcinoma SPC-A1 cells in vivo and in vitro and represses telomerase activity and telomerase reverse transcriptase mRNA expression in the cells. Biol Pharm Bull. 2004;27:1769–1774. doi: 10.1248/bpb.27.1769. [DOI] [PubMed] [Google Scholar]
- Yang Y, Yang L, You QD, Nie FF, Gu HY, Zhao L, et al. Differential apoptotic induction of gambogic acid, a novel anticancer natural product, on hepatoma cells and normal hepatocytes. Cancer Lett. 2007;256:259–266. doi: 10.1016/j.canlet.2007.06.014. [DOI] [PubMed] [Google Scholar]
- Yeruva L, Hall C, Elegbede JA, Carper SW. Perillyl alcohol and methyl jasmonate sensitize cancer cells to cisplatin. Anticancer Drugs. 2010;21:1–9. doi: 10.1097/CAD.0b013e32832a68ad. [DOI] [PMC free article] [PubMed] [Google Scholar]
- Yi T, Yi Z, Cho S-G, Luo J, Pandey MK, Aggarwal BB, et al. Gambogic acid inhibits angiogenesis and prostate tumor growth by suppressing vascular endothelial growth factor receptor 2 signaling. Cancer Res. 2008;68:1843–1850. doi: 10.1158/0008-5472.CAN-07-5944. [DOI] [PMC free article] [PubMed] [Google Scholar]
- Yu J, Guo Q-L, You Q-D, Zhao L, Gu H-Y, Yang Y, et al. Gambogic acid-induced G2/M phase cell-cycle arrest via disturbing CDK7-mediated phosphorylation of CDC2/p34 in human gastric carcinoma BGC-823 cells. Carcinogenesis. 2006;28:632–638. doi: 10.1093/carcin/bgl168. [DOI] [PubMed] [Google Scholar]
- Zhai D, Jin C, Shiau C, Kitada S, Satterthwait AC, Reed JC. Gambogic acid is an antagonist of antiapoptotic Bcl-2 family proteins. Mol Cancer Ther. 2008;7:1639–1646. doi: 10.1158/1535-7163.MCT-07-2373. [DOI] [PMC free article] [PubMed] [Google Scholar]
- Zhang HZ, Kasibhatla S, Wang Y, Herich J, Guastella J, Tseng B, et al. Discovery, characterization and SAR of gambogic acid as a potent apoptosis inducer by a HTS assay. Bioorgan Med Chem. 2004;12:309–317. doi: 10.1016/j.bmc.2003.11.013. [DOI] [PubMed] [Google Scholar]
- Zhang L, Yi Y, Chen J, Sun Y, Guo Q, Zheng Z, et al. Gambogic acid inhibits Hsp90 and deregulates TNF-α/NF-κB in HeLa cells. Biochem Biophys Res Commun. 2010;403:282–287. doi: 10.1016/j.bbrc.2010.11.018. [DOI] [PubMed] [Google Scholar]
- Zhang XJ, Li X, Yang YR, Sun HP, Gao Y, Zhang L, et al. Studies on chemical-structure modification and structure? Activity relationship of gambogic acid derivatives at carbon (34) Chem Biodivers. 2012;9:2295–2308. doi: 10.1002/cbdv.201200081. [DOI] [PubMed] [Google Scholar]
Associated Data
This section collects any data citations, data availability statements, or supplementary materials included in this article.
Supplementary Materials
The complete list of the gene ontology (GO) terms based on the genes whose changes due to GA and MJ co-treatment. T24 cells were treated with and without a combination of GA (2.5 μΜ) and MJ (0.75 mM) for 24 h. Cells were then harvested and RNA was used for gene expression microarray analysis as described in the Methods section. Genes with a fold change of ≥; 2 and a P value of ≤ 0.05 between two groups were identified as differentially expressed genes. Functional analysis of the differentially expressed genes was performed using GO (http://www.geneontology .org/). All experiments were repeated at least three times.
The complete list of the pathways based on the genes whose changes were due to GA and MJ co-treatment. T24 cells were treated with and without a combination of GA (2.5 μ;Μ) and MJ (0.75 mM) for 24 h. Cells were then harvested and RNA was used for gene expression microarray analysis as described in the Methods section. Genes with a fold change of ≥ 2 and a P value of ≤; 0.05 between two groups were identified as differentially expressed genes. Functional analysis of the differentially expressed genes was performed using the KEEG PATHWAY Database (http://www.genome.jp/ kegg/pathway.html). All experiments were repeated at least three times.