Abstract
Background and Purpose
While selective, bitter tasting, TAS2R agonists can relax agonist-contracted airway smooth muscle (ASM), their mechanism of action is unclear. However, ASM contraction is regulated by Ca2+ signalling and Ca2+ sensitivity. We have therefore investigated how the TAS2R10 agonists chloroquine, quinine and denotonium regulate contractile agonist-induced Ca2+ signalling and sensitivity.
Experimental Approach
Airways in mouse lung slices were contracted with either methacholine (MCh) or 5HT and bronchodilation assessed using phase-contrast microscopy. Ca2+ signalling was measured with 2-photon fluorescence microscopy of ASM cells loaded with Oregon Green, a Ca2+-sensitive indicator (with or without caged-IP3). Effects on Ca2+ sensitivity were assessed on lung slices treated with caffeine and ryanodine to permeabilize ASM cells to Ca2+.
Key Results
The TAS2R10 agonists dilated airways constricted by either MCh or 5HT, accompanied by inhibition of agonist-induced Ca2+ oscillations. However, in non-contracted airways, TAS2R10 agonists, at concentrations that maximally dilated constricted airways, did not evoke Ca2+ signals in ASM cells. Ca2+ increases mediated by the photolysis of caged-IP3 were also attenuated by chloroquine, quinine and denotonium. In Ca2+-permeabilized ASM cells, the TAS2R10 agonists dilated MCh- and 5HT-constricted airways.
Conclusions and Implications
TAS2R10 agonists reversed bronchoconstriction by inhibiting agonist-induced Ca2+ oscillations while simultaneously reducing the Ca2+ sensitivity of ASM cells. Reduction of Ca2+ oscillations may be due to inhibition of Ca2+ release through IP3 receptors. Further characterization of bronchodilatory TAS2R agonists may lead to the development of novel therapies for the treatment of bronchoconstrictive conditions.
Keywords: mouse lung slice, 2-photon microscopy, β2-adrenergic receptor agonists, TAS2R, asthma
Introduction
Bronchoconstriction is a feature of asthma and chronic obstructive pulmonary disease (COPD) mediated partly by excessive airway smooth muscle (ASM) contraction. β2-Adrenoceptor agonists are widely used for the relief of bronchoconstriction. However, β2-adrenoceptor agonists are not always effective; hence, there is a need for additional bronchodilators.
ASM tone is regulated by GPCRs. Activation of muscarinic, histamine and leukotriene GPCRs, which act via Gαq/11, stimulates ASM contraction (Ressmeyer et al., 2010) by increasing cytosolic calcium concentration ([Ca2+]i), which activates myosin light chain (MLC) kinase (MLCK) to induce MLC phosphorylation. These Ca2+ increases result from phospholipase-Cβ (PLCβ) activity that produces inositol-1,4,5-trisphospate (IP3), which, in turn, activates IP3 receptors on the sarcoplasmic reticulum (SR) to open and release stored Ca2+ (Bai et al., 2009). The increased release of Ca2+ is manifested as Ca2+ oscillations with the frequency of oscillations correlating with airway constriction (Bai and Sanderson, 2009; Ressmeyer et al., 2010). The extent of airway constriction induced by a particular Ca2+ oscillation frequency is also modulated by ASM Ca2+ sensitivity (Bai and Sanderson, 2006b), which itself is a multi-component mechanism activated by Gαq/11 signalling. The major mechanisms mediating Ca2+ sensitivity are the activation of Rho kinase or PKC. Increased activity of these kinases leads to reduced MLC phosphatase (MLCP) activity. With decreased MLCP activity, Ca2+-dependent MLCK activity enhances MLC phosphorylation and increased contraction (Sanderson et al., 2008; Wright et al., 2013).
By contrast, β2-adrenoceptor GPCRs signal through Gαs to activate adenylate cyclase and cAMP production to induce ASM relaxation. Bronchodilation through β2-adrenoceptors is associated with the inhibition of agonist-induced Ca2+ oscillations by either inhibiting the release of Ca2+ via the IP3 receptor, preventing IP3 generation or both (Bai and Sanderson, 2006a). Furthermore, β2-adrenoceptor activation by formoterol (Delmotte and Sanderson, 2010) or salbutamol (Delmotte and Sanderson, 2008) reduces the Ca2+ sensitivity associated with agonist-induced bronchoconstriction.
A GPCR screening study has also revealed that ASM cells express other GPCRs. Of particular interest in the present context is the type 2 taste receptor (TAS2R) family responsible for the sensation of a bitter taste (Chandrashekar et al., 2000). While TAS2R-stimulation resulted in increased Ca2+ signalling in cultured ASM cells, which would normally be associated with contraction, the TAS2R agonists chloroquine, quinine and saccharin paradoxically relaxed tracheal strips contracted with contractile agonists (Deshpande et al., 2010; Pulkkinen et al., 2012). Thus, bronchodilation by TAS2R agonists was proposed to be mediated by elemental Ca2+ events that activated Ca2+-dependent, large-conductance potassium channels (BKCa), which hyperpolarized the membrane to induce ASM relaxation (Deshpande et al., 2010).
However, there are several inconsistencies in this hypothesis. While BKCa can be activated by spontaneous Ca2+ sparks in cultured ASM cells (Zhuge et al., 2010), Ca2+ sparks are rare in ASM cells within lung slices and occur only when stressed with external KCl; this is believed to result in the over-filling of the SR with Ca2+, which sensitizes ryanodine receptors (RyRs) to open (Perez and Sanderson, 2005b; Tazzeo et al., 2008; Bai et al., 2009). Importantly, spontaneous transient outward currents (BKCa activation by Ca2+ sparks measured by patch clamp) in ASM cells are unaffected by TAS2R agonists (Zhang et al., 2012). Furthermore, TAS2R agonist-induced Ca2+ sparks in ASM cells appear to be Ca2+ puffs arising from the opening of IP3 receptors, which have not been correlated with BKCa activation in ASM. Nevertheless, if TAS2R agonist-induced bronchodilation is dependent on Ca2+ sparks or puffs, these elemental Ca2+ signals would have to contend with agonist-induced whole-cell Ca2+ oscillations and waves to reverse bronchoconstriction. Evidence for this dual form of Ca2+ signalling has not been reported for TAS2R agonists because ASM relaxation and Ca2+ signalling were examined separately with different cellular preparations (Deshpande et al., 2010). ASM force was measured with agonist-contracted ASM tissue strips, whereas Ca2+ signalling was observed in cultured ASM cells in the absence of contractile agonists (Deshpande et al., 2010; Robinett et al., 2011).
Previous studies characterized bronchodilation by TAS2R agonists in trachea or large bronchi. However, pathological alterations in asthma extend down to small peripheral airways (∼1–3 mm diameter in human lungs). In this study, we examined the effects of the TAS2R10 agonists, chloroquine, quinine and denotonium, in peripheral airways with diameters of 100–200 μm in mouse lung slices in order to correlate bronchoconstriction with ASM intracellular Ca2+ signalling and Ca2+ sensitivity. TAS2R10 agonists induced bronchodilation without stimulating Ca2+ signals. Instead, bronchodilation by TAS2R10 agonists correlated with an inhibition of agonist-induced Ca2+ oscillations and decreased Ca2+ sensitivity.
Methods
Materials
Most reagents were obtained from Sigma Aldrich (St. Louis, MO, USA). HBSS was supplemented with 20 mM HEPES (sHBSS), which was adjusted to pH 7.4 with NaOH. All agonists were prepared in sHBSS. Stock solutions of quinine were prepared in DMSO with final solutions containing 0.5% (or less) DMSO.
Lung slice preparation
All animal care and experimental procedures complied with the requirements of the Animal Welfare Act, US Public Health Service Policy and NIH guidelines and were approved by the Institutional Animal Care and Use Committee of the University of Massachusetts Medical School. Studies involving animals are reported in accordance with the ARRIVE guidelines for reporting experiments involving animals (Kilkenny et al., 2010; McGrath et al., 2010). BALB/c mice (Charles River Breeeding Labs, Needham, MA, USA) were kept in 484 cm2 rectangular polysulfone cages containing Bed-oʼ Cobs 1/4 inch bedding material (The Andersons Inc, Maumee, OH, USA), which were autoclaved prior to use. Mice (4 per cage) were exposed to 12 h day/night cycle and provided with free access to irradiated Isopro 5P76 pellet diet (LabDiet, St Louis, MO, USA) and water (pH 2.8–3). Sixty-one female BALB/c mice were killed by i.p. injection of sodium pentabarbitone (15 mg per mouse). After removal of the chest wall, lungs were inflated with ∼1.1 mL of 1.8% warm agarose in sHBSS via an intratracheal catheter. Subsequently, air (∼0.3 mL) was injected to push the agarose within the airways into the alveoli. The agarose was gelled at 4°C. A vibratome (VF-300, Precisionary Instruments, Greenville, NC, USA) was used to make 180 μm thick slices, which were maintained in DMEM (Invitrogen, Carlsbad, CA, USA) at 37°C in 10% CO2/air. All experiments were conducted at 37°C in a custom-made temperature-controlled Plexiglas chamber, as described in Bai and Sanderson (2009).
Immunocytochemistry
Lung slices fixed in 4% formalin for 45 min were permeabilized in 0.1% Triton X-100 PBS solution (PBST) for 45 min. Non-specific sites were blocked by 1 h incubation in PBST containing 1% BSA. Slices were incubated with either 4 μg·mL−1 mouse tas2r107 rabbit polyclonal antibody (SC-139175, Santa Cruz Biotechnology, Santa Cruz, CA, USA) or rabbit IgG isotype control (SC-2027) for 2 h. After PBS wash, slices were incubated in 20 μg·mL−1 Alexa-488-conjugated goat anti-rabbit IgG (A-11034, Molecular Probes, Leiden, the Netherlands) for 2 h. After PBS wash, slices were incubated in 50 μg·mL−1 Cy3-conjugated α-smooth muscle actin monoclonal mouse antibody (C6198, Sigma) for 1 h. Immunofluorescence was recorded using confocal microscopy. Simultaneous recording of transmitted-light images was achieved using a third photomultiplier to detect laser light transmitted by the specimens.
Measurement of bronchoconstriction
Full details are described in Bai and Sanderson (2009). Briefly, a lung slice was mounted on a cover-glass and held down with 200 μm mesh with a hole aligned over an airway. A smaller cover-glass was placed on top of the mesh and sealed at the sides with silicone grease to facilitate solution exchange. Phase-contrast images were recorded on an inverted microscope with a ×20 objective. An image was recorded every 2 s with a CCD camera and image acquisition software (Video Savant, IO Industries, Montreal, Canada). Analysis was performed using ImageJ software by converting each video frame into a binary image after setting a threshold to separate lumen grey levels (set to black) from the surrounded tissue grey level (set to white). The change in lumen area was determined by summing the number of contiguous pixels (black) in each image.
Measurement of Ca2+ oscillations
Lung slices were incubated in sHBSS containing 20 μM Oregon Green 488 BAPTA-1-AM (Invitrogen), a Ca2+-sensitive dye, 0.1% Pluronic F-127 and 200 μM sulfobromophthalein in the dark at 30°C for 1 h. Subsequently, the slices were incubated in 200 μM sulfobromophthalein for 30 min. Slices were mounted as previously described and examined with a custom-built 2-photon scanning laser microscope with a ×40 oil immersion objective and images recorded at 30 images s−1. Changes in fluorescence intensity (which represent changes in [Ca2+]i) were analysed in an ASM cell of interest by averaging the grey value of a 10 × 10 pixel region using custom-written software. Relative fluorescence intensity was expressed as a ratio of the fluorescence intensity (Ft/F0) at a particular time (Ft) normalized to the initial fluorescence intensity (F0). Ca2+ oscillation frequency was determined by measuring the period between each spike and expressed as the number of spikes per minute. For all experiments, each n number refers to the number of ASM cells analysed.
Flash photolysis of caged-IP3
Lung slices were prepared as described earlier. However, during the 1 h incubation with the Ca2+ indicator, sHBSS also contained 2 μM caged-IP3 [iso-Ins(1,4,5)P3/PM; Enzo Life Sciences Farmingdale, NY, USA]. Details of the flash photolysis setup have been previously described (Leybaert and Sanderson, 2001). Briefly, a pulse (2 s) of UV light was generated from a mercury arc lamp with a band-pass filter (330 nm) and shutter. The mercury arc was focused to a small image in the conjugate plane of the microscope with a convex lens (200 mm focal length). Ca2+-dependent fluorescence changes in ASM cells were examined and analysed as described earlier. The amount of Ca2+ released during 45 s after the UV flash was determined by the AUC of the Ft/F0 versus time trace. In control experiments, to determine that the TAS2R10 agonists did not interfere with the process of photolyis, an aqueous solution of CMNB-caged-fluorescein (40 μM, Invitrogen), mixed with or without TAS2R10 agonists, was placed on a cover-glass and exposed to a UV flash as described earlier.
Measurement of Ca2+ sensitivity
Ca2+-permeabilized lung slices were created by pretreating lung slices with 20 mM caffeine and 50 μM ryanodine (Enzo Life Sciences) for 5 min, followed by a thorough washout with sHBSS prior to experiments. The details of this approach and its validation are described in Bai and Sanderson (2006b).
Data analysis
Statistical analyses were performed using Prism 6 (GraphPad, La Jolla, CA, USA). Results are presented as mean ± SEM, and significance (P) was determined using one-way anova with Bonferroni post hoc test.
Results
Expression of bitter taste receptors on murine ASM cells
To determine if mouse ASM expressed bitter taste receptors, lung slices were stained with antibodies against the mouse bitter taste receptor tas2r107 and the ASM marker, α-smooth muscle actin (αSMA) (Figure 1). Tas2r107 is the mouse orthologue of the human TAS2R10 expressed on human ASM (Deshpande et al., 2010). Mouse ASM cells expressing αSMA (red) showed high expression of tas2r107 (green); a correlation confirmed by the resultant yellow/orange colour in the overlay image (Figure 1D,E). Although there was weak staining of the epithelium with the isotype control, the ASM remained negative. Because chloroquine, quinine and denotonium are known to be TAS2R10 agonists (Wiener et al., 2012), we investigated their effects on bronchodilation and ASM Ca2+ signalling.
Figure 1.
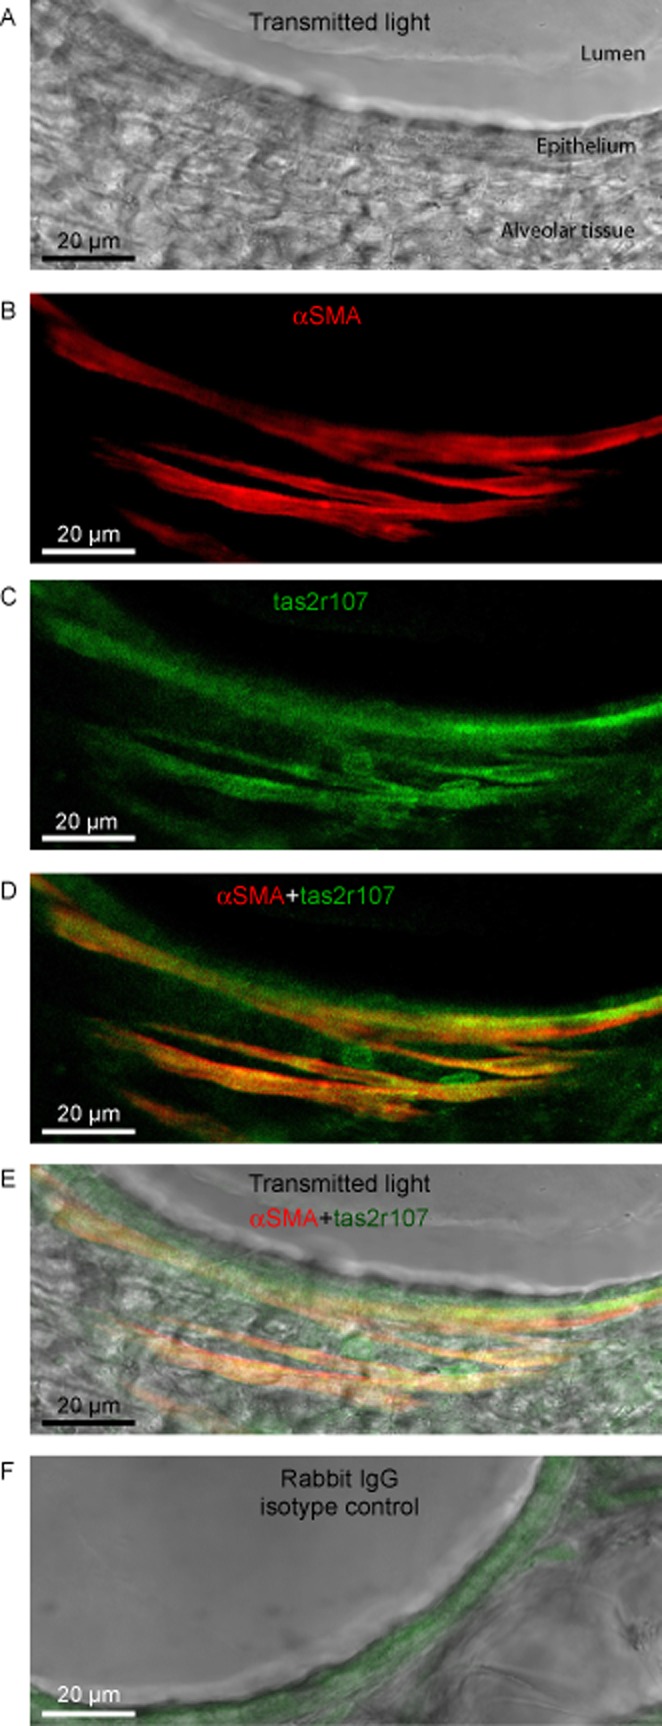
Expression of mouse bitter-taste receptor tas2r107 on ASM. (A) A non-confocal transmitted-light image displaying a section of the airway lumen, epithelium and surrounding alveolar tissue. (B) ASM cells in the same airway were identified by αSMA expression (pseudo-coloured with red). (C) Expression of the bitter-taste receptor tas2r107 (pseudo-coloured with green). (D) The merged image of ASM cells expressing αSMA and tas2r107; ASM cells with positive staining for both αSMA and tas2r107 are indicated by yellow/orange pseudo-colour. (E) The αSMA and tas2r-positive ASM cells overlaid onto the transmitted-light image shows the ASM were localized adjacent to the airway epithelium. (F) To identify non-specific cross-reactivity of the tas2r polyclonal antibody, additional lung slices were stained with normal rabbit IgG isotype control in lieu of the tas2r antibody. Non-specific staining was pseudo-coloured with green in overlay image. Images are representative of three separate experiments conducted on 3 mice.
Effects of TAS2R10 agonists on methacholine (MCh)- and 5HT-induced bronchoconstriction
Bronchodilation by the TAS2R10 agonists was examined in the presence of 400 nM MCh, which induced a submaximal bronchoconstriction of 61 ± 3% (n = 24, 6 mice) of the initial lumen size (average = 3.7 ± 0.25 × 104 μm2) (Figure 2A–C). Treatment of MCh-constricted airways with chloroquine induced a concentration-dependent bronchodilation with maximum effect of 101 ± 3% with 100 μM (n = 6, 3 mice, P < 0.05) (Figure 2A,B) and EC50 of 8.1 ± 1.2 μM (Figure 2D) (Supporting Information Video S1). A similar bronchodilation was induced by quinine (Figure 2C,D; Supporting Information Video S2) and denotonium (Figure 2D) with a maximum bronchodilation of 95 ± 3% for 500 μM quinine (n = 10, 3 mice, P < 0.05) and 94 ± 1.4% for 100 μM denotonium (n = 11, 3 mice, P < 0.05), with EC50 values of 13.4 ± 1.4 μM and 83 ± 2 μM for quinine and denotonium respectively (Figure 2D).
Figure 2.
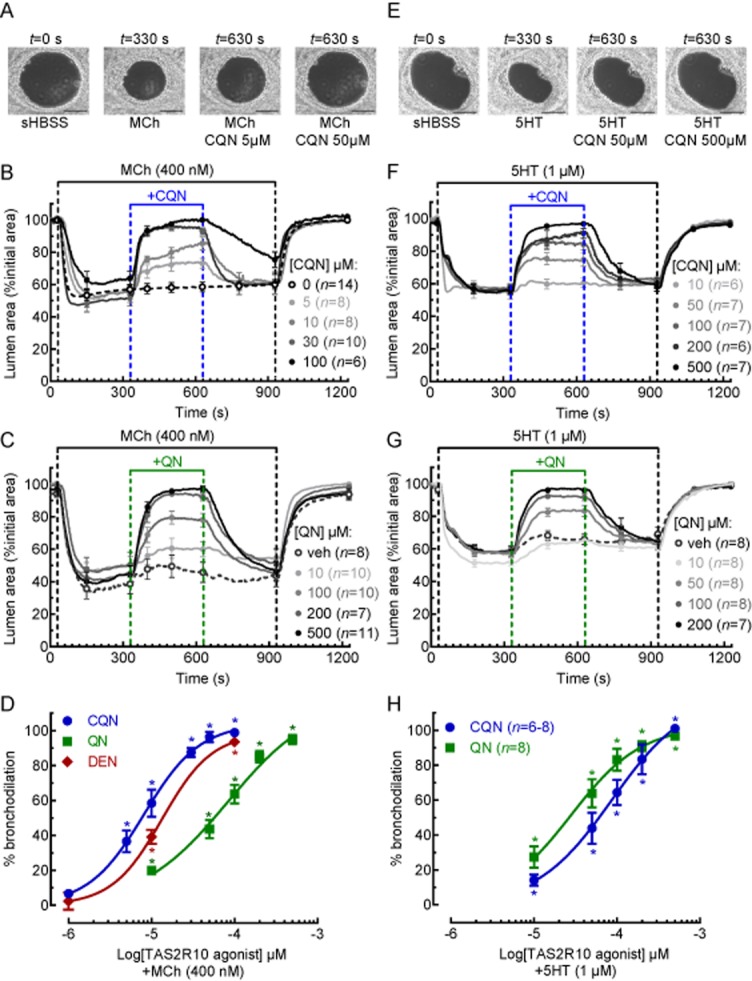
Effects of TAS2R10 agonists on MCh- and 5HT-induced airway constriction. Phase-contrast images (scale bar = 100 μm) of an airway in a lung slice under resting conditions and treated with (A) 400 nM MCh or (E) 1 μM 5HT in the absence and presence of chloroquine (CQN). (B, C) The effects of (B) chloroquine and (C) quinine (QN) at a range of concentrations and 0.5% DMSO vehicle in airways constricted with 400 nM MCh. (F, G) The effects of (F) chloroquine and (G) quinine at a range of concentrations in airways constricted with 1 μM 5HT. Each line represents the mean and each point represents the mean ± SEM of the lumen area normalized to the initial size at t = 0 s (D, H). The concentration-dependent bronchodilation of chloroquine, quinine and denotonium (DEN) in airways constricted with (D) 400 nM MCh and (H) 1 μM 5HT. Each point represents the mean ± SEM. All experiments were performed on lung slices prepared from 3 to 4 mice. *P < 0.05, significantly different from the MCh or 5HT responses.
Similar studies were performed using 1 μM 5HT, which reduced lumen area to 57 ± 1% (n = 34, 6 mice, P = 0.017) (Figure 2E–H). In these 5HT-constricted airways, chloroquine and quinine (500 μM) induced a maximum bronchodilation of 99.7 ± 1% (n = 7, 3 mice, P < 0.001) and 99 ± 1% (n = 8, 3 mice, P < 0.001) and EC50 of 87 ± 2% and 28 ± 1% for chloroquine and quinine respectively (Figure 2H).
Chloroquine and quinine also retained their ability to dilate airways constricted with higher MCh concentrations; 1 and 10 μM MCh reduced airway to 40 ± 5% (n = 18, 4 mice) and 30 ± 4% (n = 18, 4 mice) respectively (Figure 3A,B). Under these conditions, chloroquine (100 μM) and quinine (200 μM) induced bronchodilation of 99 ± 1% (n = 9, 2 mice) and 83 ± 3% (n = 9, 2 mice), respectively, in the presence of 1 μM MCh, and 85 ± 5% (n = 9, 2 mice) and 73 ± 3% (n = 9, 4 mice), respectively, in the presence of 10 μM MCh (Figure 3A,B).
Figure 3.
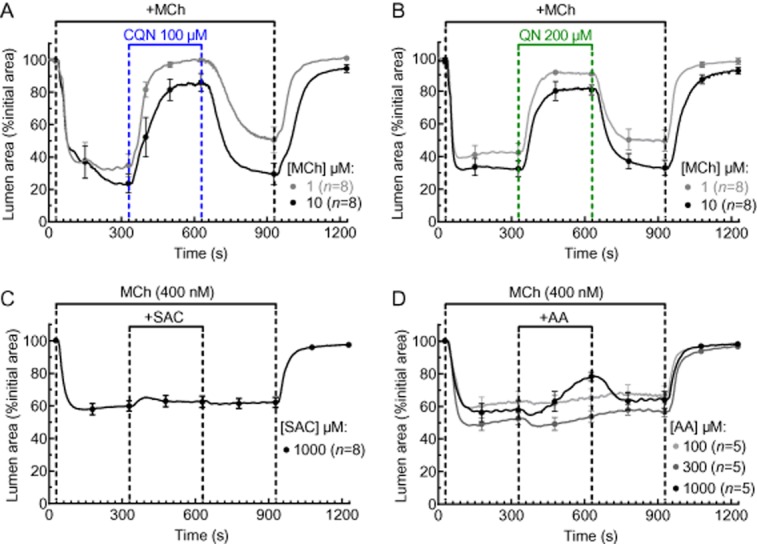
Effects of TAS2R10 (chloroquine and quinine), TAS2R31 (aristolochic acid ) and TAS2R43 (saccharin) agonists on MCh-induced airway constriction. (A, B) Effects of (A) 100 μM chloroquine (CQN) and (B) 200 μM quinine (QN) on airways constricted with 1 μM and 10 μM MCh. (C, D) Effects (C) 1 mM saccharin (SAC) and (D) aristolochic acid (AA) at a range of concentrations on airways constricted with 400 nM MCh. Each line represents the mean and each point represents the mean ± SEM of the lumen area normalized to the initial size at t = 0 s. All experiments were performed on lung slices prepared from 2 to 3 mice.
Aristolochic acid and saccharin are agonists for human TAS2R31 and TAS2R43 (Wiener et al., 2012), which are not expressed in mice. Consistent with the lack of murine receptors, aristolochic acid and saccharin (n = 8, 3 mice) mediated only weak or no bronchodilation respectively (Figure 3C,D). Aristolochic acid had no effect at 300 μM but at 1 mM resulted in a slowly developing partial bronchodilation of 50 ± 4% (n = 5, 2 mice) (Figure 4D).
Figure 4.
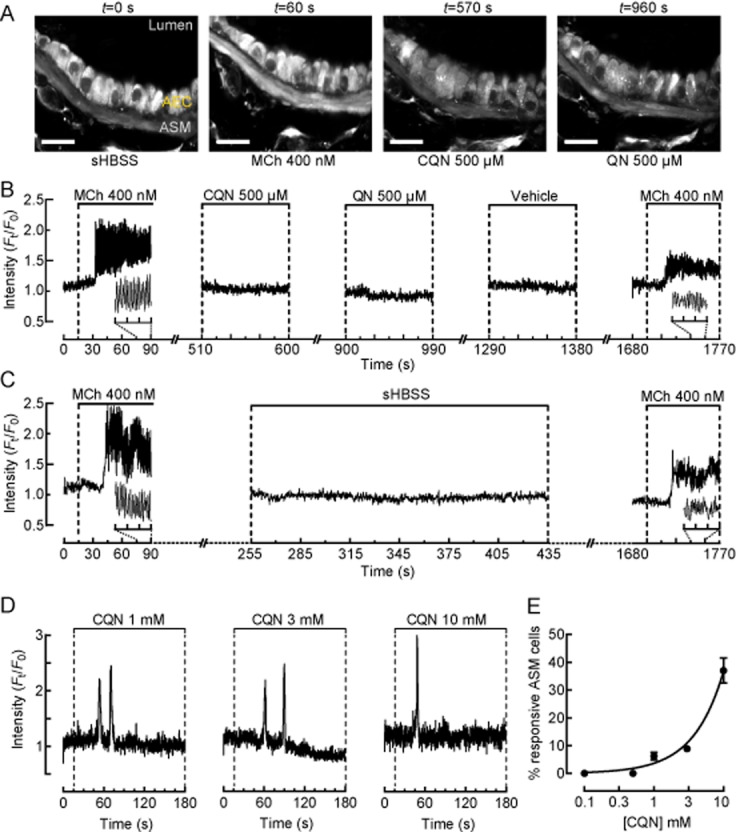
Effects of TAS2R10 agonists on ASM cell Ca2+ signalling and bronchoconstriction. (A) A series of 2-photon fluorescence microscopy images (scale bar = 20 μm) showing ASM cells (ASM) adjacent to airway epithelial cells in the same airway of a mouse lung slice in response to sHBSS, 400 nM MCh, 500 μM chloroquine (CQN) and 500 μM quinine (QN) at various times (indicated above) during the experimental protocol in (B). (B) Ca2+ signal trace from the ASM cell shown (A) under resting (t = 0–15 s) and during treatment with 400 nM MCh (t = 15–90 s), 500 μM chloroquine (t = 510–600 s), 500 μM quinine (t = 900–990 s), 0.5% DMSO vehicle (t = 1290–1380 s) and 400 nM MCh (t = 1690–1770) with 5 min sHBSS washout intervals in between treatments (representative of n = 8, 3 mice). Inset traces show details of Ca2+ oscillations. (C) A control Ca2+ signal trace from a separate experiment demonstrating the effects of Ca2+-fluorescent indicator bleaching and/or extrusion due to extended experimental time on the fluorescence intensity associated with Ca2+ oscillations. (D) Ca2+ signal traces from ASM cells demonstrating 1 or 2 transient Ca2+ spikes in response to 1, 3 and 10 mM chloroquine. (E) The percentage of ASM cells displaying Ca2+ signals in response to increasing high concentrations of chloroquine (analysed from 75 to 80 ASM cells, 3–4 mice). For B–D, representative traces are expressed as intensity (Ft) normalized to the initial intensity at t = 0 s (F0), measured from a 10 × 10 pixel ROI of a single ASM cell.
Effects of TAS2R10 agonists on ASM intracellular Ca2+ signalling
Because TAS2R-induced Ca2+ signalling in ASM cells has been proposed as a mechanism mediating bronchodilation, we investigated this possibility using concentrations of TAS2R10 agonists that fully reversed MCh-induced bronchodilation. Initially, the competency of ASM cells to display Ca2+ signalling was confirmed with 400 nM MCh (Figure 4A,B), which induced Ca2+ oscillations with a mean frequency of 56 ± 5 min−1 and a fluorescence ratio intensity of 2.2 ± 0.5 (n = 8, 4 mice). These Ca2+ oscillations stopped when MCh was removed. By contrast, chloroquine, quinine (at 500 μM) or vehicle alone failed to induce any changes in [Ca2+]i in the same ASM cells (mean fluorescence ratio intensity of 0.9 ± 0.03, 1 ± 0.1 and 1 ± 0.1, respectively) (Figure 4B, representative of n = 8, 4 mice). When the lung slice was re-exposed to MCh, the Ca2+ oscillations in the ASM cells resumed. However, the magnitude, but not the frequency, of the fluorescence signals reporting these later Ca2+ oscillations were reduced (Figure 4B). This is consistent with the fact that the signal magnitude is also influenced by the intracellular concentration of the Ca2+-sensitive indicator. With long duration experiments (∼1800 s), both bleaching and extrusion of the indicator can occur, leading to decreased fluorescence for similar Ca2+ changes. The signal intensity in the control experiment (Figure 4C) declines with a similar pattern, which indicates a loss of the Ca2+ indicator rather than a change in Ca2+ signalling as a result of exposure to TAS2R10 agonists.
While the TAS2R10 agonists at a concentration that induced maximum bronchodilation (500 μM) did not increase ASM cell [Ca2+]i, treatment of lung slices with higher concentrations of chloroquine (1–10 mM) could stimulate transient Ca2+ spikes (Ft/F0 > 2.0), albeit in a small proportion of ASM cells (Figure 4D). These Ca2+ spikes occurred within 60 s of chloroquine application and appeared as either single or double transients propagating throughout the cell. After the initial Ca2+ spikes, no additional Ca2+ spikes appeared during the prolonged chloroquine treatment for up to 5 min. The Ca2+ competency of the ASM cells that were unresponsive to chloroquine was verified by the ability of 400 nM MCh to induce Ca2+ oscillations. The proportion of responsive ASM cells increased from 6.3 ± 1% to 37 ± 5% as the chloroquine concentration increased from 1 and 10 mM (Figure 4E; analysed from 70 to 80 ASM cells, 3–4 mice).
Chloroquine and quinine (500 μM) also had no effect on basal airway area (Figure 5A,B; n = 9, 3 mice). The order of chloroquine and quinine exposure also did not affect the results because their application was randomized. Again, in non-responding airways, the viability of the airway was confirmed at the end of experiments by re-exposure to MCh, which stimulated both Ca2+ oscillations (Figure 4B) and bronchoconstriction (Figure 5B) similar to the initial MCh treatment.
Figure 5.
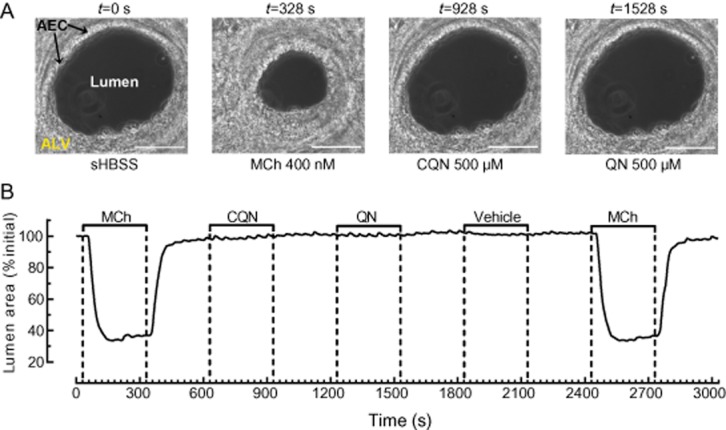
Effect of TAS2R10 agonists on resting airway size. (A) Phase-contrast images (scale bar = 100 μm) showing an airway, lined with airway epithelial cell with surrounding alveolar tissue and (B) changes in lumen area of the same airway under resting condition (t = 0–30 s) and treated with 400 nM MCh (t = 30–330 s), 500 μM chloroquine (CQN; t = 630–930 s), and 500 μM quinine (QN; t = 1230–1530 s), 0.5% DMSO vehicle (t = 1830–2130 s) and 400 nM MCh (t = 2430–2730) with 5 min sHBSS washout in between treatments (representative of n = 9, 3 mice).
Effect of TAS2R10 agonists on MCh- and 5HT-induced Ca2+ oscillations
Treatment with either MCh (400 nM) or 5HT (1 μM) established stable Ca2+ oscillations with mean frequencies of 72 ± 6 min−1 (n = 17, 3 mice) and 62 ± 5 min−1 (n = 10, 3 mice) respectively (Figure 6). In MCh-constricted airways, chloroquine (Figure 6A,B), quinine (Figure 6C,D) and denotonium (Figure 6E,F) reduced the Ca2+ oscillation frequency in a concentration-dependent manner with an IC50 of 23 ± 1 μM (n = 6–13, 4 mice), 56 ± 1 μM (n = 8–20, 5 mice) and 31 ± 1.2 μM (n = 8–12, 4 mice) respectively (Figure 7A). All TAS2R10 agonists assayed abolished MCh-induced Ca2+ oscillations (Figure 6B,D,F). MCh-induced Ca2+ oscillations returned when the TAS2R10 agonists were removed (Figure 6B,D,F). Similar concentration-dependent reductions and recoveries in the 5HT-induced Ca2+ oscillation frequency were mediated by chloroquine and quinine with IC50 values of 57 ± 1.2 μM (n = 9–13, 3 mice) and 48 ± 1.4 μM (n = 6–10, 3 mice) respectively (Figure 7B).
Figure 6.
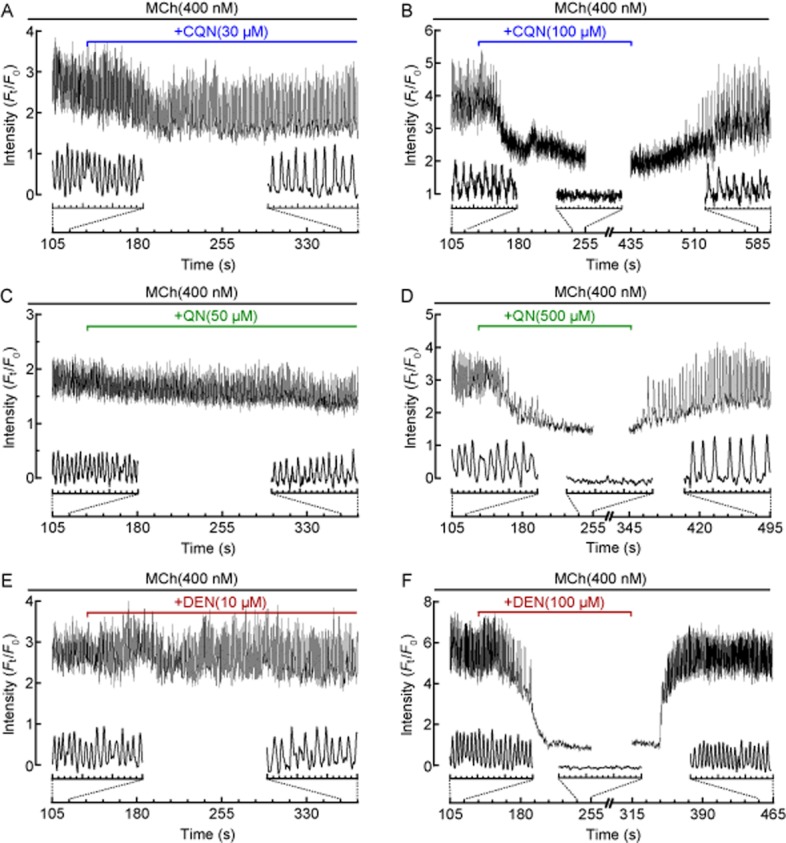
Effects of TAS2R10 agonists on MCh-induced Ca2+ oscillations in ASM cells. Representative traces showing intracellular Ca2+ signalling recorded in a single ASM cell contracted with 400 nM MCh in the absence and presence of (A, B) 30 and 100 μM chloroquine (CQN; from n = 12, 4 mice), (C, D) 50 and 500 μM quinine (QN; from n = 16, 4 mice) (E, F) 10 and 100 μM denotonium (DEN; from n = 8–13, 2 mice). Inset traces show details of Ca2+ oscillations or changes. Representative traces are expressed as intensity (Ft) normalized to the initial intensity at t = 0 s (F0), measured from a 10 × 10 pixel ROI of a single ASM cell.
Figure 7.
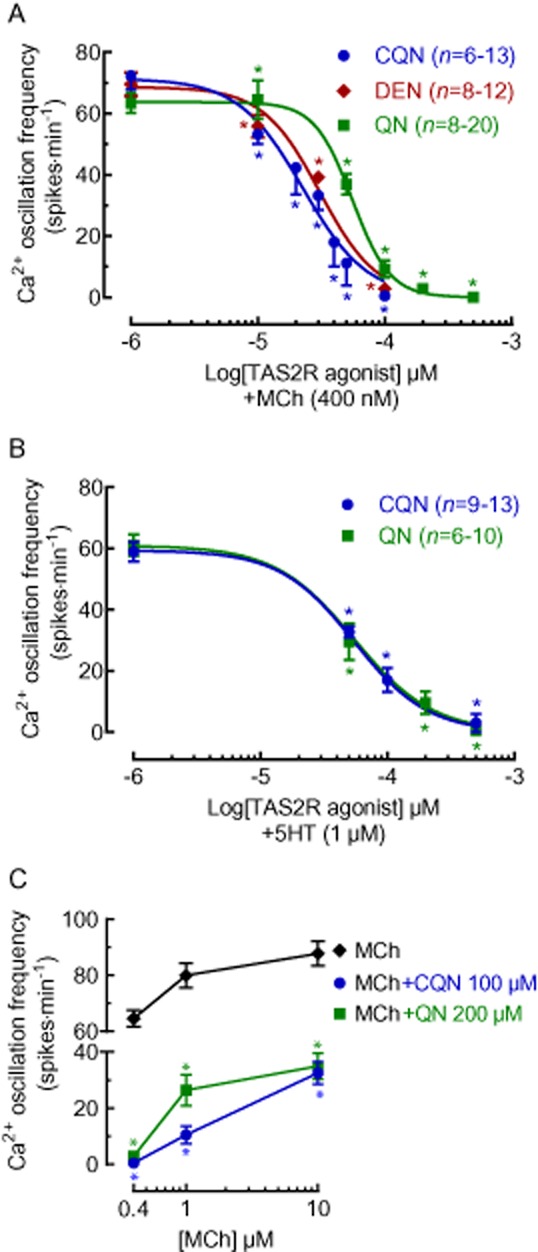
Concentration-dependent effects of TAS2R10 agonists on MCh- and 5HT-induced Ca2+ oscillations in ASM cells. Lung slices were treated with either (A) 400 nM MCh or (B) 1 μM 5HT followed by chloroquine (CQN; from 4 mice), quinine (QN; from 4 mice) or denotonium (DEN; from 2 mice) at the indicated concentrations. (C) The effects of chloroquine (from 3 mice) and quinine (from 3 mice) on Ca2+ oscillations stimulated by 0.4 μM (n = 13 and n = 16 respectively), 1 μM (n = 14 and n = 12 respectively) and 10 μM (n = 18 and n = 24 respectively from 3 mice) MCh. All data are expressed as the mean ± SEM Ca2+ oscillation frequency (spikes·min−1). *P < 0.05, significantly different from the MCh or 5HT responses.
Chloroquine and quinine also inhibited higher Ca2+ oscillation frequencies associated with higher MCh concentrations. The Ca2+ oscillation frequency of 80 ± 4 min−1 (n = 26, 3 mice) induced by 1 μM MCh was reduced by 90 ± 3% (n = 14, 2 mice, P < 0.01) by chloroquine (100 μM) and by 61 ± 8% (n = 12, 2 mice, P < 0.01) by quinine (500 μM) (Figure 7C). Similarly, the Ca2+ oscillation frequency of 88 ± 4 min−1 induced by 10 μM MCh (n = 40, 3 mice) was reduced by 67 ± 3% (n = 18, 3 mice, P < 0.01) with chloroquine (100 μM) and by 59 ± 4% (n = 24, 3 mice, P < 0.01) with quinine (200 μM) (Figure 7C).
Effects of TAS2R10 agonists on GPCR signalling
Previous studies reported that TAS2R agonist-induced bronchodilation was mediated through the G-protein Gβγ and the Pertussis toxin-sensitive Gαi signalling pathways (Deshpande et al., 2010; Zhang et al., 2013). To test these hypotheses, lung slices were stimulated with 400 nM MCh to stimulate Ca2+ oscillations before and after 45 min treatment with 20 μM gallein, a non-specific inhibitor of Gβγ subunits. MCh induced Ca2+ oscillations with a frequency of 70 ± 6 min−1 (n = 18, 3 mice) before gallein treatment and a significantly lower frequency of 55 ± 5 min−1 (n = 18, 3 mice, P < 0.05, cf. initial MCh) after gallein treatment. The MCh-induced Ca2+ oscillations in gallein-treated ASM cells were significantly inhibited by 100 μM chloroquine (1 ± 0.5 spikes min−1, n = 18, 3 mice, P < 0.01). Similarly, lung slices pretreated with 1 μg·mL−1 Pertussis toxin for 8 h failed to alter the effects of chloroquine on MCh-induced Ca2+ oscillations (n = 13, 2 mice, P < 0.01). These results indicate that in lung slices, bronchodilation induced by the TAS2R10 agonists was not mediated via Gβγ and Gαi signalling pathways.
Effects of TAS2R10 agonists on activation of IP3 receptors and SR Ca2+ stores
To determine if the inhibition of Ca2+ oscillations by the TAS2R10 agonists was though the inhibition of IP3 receptors or PLC, leading to reduced IP3 concentration, IP3 was generated within ASM cells by UV photolysis of caged-IP3. Control responses were initially determined by a 2 s UV flash focused on a single ASM cell in lung slices loaded with caged-IP3 (Figure 8A,B). After treatment with either chloroquine, quinine or denotonium for 2 min, a second UV flash (2 s) was applied to the same cell (Figure 8A,B). After washing the lung slice with sHBSS for 10 min to remove the TAS2R10 agonists, a third UV flash was applied.
Figure 8.
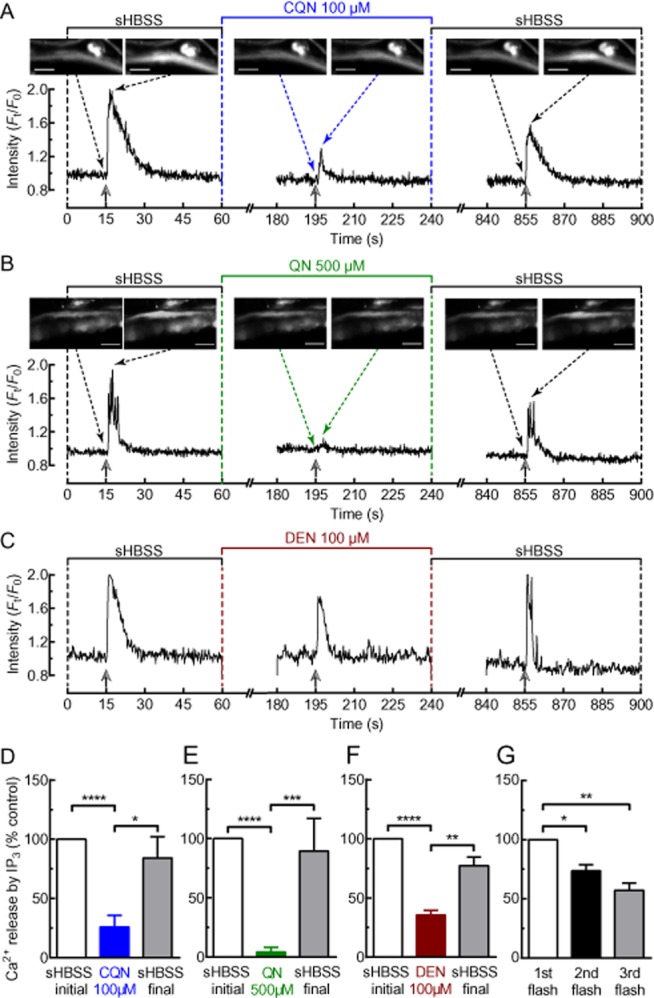
Effects of TAS2R10 agonists on IP3-induced Ca2+ signalling. (A–C) Representative Ca2+ signalling experiments performed in lung slices loaded with caged-IP3. A single ASM cell was exposed to a pulse of UV illumination (2 s) during resting conditions, after 2 min incubation with either (A) 100 μM chloroquine (CQN); (B) 500 μM quinine (QN); or (C) 100 μM denotonium (DEN) and after washout of the TAS2R10 agonist for 10 min. The change in [Ca2+]i was represented as the fluorescence intensity (Ft) of a 10 × 10 pixel ROI within the cell normalized to the initial intensity at t = 0 s (F0). Selected images (scale bar = 20 μm) in (A) and (B) show the analysed cell before and immediately after each UV flash. Solid and dotted arrows indicate time of UV flash and image shown, respectively. The amount of Ca2+ released in response to a UV flash is proportional to the area under the curve. Summary of results showing the effects of (D) chloroquine (n = 14, 3 mice), (E) quinine (n = 9, 2 mice) and (F) denotonium (n = 13, 2 mice) on Ca2+ signalling in response to uncaging of caged-IP3. (G) Summary of control experiment where an ASM cell received a UV flash in the absence of a TAS2R10 agonist (n = 6, 2 mice). Each bar in (D)–(G) represents the mean ± SEM of Ca2+ release expressed as % of the initial response to the first UV illumination. *P < 0.05, **P < 0.01, ***P < 0.001, ****P < 0.0001, significantly different as indicated.
In the presence of chloroquine (100 μM) (Figure 8A,D), quinine (500 μM) (Figure 8B,E) or denotonium (100 μM) (Figure 8C,F), the increase in [Ca2+]i generated in response to the UV flash was reduced to 26 ± 5% (n = 14, 3 mice, P < 0.0001), 2 ± 1% (n = 9, 2 mice, P < 0.0001) and 36 ± 5% (n = 13, 2 mice, P < 0.0001) of the initial control response respectively. This reduced Ca2+ signal in response to the second UV flash was not due to the depletion of intracellular caged-IP3 because, after washout of the TAS2R10 agonists, the third UV flash generated a strong Ca2+ signal (Figure 8A–F). The response to the third UV flash was slightly decreased compared with that of the first flash, but this was consistent with a gradual decline in the Ca2+ response to three successive UV flashes in the absence of TAS2R10 agonists (n = 6, 2 mice) (Figure 8G). The TAS2R10 agonists did not affect UV photolysis of CMNB-caged-fluorescein (data not shown), which indicates that the attenuation of IP3-induced Ca2+ signals was not due to the TAS2R10 agonists preventing the uncaging of caged-IP3.
The reduced IP3-induced Ca2+ signal by TAS2R10 agonists could result from the depletion of the SR Ca2+ store. However, this was ruled out because neither 100 μM chloroquine (n = 16, 3 mice) (Figure 9A,B) nor 500 μM quinine (n = 12, 3 mice) (Figure 9C,D) inhibited the Ca2+ increase induced by caffeine (20 mM). Additionally, these results also indicate that the TAS2R10 agonists were not reducing Ca2+ signals by somehow quenching the fluorescence signals emitted by the Ca2+-sensitive fluorescence dyes.
Figure 9.
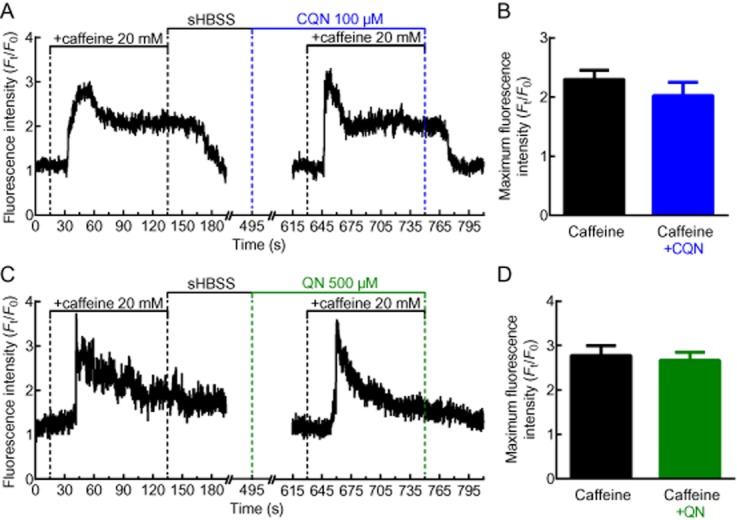
Effects of chloroquine and quinine on SR Ca2+ levels. The effect of (A) chloroquine (CQN) and (C) quinine (QN) on Ca2+ release from the SR store SR induced by caffeine. Left panel shows control response in the absence of (A) chloroquine or (C) QN. Representative traces, expressed as intensity (Ft) normalized to the initial intensity at t = 0 s (F0), measured from a 10 × 10 pixel ROI of a single ASM cell. (B, D) Summary of the maximum fluorescence intensity generated by caffeine alone or in the presence of (B) chloroquine (n = 16, 3 mice) or (D) quinine (n = 12, 3 mice). Each bar represents the mean ± SEM.
Effects of TAS2R10 agonists on Ca2+ sensitivity
The exposure of airways in lung slices to increasing concentrations of both MCh and 5HT increased the Ca2+ oscillation frequency and the amount of bronchoconstriction in a concentration-dependent manner. By plotting bronchoconstriction as a function of the Ca2+ oscillation frequency (illustrated with MCh data), a near-linear relationship is revealed (Figure 10) and this is consistent with previous studies (Bai and Sanderson, 2009). However, in the presence of either chloroquine or quinine, this relationship between the MCh-induced Ca2+ oscillations and bronchoconstriction displayed a downward shift and decreased gradient. The effect of chloroquine was greater than quinine. These alterations indicate that bronchodilation by the TAS2R10 agonists was not mediated only by decreasing Ca2+ oscillation frequency but also by reducing Ca2+ sensitivity of ASM cells (Figure 10).
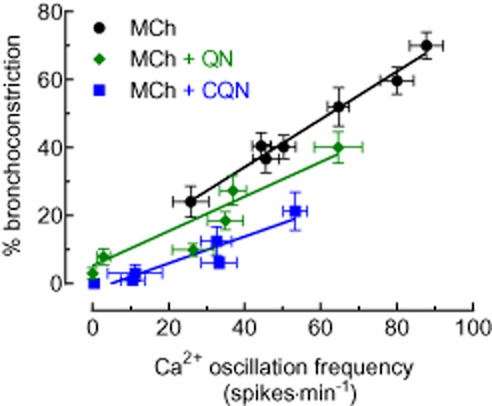
The relationship between MCh-induced Ca2+ oscillations and bronchoconstriction. Ca2+ oscillation frequencies mediated by 0.05, 0.1, 0.2, 0.3, 0.4, 1 and 10 μM of MCh (n = 22–35, from 4 mice) were plotted against the % bronchoconstriction induced by corresponding concentrations of MCh (n = 15–20, 4 mice). A similar plot was generated using data collected from experiments characterising the inhibitory effects of chloroquine (CQN) and quinine (QN) on MCh-induced Ca2+ oscillations (n = 6–13 and 7–21, respectively) and bronchoconstriction (n = 6–14 and n = 7–11 respectively). A linear regression function was fitted for each data set.
To confirm that the TAS2R10 agonists reduced Ca2+ sensitivity, ASM cell [Ca2+]i was clamped to a sustained elevated level that precludes the generation of Ca2+ oscillations. In the presence of a fixed [Ca2+]i, further ASM contraction by bronchoconstricting agonists can only occur by increasing Ca2+ sensitivity (Bai and Sanderson, 2006b).
ASM cell [Ca2+]i was clamped, by pretreating lung slices with 20 mM caffeine and 50 μM ryanodine. This treatment irreversibly locks the RyR in the open state to empty the SR of Ca2+, which, in turn, stimulates the opening of store-operated Ca2+ channels (SOC) on the cell membrane to enable Ca2+ entry (Ay et al., 2004). This Ca2+ efflux from the SR and influx from the external environment results in an immediate transient increase in [Ca2+]i (Figure 1Ai) that is followed by a stabilization of the [Ca2+]i at a sustained level (Figure 1Aii) as a result of a persistent SOC Ca2+ flux (n = 12, 3 mice), even after caffeine and ryanodine removal (Figure 1Aii–iii). We confirmed that the SR was depleted of Ca2+ because after caffeine/ryanodine washout, and in the absence of caffeine/ryanodine, stimulation with either MCh (Figure 1Aiii) or caffeine (Figure 1Aiv) failed to alter [Ca2+]i. Under these conditions, the ASM cell is considered ‘Ca2+-permeabilized’ (Bai and Sanderson, 2006b). These [Ca2+]i changes were accompanied by a transient bronchoconstriction (Figure 1Bi) followed by bronchodilation (Figure 11Bii). Bronchodilation occurs even when ASM [Ca2+]i remains elevated. This is a characteristic of mouse ASM that possess an inherent low Ca2+ sensitivity (Bai and Sanderson, 2006b). However, this state of an initial relaxed airway with sustained [Ca2+]i greatly facilitates the study of the changes in Ca2+-sensitivity in response to bronchoconstrictors or bronchodilators.
Figure 11.
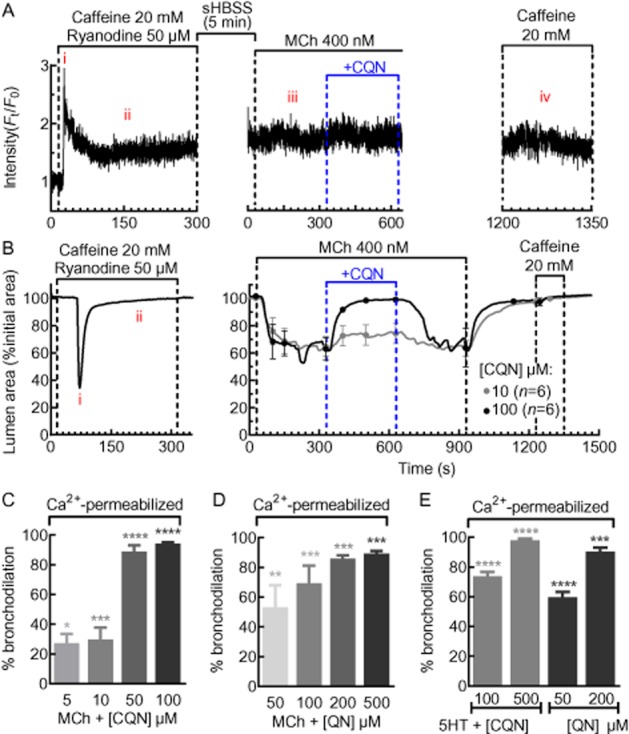
Effects of chloroquine and quinine on MCh- and 5HT-induced Ca2+ sensitivity. (A) A representative trace of the Ca2+ signal generated from an ASM cell permeabilized to Ca2+ by caffeine and ryanodine. During Ca2+ permeabilization, Ca2+ showed a transient increase (Ai) followed by a sustained plateau (Aii). After caffeine and ryanodine washout, intracellular Ca2+ levels remained elevated and unchanged in response to MCh (Aiii), chloroquine (CQN) or caffeine (Aiv). The trace is expressed as the intensity (Ft) normalized to the initial intensity at t = 0 s (F0) and is representative of n = 12, 3 mice. (B) During Ca2+ permeabilization of lung slices, the airway shows a transient contraction (Bi) and returns to a dilated state (Bii). Subsequently, the airway was constricted with 400 nM MCh followed by a dilation induced by chloroquine. After washout with sHBSS, exposure to 20 mM caffeine had no effect on airway size or Ca2+ (Aiv), indicating that the ASM cells remained Ca2+ permeabilized throughout the experiment. The change in airway lumen area is expressed as % of initial lumen size and each trace shows the mean and each point shows the mean ± SEM. Summary of the bronchodilation responses to (C) chloroquine (n = 6, 3 mice) and (D) quinine (QN; n = 5–7, 3 mice) in MCh and (E) 5HT in Ca2+-permeabilized lung slices (n = 8–10, 3 mice). Each bar represents the mean ± SEM % bronchodilation response. *P < 0.05, **P < 0.01, ***P < 0.001, ****P < 0.000, significantly different from MCh or 5HT responses alone.
In Ca2+-permeabilized lung slices, in the absence of any change in [Ca2+]i, MCh (400 nM) (Figure 11B) and 5HT (1 μM) (data not shown) reduced the airway lumen area to 65 ± 4% (n = 22, 4 mice) and 59 ± 2% (n = 36, 5 mice) respectively. This indicates that bronchoconstriction occurred as a result of increased Ca2+ sensitivity of ASM cells. These same MCh-constricted airways were dilated by chloroquine and quinine (Figure 11B–D). Chloroquine (100 μM) and quinine (500 μM) induced a maximum relaxation of 94 ± 1% (n = 4, 4 mice, P < 0.001) and 89 ± 2% (n = 5, 4 mice, P < 0.001) respectively (Figure 11C,D). In Ca2+-permeabilized airways constricted with 5HT (1 μM), chloroquine (500 μM) and quinine (200 μM) induced a maximum relaxation of 98 ± 1% (n = 9, 4 mice) and 90 ± 3% (n = 10, 4 mice) respectively (Figure 11E). The re-application of caffeine at the end of all experiments failed to stimulate any changes in airway size or [Ca2+]i, indicating that ASM cells remained Ca2+ permeable throughout the experiment. These data indicate that chloroquine and quinine reduced the Ca2+ sensitivity previously increased by bronchoconstrictors. The potency of chloroquine at reducing Ca2+ sensitivity was greater than quinine and this is consistent with the greater displacement of the Ca2+ oscillation frequency to airway constriction relationship in Figure 10.
Discussion
Despite the widespread use of β2-adrenoceptor agonists for the treatment of asthma and COPD, there remains a subset of patients who are unresponsive to this therapy. Hence, the need for novel bronchodilators that acts via other pathways. While the bitter tasting TAS2R agonists have been reported to elicit bronchodilation, their therapeutic potential requires a better understanding of their mechanism of action. Previous studies have suggested that IP3-dependent Ca2+ signalling underlies the bronchodilation induced by TAS2R agonists. Given that IP3-induced Ca2+ signalling usually evokes bronchoconstriction, it is necessary to elucidate the paradoxical relationship between IP3-induced Ca2+ signalling and bronchodilation by TAS2R agonists. We found that TAS2R10 agonists, at concentrations capable of inducing airway bronchodilation, did not induce Ca2+ signalling in ASM cells. Instead, the TAS2R10 agonists induced bronchodilation by (i) the inhibition of Ca2+ oscillations stimulated by contractile agonists, which may be due to diminished activation of IP3 receptors, and (ii) a simultaneous reduction in Ca2+ sensitivity of ASM cells. Our findings are consistent with previous results, which demonstrate that other bronchodilators also decrease Ca2+ signalling and Ca2+ sensitivity to synergistically achieve bronchodilation.
The TAS2R10 agonists consistently induced bronchodilation in constricted airways with EC50 values in the μM range. This effect was not restricted to muscarinic agonists because TAS2R10 agonists also dilated 5HT-constricted airways with differing rank order of potency. While in MCh-constricted airways chloroquine was more potent than quinine, quinine was slightly more potent at dilating 5HT-constricted airways. Non-specific relaxation effects of TAS2R10 agonists have also been reported in guinea pig trachea contracted with PGE2, LTD4 and histamine (Pulkkinen et al., 2012). These findings indicate that TAS2R are not acting solely as muscarinic antagonists. Consistent with other studies (Deshpande et al., 2010; Pulkkinen et al., 2012), we found bronchodilation by TAS2R10 agonists was fully reversible. Although comparing the TAS2R10 agonists with β2-adrenoceptor agonists was not our aim, in airways constricted with 400 nM MCh, formoterol (Delmotte and Sanderson, 2010) and salbutamol (Delmotte and Sanderson, 2008) only mediated maximum bronchodilation of about 70 and 25% respectively. In comparison, we found that all three TAS2R10 agonists could induce full bronchodilation. Thus, TAS2R agonists may be more efficacious than some β2-adrenoceptor agonists (Deshpande et al., 2010) but with substantially lower potencies.
This and a previous study (Zhang et al., 2013) have confirmed that tas2r107 is expressed in murine ASM cells. To elucidate whether the bronchodilation induced by chloroquine, quinine and denotonium was receptor independent, we also assayed saccharin and aristolochic acid in MCh-constricted airways. Bronchodilation by saccharin was absent, whereas aristolochic acid exhibited extremely low potency and efficacy. These findings are consistent with the absence of murine tas2r receptors for saccharin and aristolochic acid and indicate that effects by the TAS2R10 agonists used were TAS2R dependent.
Studies on isolated tracheal rings (Deshpande et al., 2010; Zhang et al., 2013) showed that TAS2R10 agonists alone modestly relaxed ASM with an externally applied basal tension. A similar effect on airway resting tone was not evident in our studies. In the absence of contractile agonist, there is absent or limited basal constriction in small airways within murine lung slices. We did not apply any external tension to the airways in lung slices other than the normal tethering forces associated with lung inflation. Hence, while it is possible that TAS2R10 agonists alone may relax ASM cells under tension, this effect does not occur in dilated resting small airways with physiological tension.
In taste bud cells (Rossler et al., 1998; Zhang et al., 2003), airway epithelial cells (Shah et al., 2009; Cohen et al., 2012) and ASM cells (Deshpande et al., 2010; Zhang et al., 2013), the activation of TAS2R by TAS2R10 agonists was found to induce Ca2+ signalling via a Gβγ/PLCβ2-dependent pathway. While Ca2+ signals could be generated in ASM cells within our lung slices, this only occurred at concentrations at and above 1 mM and only then in a small proportion of cells. Unlike MCh and 5HT-induced Ca2+ signals, chloroquine only induced a transient increase in [Ca2+]i, which returned to baseline. This response is similar to the Ca2+ signalling profile reported for TAS2R-expressing HEK cells (Meyerhof et al., 2010) and ASM cells (Deshpande et al., 2010) stimulated by millimolar concentrations of TAS2R10 agonists, which induced a brief increase in [Ca2+]i (approximately twofold above baseline) followed by a return to near baseline [Ca2+]i. In contrast, micromolar concentrations of TAS2R10 agonists, which fully dilated MCh and 5HT-constricted airways, failed to generate Ca2+ signals in ASM cells.
The observation that bronchodilation occurred at micromolar concentrations without [Ca2+]i increases, whereas TAS2R-induced Ca2+ signals occurred at millimolar concentrations suggest that bronchodilation is not a function of increases in [Ca2+]i. This may not have been discernible in earlier studies which mainly utilized millimolar concentrations of TAS2R agonists to characterize TAS2R-induce bronchodilation and ASM Ca2+ signalling (Deshpande et al., 2010; Zhang et al., 2013). Additionally, some of the discrepancies may be attributed to our use of lung slices to study Ca2+ responses in ASM cells, whereas others (Deshpande et al., 2010; Robinett et al., 2011; Zhang et al., 2013) examined isolated or cultured ASM cells. ASM cells in lung slices retain many of their in situ morphological and physiological characteristics, but these may be altered in isolated or cultured ASM cells. For example, MCh or histamine, which also activate PLCβ signalling, induce Ca2+ oscillations in ASM cells in lung slices (Bai and Sanderson, 2009; Ressmeyer et al., 2010), freshly isolated ASM cells (Kannan et al., 1997; Prakash et al., 1997) and ASM bundles (Dai et al., 2007) but agonist-induced Ca2+ oscillations in ASM were not reported by Zhang et al. (2013) and Deshpande et al. (2010).
In lung slice ASM cells, MCh- and 5HT-induced Ca2+ oscillations were inhibited by all bronchodilating TAS2R10 agonists. Concentrations of TAS2R10 agonists that induced full bronchodilation also abolished Ca2+ oscillations. In isolated human and murine ASM cells, chloroquine also reduced the non-oscillatory MCh-induced increase in [Ca2+]i (Zhang et al., 2013). These findings imply that inhibition of Ca2+ signalling underlies the bronchodilation induced by TAS2R agonists. Similar to their effects on bronchodilation, inhibition of Ca2+ oscillations by TAS2R10 agonists was reversible. In addition, even though chloroquine was more potent than quinine in MCh-treated lung slices, their IC50 values were similar in 5HT-treated lung slices which may indicate that chloroquine and quinine have different mechanisms of action, which gives chloroquine enhanced potency in inhibiting MCh-induced effects.
Relaxation of ASM induced by β2-adrenoceptor agonists is partly mediated by cAMP (Bai and Sanderson, 2006a). Hence, a similar mechanism may underlie bronchodilation by TAS2R agonists. However, TAS2R agonists do not increase cAMP levels or mediate bronchodilation via cAMP-dependent pathways (Deshpande et al., 2010; Pulkkinen et al., 2012). A recent study suggested that chloroquine inhibited MCh-induced Ca2+ signals in ASM cells by blocking voltage-gated Ca2+ channels (VGCC) via Gβγ and Gαi signalling pathways. In mouse small airways, VGCC do not appear to play an important role in contractile agonist-induced ASM contraction, hence inhibition of VGCC would not entirely account for the bronchodilation by TAS2R agonists (Perez and Sanderson, 2005a,b2005b). In addition, blockage of Gβγ or Gαi signalling in our studies failed to attenuate the effects of chloroquine on MCh-induced Ca2+ signalling. Although TAS2R receptors can couple Gαi G-proteins (Sainz et al., 2007), TAS2R predominantly associates with Gα-gustducin in taste bud cells (Kinnamon, 2012). Hence, bronchodilation by TAS2R agonists could be directed by Gα-gustducin or other G-proteins that can associate with TAS2R.
In ASM cells, Ca2+ oscillations are due to Ca2+ mobilization through IP3 receptors (Bai et al., 2009). In this study, UV photolysis of caged-IP3 to generate IP3-induced [Ca2+]i increases was significantly attenuated by the TAS2R10 agonists, indicating that they were either inhibiting or desensitising IP3 receptor opening. This inhibitory effect on IP3-induced Ca2+ increases was not due to depletion of SR Ca2+ because TAS2R10 agonists failed to prevent Ca2+ mobilization through the RyR by caffeine. Additionally, the lack of effect on caffeine-induced Ca2+ signals further rules out other mechanism of Ca2+ handling in ASM. Firstly, it suggested that TAS2R10 agonists are not affecting Ca2+-extrusion pathways (i.e. Na+/Ca2+ exchanger, SERCA, Ca2+-ATPase). If this were the case, caffeine-induced Ca2+ signals would have been reduced by TAS2R10 agonists. Because TAS2R10 agonists did not affect the sustained elevation of [Ca2+]i induced by caffeine, this implies that these agonists do not alter Ca2+ influx.
The inhibitory effects of bitter-taste compounds on the IP3 receptor have also been reported in macrophages, where quinoline-based compounds such as chloroquine and quinine attenuated PLCβ-mediated Ca2+ mobilization by supposedly competing with IP3 binding to IP3 receptor (Misra et al., 1997). This competitive antagonism of the IP3 receptor by chloroquine and quinine, as well as denotonium may be occurring in ASM. However, if competitive antagonism of IP3 receptor was the main mechanism underlying the inhibition of Ca2+ oscillations, chloroquine and quinine should have retained their rank order of potency on MCh- and 5HT-induced Ca2+ oscillations.
While many have demonstrated the association of TAS2R activation with IP3 receptor-dependent Ca2+ signals (Kinnamon, 2012), any inhibitory actions of TAS2R agonists on the IP3 receptor could diminish this effect. This may account for the requirement of high millimolar concentrations of TAS2R10 agonists to evoke increases in ASM [Ca2+]i in our lung slice studies, whereas micromolar concentrations that fully dilated MCh- and 5HT-constricted airways were insufficient. These results suggest that exposure to high concentrations of TAS2R agonists may initially generate sufficient intracellular levels of IP3 to activate the IP3 receptors; however, Ca2+ release is terminated when the IP3 receptors are inhibited by TAS2R agonists.
The molecular mechanisms by which the TAS2R10 agonists inhibit IP3-induced Ca2+ signals remain to be identified. Several proteins are known to interact with IP3 receptors to alter their sensitivity to IP3 and Ca2+ (Narayanan et al., 2012). These include kinases PKA (Danoff et al., 1991), PKG (Komalavilas and Lincoln, 1994) and IRAG (Schlossmann et al., 2000), which can phosphorylate or bind to the IP3 receptor to alter IP3-mediated Ca2+ mobilization. Hence, TAS2R activation could potentially modulate these proteins to decrease the open probability of IP3 receptors.
MCh-induced bronchoconstriction was shown to be a near-linear function of ASM Ca2+ oscillation frequency. In previous studies, the gradient of this relationship was shown to be influenced by the Ca2+ sensitivity of the ASM with an increasing gradient indicating increasing Ca2+ sensitivity (Bai and Sanderson, 2009). Consequently, the fact that chloroquine or quinine reduced the gradient of this relationship implies that the TAS2R10 agonists mediated airway dilation via mechanisms other than reducing Ca2+ oscillation frequency. This effect is most obvious at 10 μM where quinine failed to have any effect on the MCh-induced Ca2+ oscillation frequency, but it still induced bronchodilation by 19%. Similarly, 10 μM chloroquine only reduced the MCh-induced Ca2+ oscillation frequency by 26% but induced bronchodilation of 68%. Thus, the TAS2R10 agonists appear to reduce Ca2+ sensitivity, in addition to Ca2+ oscillations.
To confirm that Ca2+ sensitivity was reduced by TAS2R10 agonists, ASM [Ca2+]i was clamped at a high level using Ca2+-permeabilized ASM cells in which the [Ca2+]i can be controlled by the extracellular Ca2+ concentration (Bai and Sanderson, 2006b; Ressmeyer et al., 2010). After washout of caffeine and ryanodine, subsequent MCh or caffeine exposure failed to alter the [Ca2+]i confirming that the [Ca2+]i had been clamped. Under these conditions of sustained [Ca2+]i, MCh and 5HT, but not caffeine, induced bronchoconstriction indicating an increase in Ca2+ sensitivity. This bronchoconstriction was subsequently reversed by TAS2R10 agonists indicating a decrease in Ca2+ sensitivity. In contrast, Zhang et al. (2013) reported that chloroquine had no effect on ASM contraction in response to elevated extracellular [Ca2+] in α-toxin-permeabilized mouse tracheal muscle strips. This difference may relate to non-specific effects of α-toxin which creates membrane pores that permit, in addition to Ca2+, other ions and small molecules to leak across the cell membrane (Ahnert-Hilger and Gratzl, 1988). In our method of Ca2+ permeabilization, the cell membrane integrity is retained and Ca2+ moves via SOC entry. However, we believe the most important reason for the difference in the response related to Ca2+ sensitivity is that (Zhang et al., 2013) did not address whether TAS2R agonists affected contractile agonist-induced increases in Ca2+ sensitivity. While Ca2+ sensitivity is defined as changes in contraction without a change in [Ca2+]i, the mechanisms modulating Ca2+ sensitivity are commonly stimulated by the same GPCR agonists that stimulate Ca2+ changes. Consequently, to experimentally explore if physiological Ca2+ sensitivity is modulated by bronchodilators, it is essential to have a contractile agonists present.
Although it is possible to induce bronchodilation by either inhibiting Ca2+ oscillations or reducing Ca2+ sensitivity alone, for example, with soluble guanylate cyclase agonists (Perez-Zoghbi et al., 2010) or S,S-formoterol (Delmotte and Sanderson, 2010), respectively, the most efficacious bronchodilators inhibit both parameters. In this study, bronchodilation by chloroquine was attributed equally to inhibition of Ca2+ oscillations and Ca2+ sensitivity. However, quinine had a more complex mechanism where the relative action on Ca2+ oscillations and Ca2+ sensitivity varied with concentration. quinine < 100 μM mediated larger inhibitory effects on MCh-induced Ca2+-sensitivity than Ca2+ oscillations whereas the reverse was observed with quinine > 100 μM. Dilation of 5HT-constricted airways by both chloroquine and quinine was mediated equally by inhibiting both Ca2+ oscillations and Ca2+ sensitivity.
The increase in Ca2+ sensitivity by bronchoconstrictors in Ca2+-permeabilized airways can be mediated by MLCP inhibition by Rho kinase activation (Bai and Sanderson, 2006b; Mukherjee et al., 2013). Hence, TAS2R agonists could be targeting Rho kinase to reduce Ca2+ sensitivity. Alternatively, decreased Ca2+ sensitivity can occur via non-MLCP pathways such as decreased MLCK activity, Ca2+-calmodulin activity or interference with actin polymerization. Further studies will be required to ascertain which pathways are targeted by TAS2R agonists to decrease Ca2+ sensitivity.
In this study, we confirmed that TAS2R agonists were effective bronchodilators in mouse small airways. This bronchodilation was not mediated by elemental Ca2+ signalling, but was due to the inhibition of ongoing Ca2+ oscillations and Ca2+ sensitivity induced by bronchoconstricting agonists. The attenuation of Ca2+ oscillations by the TAS2R10 agonists may be due to inhibition of IP3 receptor activation by contractile agonists. Further elucidation of the complete signalling pathways that link TAS2R receptors on ASM cells to their effects on the activation of IP3 receptors and Ca2+ sensitivity may enable the identification of novel bronchodilators that function through the TAS2R receptor.
Acknowledgments
This work was supported by NIH Grant HL103405.
Glossary
- [Ca2+]i
cytosolic calcium concentration
- ASM
airway smooth muscle
- BKCa
Ca2+-dependent, large-conductance potassium channels
- COPD
chronic obstructive pulmonary disease
- IP3
inositol-1,4,5-trisphosphate
- MCh
methacholine
- MLC
myosin light chain
- MLCK
myosin light chain kinase
- PBST
0.1% triton X-100 PBS solution
- RyR
ryanodine receptor
- SOC
store-operated calcium
- SR
sarcoplasmic reticulum
- TAS2R
taste receptor type 2
Conflict of interest
None.
Supporting Information
Additional Supporting Information may be found in the online version of this article at the publisherʼs web-site: http://dx.doi.org/10.1111/bph.12460
Effects of chloroquine on methacholineconstricted airways
Effects of quinine on methacholine-constricted airways.
Effects of chloroquine on methacholine-induced Ca2+ oscillations.
Effects of quinine on methacholine-induced Ca2+ oscillations.
References
- Ahnert-Hilger G, Gratzl M. Controlled manipulation of the cell interior by pore-forming proteins. Trends Pharmacol Sci. 1988;9:195–197. doi: 10.1016/0165-6147(88)90081-8. [DOI] [PubMed] [Google Scholar]
- Alexander SPH, et al. The Concise Guide to PHARMACOLOGY 2013/14: Overview. Br J Pharmacol. 2013;170:1449–1867. doi: 10.1111/bph.12444. [DOI] [PMC free article] [PubMed] [Google Scholar]
- Ay B, Prakash YS, Pabelick CM, Sieck GC. Store-operated Ca2+ entry in porcine airway smooth muscle. Am J Physiol Lung Cell Mol Physiol. 2004;286:L909–L917. doi: 10.1152/ajplung.00317.2003. [DOI] [PubMed] [Google Scholar]
- Bai Y, Sanderson MJ. Airway smooth muscle relaxation results from a reduction in the frequency of Ca2+ oscillations induced by a cAMP-mediated inhibition of the IP3 receptor. Respir Res. 2006a;7:34. doi: 10.1186/1465-9921-7-34. [DOI] [PMC free article] [PubMed] [Google Scholar]
- Bai Y, Sanderson MJ. Modulation of the Ca2+ sensitivity of airway smooth muscle cells in murine lung slices. Am J Physiol Lung Cell Mol Physiol. 2006b;291:L208–L221. doi: 10.1152/ajplung.00494.2005. [DOI] [PubMed] [Google Scholar]
- Bai Y, Sanderson MJ. The contribution of Ca2+ signaling and Ca2+ sensitivity to the regulation of airway smooth muscle contraction is different in rats and mice. Am J Physiol Lung Cell Mol Physiol. 2009;296:L947–L958. doi: 10.1152/ajplung.90288.2008. [DOI] [PMC free article] [PubMed] [Google Scholar]
- Bai Y, Edelmann M, Sanderson MJ. The contribution of inositol 1,4,5-trisphosphate and ryanodine receptors to agonist-induced Ca(2+) signaling of airway smooth muscle cells. Am J Physiol Lung Cell Mol Physiol. 2009;297:L347–L361. doi: 10.1152/ajplung.90559.2008. [DOI] [PMC free article] [PubMed] [Google Scholar]
- Chandrashekar J, Mueller KL, Hoon MA, Adler E, Feng L, Guo W, et al. T2Rs function as bitter taste receptors. Cell. 2000;100:703–711. doi: 10.1016/s0092-8674(00)80706-0. [DOI] [PubMed] [Google Scholar]
- Cohen SP, Buckley BK, Kosloff M, Garland AL, Bosch DE, Cheng J, et al. Regulator of G-protein signaling-21 (RGS21) is an inhibitor of bitter gustatory signaling found in lingual and airway epithelia. J Biol Chem. 2012;287:41706–41719. doi: 10.1074/jbc.M112.423806. [DOI] [PMC free article] [PubMed] [Google Scholar]
- Dai JM, Kuo KH, Leo JM, Paré PD, van Breemen C, Lee CH. Acetylcholine-induced asynchronous calcium waves in intact human bronchial muscle bundle. Am J Respir Cell Mol Biol. 2007;36:600–608. doi: 10.1165/rcmb.2006-0096OC. [DOI] [PubMed] [Google Scholar]
- Danoff SK, Ferris CD, Donath C, Fischer GA, Munemitsu S, Ullrich A, et al. Inositol 1,4,5-trisphosphate receptors: distinct neuronal and nonneuronal forms derived by alternative splicing differ in phosphorylation. Proc Natl Acad Sci U S A. 1991;88:2951–2955. doi: 10.1073/pnas.88.7.2951. [DOI] [PMC free article] [PubMed] [Google Scholar]
- Delmotte P, Sanderson MJ. Effects of albuterol isomers on the contraction and Ca2+ signaling of small airways in mouse lung slices. Am J Respir Cell Mol Biol. 2008;38:524–531. doi: 10.1165/rcmb.2007-0214OC. [DOI] [PMC free article] [PubMed] [Google Scholar]
- Delmotte P, Sanderson MJ. Effects of formoterol on contraction and Ca2+ signaling of mouse airway smooth muscle cells. Am J Respir Cell Mol Biol. 2010;42:373–381. doi: 10.1165/rcmb.2008-0403OC. [DOI] [PMC free article] [PubMed] [Google Scholar]
- Deshpande DA, Wang WC, McIlmoyle EL, Robinett KS, Schillinger RM, An SS, et al. Bitter taste receptors on airway smooth muscle bronchodilate by localized calcium signaling and reverse obstruction. Nat Med. 2010;16:1299–1304. doi: 10.1038/nm.2237. [DOI] [PMC free article] [PubMed] [Google Scholar]
- Kannan MS, Prakash YS, Brenner T, Mickelson JR, Sieck GC. Role of ryanodine receptor channels in Ca2+ oscillations of porcine tracheal smooth muscle. Am J Physiol. 1997;272(4 Pt 1):L659–L664. doi: 10.1152/ajplung.1997.272.4.L659. [DOI] [PubMed] [Google Scholar]
- Kinnamon SC. Taste receptor signalling – from tongues to lungs. Acta Physiol (Oxf) 2012;204:158–168. doi: 10.1111/j.1748-1716.2011.02308.x. [DOI] [PMC free article] [PubMed] [Google Scholar]
- Komalavilas P, Lincoln TM. Phosphorylation of the inositol 1,4,5-trisphosphate receptor by cyclic GMP-dependent protein kinase. J Biol Chem. 1994;269:8701–8707. [PubMed] [Google Scholar]
- Leybaert L, Sanderson MJ. Intercellular calcium signaling and flash photolysis of caged compounds. A sensitive method to evaluate gap junctional coupling. Methods Mol Biol. 2001;154:407–430. doi: 10.1385/1-59259-043-8:407. [DOI] [PubMed] [Google Scholar]
- Meyerhof W, Batram C, Kuhn C, Brockhoff A, Chudoba E, Bufe B, et al. The molecular receptive ranges of human TAS2R bitter taste receptors. Chem Senses. 2010;35:157–170. doi: 10.1093/chemse/bjp092. [DOI] [PubMed] [Google Scholar]
- Misra UK, Gawdi G, Pizzo SV. Chloroquine, quinine and quinidine inhibit calcium release from macrophage intracellular stores by blocking inositol 1,4,5-trisphosphate binding to its receptor. J Cell Biochem. 1997;64:225–232. doi: 10.1002/(sici)1097-4644(199702)64:2<225::aid-jcb6>3.0.co;2-z. [DOI] [PubMed] [Google Scholar]
- Mukherjee S, Trice J, Shinde P, Willis RE, Pressley TA, Perez-Zoghbi JF. Ca2+ oscillations, Ca2+ sensitization, and contraction activated by protein kinase C in small airway smooth muscle. J Gen Physiol. 2013;141:165–178. doi: 10.1085/jgp.201210876. [DOI] [PMC free article] [PubMed] [Google Scholar]
- Narayanan D, Adebiyi A, Jaggar JH. Inositol trisphosphate receptors in smooth muscle cells. Am J Physiol Heart Circ Physiol. 2012;302:H2190–H2210. doi: 10.1152/ajpheart.01146.2011. [DOI] [PMC free article] [PubMed] [Google Scholar]
- Perez JF, Sanderson MJ. The contraction of smooth muscle cells of intrapulmonary arterioles is determined by the frequency of Ca2+ oscillations induced by 5-HT and KCl. J Gen Physiol. 2005a;125:555–567. doi: 10.1085/jgp.200409217. [DOI] [PMC free article] [PubMed] [Google Scholar]
- Perez JF, Sanderson MJ. The frequency of calcium oscillations induced by 5-HT, ACH, and KCl determine the contraction of smooth muscle cells of intrapulmonary bronchioles. J Gen Physiol. 2005b;125:535–553. doi: 10.1085/jgp.200409216. [DOI] [PMC free article] [PubMed] [Google Scholar]
- Perez-Zoghbi JF, Bai Y, Sanderson MJ. Nitric oxide induces airway smooth muscle cell relaxation by decreasing the frequency of agonist-induced Ca2+ oscillations. J Gen Physiol. 2010;135:247–259. doi: 10.1085/jgp.200910365. [DOI] [PMC free article] [PubMed] [Google Scholar]
- Prakash YS, van der Heijden HF, Kannan MS, Sieck GC. Effects of salbutamol on intracellular calcium oscillations in porcine airway smooth muscle. J Appl Physiol. 1997;82:1836–1843. doi: 10.1152/jappl.1997.82.6.1836. [DOI] [PubMed] [Google Scholar]
- Pulkkinen V, Manson ML, Safholm J, Adner M, Dahlen SE. The bitter taste receptor (TAS2R) agonists denatonium and chloroquine display distinct patterns of relaxation of the guinea-pig trachea. Am J Physiol Lung Cell Mol Physiol. 2012;303:L956–966. doi: 10.1152/ajplung.00205.2012. [DOI] [PubMed] [Google Scholar]
- Ressmeyer AR, Bai Y, Delmotte P, Uy KF, Thistlethwaite P, Fraire A, et al. Human airway contraction and formoterol-induced relaxation is determined by Ca2+ oscillations and Ca2+ sensitivity. Am J Respir Cell Mol Biol. 2010;43:179–191. doi: 10.1165/rcmb.2009-0222OC. [DOI] [PMC free article] [PubMed] [Google Scholar]
- Robinett KS, Deshpande DA, Malone MM, Liggett SB. Agonist-promoted homologous desensitization of human airway smooth muscle bitter taste receptors. Am J Respir Cell Mol Biol. 2011;45:1069–1074. doi: 10.1165/rcmb.2011-0061OC. [DOI] [PMC free article] [PubMed] [Google Scholar]
- Rossler P, Kroner C, Freitag J, Noe J, Breer H. Identification of a phospholipase C beta subtype in rat taste cells. Eur J Cell Biol. 1998;77:253–261. doi: 10.1016/s0171-9335(98)80114-3. [DOI] [PubMed] [Google Scholar]
- Sainz E, Cavenagh MM, Gutierrez J, Battey JF, Northup JK, Sullivan SL. Functional characterization of human bitter taste receptors. Biochem J. 2007;403:537–543. doi: 10.1042/BJ20061744. [DOI] [PMC free article] [PubMed] [Google Scholar]
- Sanderson MJ, Delmotte P, Bai Y, Perez-Zogbhi JF. Regulation of airway smooth muscle cell contractility by Ca2+ signaling and sensitivity. Proc Am Thorac Soc. 2008;5:23–31. doi: 10.1513/pats.200704-050VS. [DOI] [PubMed] [Google Scholar]
- Schlossmann J, Ammendola A, Ashman K, Zong X, Huber A, Neubauer G, et al. Regulation of intracellular calcium by a signalling complex of IRAG, IP3 receptor and cGMP kinase Ibeta. Nature. 2000;404:197–201. doi: 10.1038/35004606. [DOI] [PubMed] [Google Scholar]
- Shah AS, Ben-Shahar Y, Moninger TO, Kline JN, Welsh MJ. Motile cilia of human airway epithelia are chemosensory. Science. 2009;325:1131–1134. doi: 10.1126/science.1173869. [DOI] [PMC free article] [PubMed] [Google Scholar]
- Tazzeo T, Zhang Y, Keshavjee S, Janssen LJ. Ryanodine receptors decant internal Ca2+ store in human and bovine airway smooth muscle. Eur Respir J. 2008;32:275–284. doi: 10.1183/09031936.00167007. [DOI] [PubMed] [Google Scholar]
- Wiener A, Shudler M, Levit A, Niv MY. BitterDB: a database of bitter compounds. Nucleic Acids Res. 2012;40(Database issue):D413–D419. doi: 10.1093/nar/gkr755. [DOI] [PMC free article] [PubMed] [Google Scholar]
- Wright DB, Tripathi S, Sikarwar A, Santosh KT, Perez-Zoghbi J, Ojo OO, et al. Regulation of GPCR-mediated smooth muscle contraction: implications for asthma and pulmonary hypertension. Pulm Pharmacol Ther. 2013;26:121–131. doi: 10.1016/j.pupt.2012.06.005. [DOI] [PubMed] [Google Scholar]
- Zhang CH, Chen C, Lifshitz LM, Fogarty KE, Zhu MS, ZhuGe R. Activation of BK channels may not be required for bitter tastant-induced bronchodilation. Nat Med. 2012;18:648–650. doi: 10.1038/nm.2733. author reply 650–641. [DOI] [PubMed] [Google Scholar]
- Zhang CH, Lifshitz LM, Uy KF, Ikebe M, Fogarty KE, ZhuGe R. The cellular and molecular basis of bitter tastant-induced bronchodilation. PLoS Biol. 2013;11:e1001501. doi: 10.1371/journal.pbio.1001501. [DOI] [PMC free article] [PubMed] [Google Scholar]
- Zhang Y, Hoon MA, Chandrashekar J, Mueller KL, Cook B, Wu D, et al. Coding of sweet, bitter, and umami tastes: different receptor cells sharing similar signaling pathways. Cell. 2003;112:293–301. doi: 10.1016/s0092-8674(03)00071-0. [DOI] [PubMed] [Google Scholar]
- Zhuge R, Bao R, Fogarty KE, Lifshitz LM. Ca2+ sparks act as potent regulators of excitation-contraction coupling in airway smooth muscle. J Biol Chem. 2010;285:2203–2210. doi: 10.1074/jbc.M109.067546. [DOI] [PMC free article] [PubMed] [Google Scholar]
Associated Data
This section collects any data citations, data availability statements, or supplementary materials included in this article.
Supplementary Materials
Effects of chloroquine on methacholineconstricted airways
Effects of quinine on methacholine-constricted airways.
Effects of chloroquine on methacholine-induced Ca2+ oscillations.
Effects of quinine on methacholine-induced Ca2+ oscillations.


