

Abstract
Background and Purpose
AT1 receptor antagonists decrease body weight gain in models of murine obesity. However, fewer data are available concerning the anti-obesity effects of these antagonists, given as a treatment after obesity had been established.
Experimental Approach
In spontaneously hypertensive rats, obesity was established by cafeteria diet (CD) feeding for 19 weeks. Rats were then were treated with telmisartan (8 mg·kg−1·d−1) or amlodipine (10 mg·kg−1·d−1; serving as blood pressure control) or telmisartan + amlodipine (2 + 10 mg·kg−1·d−1; to control for dose-dependency) for 17 weeks. Rats receiving only chow (Cchow) or CD-fed rats treated with vehicle (CCD) served as controls.
Key Results
The CD feeding induced obesity, hyperphagia, hyperlipidaemia, and leptin and insulin resistance. Telmisartan reduced the CD-induced increase in body weight and abdominal fat mass. Whereas energy intake was higher rather than lower, the respiratory ratio was lower. After telmisartan, leptin-induced energy intake was reduced and respiratory ratio was increased compared with CCD rats. Telmisartan also decreased plasma levels of triglycerides, free fatty acids and low-density lipoprotein. Amlodipine alone or the combination telmisartan + amlodipine did not affect body weight and eating behaviour. Telmisartan, but not amlodipine and telmisartan + amlodipine, improved glucose utilization. The decrease in BP reduction was almost the same in all treatment groups.
Conclusions and Implications
Telmisartan exerted anti-obesity effects and restored leptin sensitivity, given as a treatment to rats with obesity. Such effects required high doses of telmisartan and were independent of the decrease in blood pressure.
Keywords: obesity, AT1-receptor blockade, telmisartan, weight loss, leptin resistance, metabolic syndrome, rat
Introduction
The renin–angiotensin–aldosterone system (RAAS) is a well-known regulator of cardiovascular function, but it also affects the metabolic system. Blockade of RAAS beneficially influences glucose homeostasis in clinical settings (Scheen, 2004a,2004b) and, in particular, experimental findings indicate its potency for weight regulation. White adipose tissue expresses angiotensinogen, the relevant enzymes (renin, ACE, chymase) to convert it to angiotensin II (AngII) as well as the angiotensin AT1 receptors Karlsson et al., 1998; Engeli et al., 1999; receptor nomenclature follows Alexander et al., 2013). AngII promotes the differentiation of preadipocytes into adipocytes and it also affects the release of various adipocytokines, including leptin, from adipocytes (Skurk et al., 2005), which itself regulates food intake. As leptin is anorectic, it is likely that chronic AngII administration induces weight loss (Cabassi et al., 2005) by decreasing food intake (Brink et al., 1996) and stimulating sympathetic nerve activity, lipolysis and thermogenesis (Cassis et al., 2004). Recently, we found that AngII-induced weight loss only in lean, but not in obese Zucker rats, which calls into question the efficacy of AngII to induce weight loss in obese individuals (Müller-Fielitz et al., 2012b; Müller-Fielitz and Raasch, 2013). In obesity, however, plasma levels of angiotensinogen and AngII correlate positively with body weight (Engeli et al., 2005; Harte et al., 2005) and the RAAS is activated (Giacchetti et al., 2002; Boustany et al., 2004; Engeli et al., 2005). Moreover, plasma concentrations of renin, angiotensinogen and aldosterone and plasma ACE activity were normalized when obese women lost ∼5 kg (Engeli et al., 2005).
Chronic treatment with AT1 receptor antagonists (AT1 receptor blockers; ARBs) reduced weight gain in rats (Kohya et al., 1995; Benson et al., 2004; Zorad et al., 2006; Zanchi et al., 2007; Müller-Fielitz et al., 2011; 2012a,; Miesel et al., 2012) and mice (Schupp et al., 2005; Rong et al., 2010). In view of the effects of AngII, it was surprising that blockade of AT1 receptors also reduced weight. Although the mechanisms underlying ARB-induced weight loss is still a matter of debate, food intake was not (Benson et al., 2004; Schupp et al., 2006; Sugimoto et al., 2006; Zanchi et al., 2007; He et al., 2010) or only temporarily reduced (Zorad et al., 2006; Miesel et al., 2012; Müller-Fielitz et al., 2012a) in response to AT1 receptor blockade, but the energy expenditure was increased (Araki et al., 2006; Sugimoto et al., 2006). Compatible with these findings after AT1 receptor blockade, there was also a reduction in the weights of mice lacking both AT1A and AT1B receptors, (double knock-out; Gembardt et al., 2008), which strengthens the importance of the pharmacological insights regarding ARBs.
The weight-lowering efficacy of ARBs has almost exclusively been demonstrated when ARBs were co-administered with high-calorie feeding in a preventive setting or in genetic models of obesity, neither of which reflects the clinical situation of most patients suffering from the metabolic syndrome. In these patients, drug treatment is initiated in the presence of clinical symptoms and not prophylactically. Therefore, in this study we primarily investigated weight regulation and food behaviour, but ARB treatment with telmisartan was not initiated until obesity was clearly developed, due to hyperphagia of a high calorie, good tasting cafeteria diet (CD). We performed our experiments in rats exhibiting not only obesity, but also all the other symptoms of the metabolic syndrome (insulin resistance, hyperlipidaemia and hypertension), a model optimally reflecting the human situation (Miesel et al., 2010). Assessment of the effects of telmisartan on the other symptoms of the metabolic syndrome were secondary aims of our work. We assessed the correlation with blood pressure reduction by including a group treated with amlodipine alone. Also, in earlier work, the weight of lean, spontaneously hypertensive rats (SHR) was reduced only when the ARB candesartan was administered at supranormal doses (Müller-Fielitz et al., 2011). Therefore, in the present study, we gave telmisartan at a high dose (8 mg·kg−1·d−1), as described by Miesel et al., 2012; Müller-Fielitz et al., 2012a, and at a normal dose (2 mg·kg−1·d−1). The normal dose of telmisartan was combined with amlodipine to achieve an antihypertensive effect, equal to that of the high dose of telmisartan.
Methods
Animals
All animal care and experimental procedures were in accordance with the National Institutes of Health guidelines for the care and use of laboratory animals and were approved by the ethics committee of the local regulatory authority (Ministerium für Energiewende, Landwirtschaft, Umwelt und ländliche Räume des Bundeslandes Schleswig-Holstein). The results of all studies involving animals are reported in accordance with the ARRIVE guidelines (Kilkenny et al., 2010; McGrath et al., 2010). A total of 60 animals were used in the experiments described here. Eight-week-old male, SHR (NCrI, Charles River, Sulzfeld, Germany) were used. The animals were kept in pairs at room temperature with a 12 h/12 h dark (0200–1400 h)/light (1400–0200 h) cycle. Five days before starting the study, rats were habituated to research assistants and vice versa. After the habituation period, animals were randomized to one of the five groups.
Feeding and drug treatment
One group of SHR (n = 12) was fed solely with standard chow (consisting of 6% disaccharides, 30% polysaccharides and 4% fat; calorific value: 11.7 kJ·g−1; Maintenance 1320, Altromin, Lage, Germany) and served as chow-fed lean controls (Cchow). A second group of SHR (n = 12) had free access throughout the entire duration of study to standard chow and CD (10 various commercial chocolate and cookie bars, consisting of 60.1 ± 3.0% carbohydrates; 24.9 ± 2.2% fat 6.5 ± 0.7% protein 2.1 ± 0.4% fibre; calorific content: 20.3 ± 0.5 kJ·g−1). Rats received only one kind of chocolate and cookie bar per day, these being switched daily in a regular manner (Miesel et al., 2010). This group is referred to in the following as CD-fed controls (CCD). Three further groups of SHR (n = 12 each group) could also freely choose between chow and CD. After 19 weeks of CD feeding, rats were treated by gavage with either telmisartan (8 mg·kg−1·d−1), amlodipine (10 mg·kg−1·d−1), or the combination telmisartan+amlodipine (2 + 10 mg·kg−1·d−1) while maintaining CD feeding (Supporting information Figure S1). In a dose-finding pilot study, doses of drugs to lower blood pressure equi-effectively were determined (Supporting information Figure S2A; mean fall in blood pressure; telmisartan: 76 ± 7, amlodipine: 62 ± 5; telmisartan + amlodipine: 71 ± 7 mmHg, P > 0.05). For drug administration, drugs were suspended in distilled water using gum arabic (10% w·v−1) to achieve final concentrations of 8 mg·mL−1 (telmisartan), 10 mg·mL−1 (amlodipine) and 2 + 10 mg·mL−1 (telmisartan + amlodipine), respectively, and were then kept at 4°C for not more than 1 week. Cchow and CCD were given identical volumes of gum arabic suspension (10% w·v−1; 1 μL·g−1). All animals had free access to water.
Test protocols
The time schedule is outlined in Supporting information Figure S1. The weights of the rats as well as their food and water intakes were monitored by daily weighing at 1400 h at the beginning of the light cycle. At week 35, abdominal girth and body length were determined in sedated animals, without knowledge of the treatments. Body mass index (BMI) was calculated from body weight and body length (not including tail length). Blood samples were taken at week 18 (day 122 nonfasting, day 123 fasting for 18 h) and at week 25 (nonfasting) to determine endocrine and metabolic variables.
The systolic blood pressure (SBP) and heart rate were determined at weeks 19 (before drug treatment), 22 and 34 by tail plethysmography in conscious rats as described elsewhere (Raasch et al., 2002). Randomized measurements were performed only between 0900 and 1300 h to avoid circadian variations.
After week 30, the respiratory exchange rate (RER) of each rat was determined while in its home cage within 3 days by using the PhenoMaster System™ (TSE, Bad Homburg, Germany). The total activity was simultaneously monitored by sensing the body-heat image via infrared radiation (InfraMot System™, TSE). In parallel, drinking and feeding behaviours were determined with high-precision sensors (TSE).
At week 35, glucose, insulin and glucagon levels were determined during an oral glucose tolerance test (OGTT; 1 g glucose·kg−1) in rats that had been deprived of food for 18 h. EDTA-blood (80 μL) was withdrawn before and after glucose administration (Miesel et al., 2012; Müller-Fielitz et al., 2012a). Two days later, the glucose levels were monitored during an insulin tolerance test (ITT, 0.6 IU insulin·kg−1, s.c.) in SHR that had been deprived of food for 18 h. Glucose was determined before and during a 360 min period in blood samples (Miesel et al., 2012; Müller-Fielitz et al., 2012a).
Fat distribution was determined at the end of the 35th week in anaesthetized SHR (pentobarbitone 75 mg·kg−1, i.p.) by employing the magnetic resonance tomography technique (Philips, Achieva, 1.5 Tesla with the use of an 8-channel knee coil, a transverse T1-weighted turbo spin-echo sequence and an imaging matrix of 320 × 320 pixels). Images were recorded from the anus to the diaphragm (section thickness 2 mm; gap 0) and analysed with respect to the amount of intraabdominal fat by semi-automated image segmentation software that employs a contour-following algorithm.
During the 36th week, a leptin resistance test (LRT) was performed. We injected leptin (R&D Systems, Inc., Minneapolis, MN, USA, n = 10) at 0800, 1100, 1400 and 1700 h (100 μg·kg−1 s.c. each time) and at 1600 h (200 μg·kg−1 s.c.). The next day rats were treated with leptin again at 0800 h (100 μg·kg−1 s.c.), 1100 h (100 μg·kg−1 s.c.) and 1400 h (200 μg·kg−1 s.c.). Blood for leptin measurements was drawn at 0800, 1100, 1400 and 1700 h, and again at 0800 on the second day. Body weights and energy intake were also determined. The intake of food and the weights of rats were measured during the second day of LRT by using the PhenoMaster System (TSE). Hypophagic potency of leptin was ascertained in Sprague Dawley rats by injecting leptin or saline (see Supporting Information).
One week after LRT tests, rats were killed at 1400 h; trunk blood was taken and organs were removed for biochemical and molecular analyses. To determine AngII, blood (2 mL) was collected into an inhibitor solution containing 12.1 mM EDTA and 20 μM bestatin (final concentration).
Biochemical analyses
Plasma concentrations of adiponectin, insulin, leptin, glucagon (all from Linco, St. Charles, MO, USA), or AngII (IBL, Hamburg, Germany) were determined by RIA using commercial kits (Miesel et al., 2010; 2012,; Müller-Fielitz et al., 2012a). Blood glucose was determined using glucose sensors (Ascensia® ELITE XL, Bayer, Leverkusen, Germany). Free fatty acids (FFA), high-density lipoprotein (HDL), low-density lipoprotein (LDL) and triglycerides (TG) were quantified in plasma of fasting animals using a Roche/Hitachi Modular P Chemistry Analyser (Mannheim, Germany). mRNA levels of (an-)orexigenic peptides were determined in hypothalami as previously described (Miesel et al., 2010; see also Supporting Information).
Data analysis
Data are expressed as means ± SEM. As described earlier, rats were fed either with chow or with chow + CD. Due to the different calorie values of chow (11.7 kJ·g−1) and CD (20.3 kJ·g−1), we individually calculated the energy intake (in kJ) of each rat to correctly assess food intake on the basis of the consumed amounts of chow and CD. Chow and CD were regularly balanced out.
The amount of fat was semi-automatically quantified in retroperitoneal fat pads and in subcutaneous fat on the basis of the transverse T1-weighted turbo spin-echo images by using the freeware MRIcro Version 1.4 build 1 (http://downloads.fyxm.net/MRIcro-117936.html) and the Vitom for Windows software (Essen, Deutschland). Only intensity signals of > 80 gray scale were considered to ensure that fat was being analysed.
The homeostasis model assessment (HOMA) index was calculated from the plasma levels in fasting animals according to the formula insulin (μU·mL−1) × glucose (mg·dL−1)/405. In order to quantify the total effect over the observation period in response to OGTT or ITT for changes in plasma concentrations of glucose, the areas under the curves (AUC) were calculated for each individual animal on the basis of the change relative to the value at zero time (referred to as Δ values). Accordingly, the maximal concentration increases (Cmax) in glucose or insulin were also calculated from the Δ values. Half-life of glucose decline after insulin exposure was calculated after transformation (loge) of the glucose concentrations (between 6 and 42 min after insulin injections) and by determining the slopes of linear regression lines.
Correlation coefficients (two-tailed P-values) were computed according to Pearson, assuming a Gaussian distribution, by using GraphPad Prism, Version 4 (GraphPad Software, Inc., La Jolla, CA, USA). A two-way anova, followed by Bonferroni's post hoc test for multiple comparisons was performed to examine the effects of two variables. Differences were considered to be statistically significant at P < 0.05.
Materials
Telmisartan and amlodipine were generous gifts from Boehringer Ingelheim Pharmaceuticals, Inc. (Ridgefield, CT, USA).
Results
Before drug treatment
At the end of the 19 week feeding period, all CD-fed rats developed the metabolic syndrome, as they were hyperphagic, obese, hyperlipidemic, insulin resistant, and hypertensive. irrespective of whether they belonged to the CCD-, telmisartan, amlodipine or telmisartan + amlodipine groups. Although SBP did not differ between the groups at week 19, the heart rate was lower in Cchow than in any CCD group (Supporting information Figure S2B/C). Body weight increased time-dependently over the first 19 week period of CD feeding in the CCD, telmisartan, amlodipine or telmisartan + amlodipine groups. As a result of CD feeding, the weight gain (Figure 1A) and the total energy intake (Figure 2A) were markedly higher in all these groups than in Cchow rats. Moreover, plasma levels of leptin, adiponectin, serum TGs, free fatty acids and LDL were higher in CCD, telmisartan, A, or telmisartan + amlodipine groups than in Cchow rats (Supporting information Table S1). Before drug treatment was initiated on day 133, it was obvious that energy intake was higher in CCD, telmisartan, amlodipine or telmisartan + amlodipine groups than in the Cchow group although plasma leptin was increased in these rats (Figure 2C). This implies that rats became leptin resistant. Non-fasting levels of blood glucose and insulin were higher in CCD, telmisartan, A or telmisartan + amlodipine groups than in the Cchow group, indicating that long-term CD feeding caused insulin resistance (Supporting information Table S1).
Figure 1.
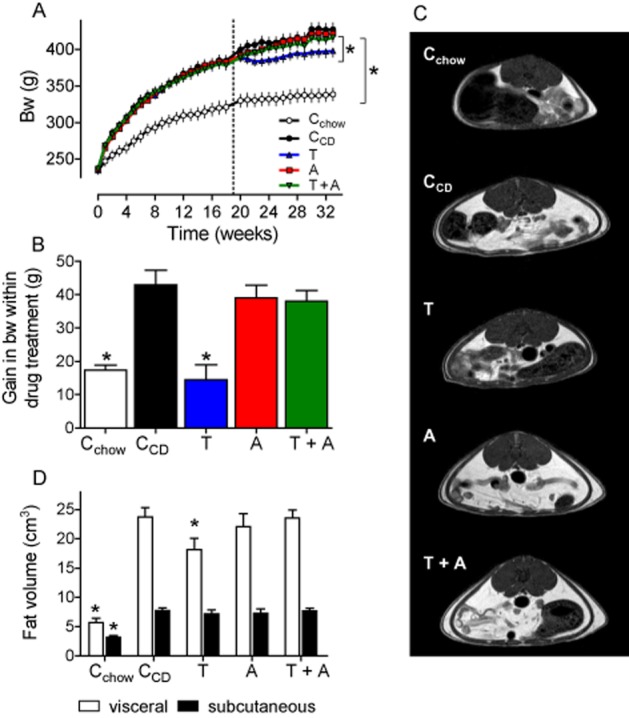
Body weight is reduced by telmisartan (T), but not by amlodipine (A) or the combination telmisartan + amlodipine (T + A). A: Time-dependent increase in body weight. The dotted line indicates the beginning of drug treatment. B: gain in bw within the 17-week period of drug treatment. C: Typical magnetic resonance tomography (MRT) images obtained by transverse T1-weighted turbo spin-echo MRT. D: The abundance of visceral (open bars) and subcutaneous (closed bars) fat deposits was quantified by computer-assisted planimetry. Means ± SEM, n = 11–12. *P < 0.05 versus CCD.
Figure 2.
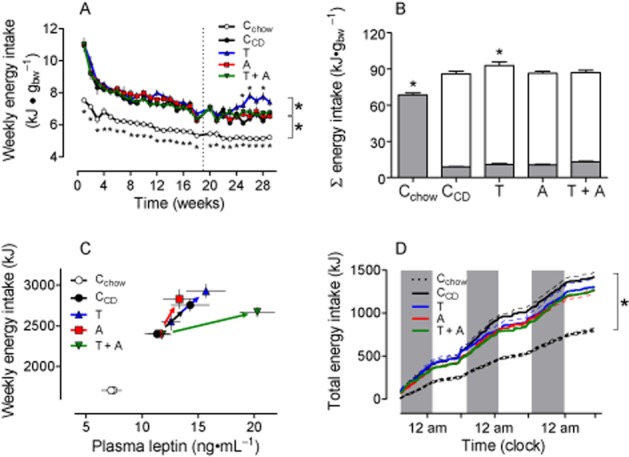
Energy intake is increased by CD feeding, but not reduced by drug treatment. A: Compared with CD-fed rats, energy intake is even further enhanced by telmisartan (T) during the last weeks of treatment, but remained unaffected by amlodipine (A) or telmisartan + amlodipine (T + A) treatment. The dotted line indicates the beginning of drug treatment. B: Cumulative energy intake related to body weight during treatment period. The filled bars represent the proportion fed with chow, the open bars the proportion with CD. C: Correlation between plasma leptin and energy intake before and after the drug treatment. Arrows indicate a shift to higher values, representing the data at the end of drug treatment. D: Energy intake during calorimetry. The gray bars indicate the dark periods. Means ± SEM, n = 11–12, *P < 0.05 versus CCD.
During drug treatment
Effects on haemodynamics
Blood pressure remained stable in CCD and Cchow groups during drug treatment (Supporting information Figure S2B). Treatment with telmisartan or telmisartan + amlodipine reduced blood pressure in an equieffective manner to normotensive values. Although amlodipine reduced blood pressure after 2 weeks, comparable with telmisartan and telmisartan + amlodipine, the antihypertensive efficacy of amlodipine was slightly lower at the end of the study (Supporting information Figure S2B). Levels of circulating AngII were similar between CCD and Cchow groups but markedly increased in telmisartan and telmisartan + amlodipine-treated rats, which was attributed to the well-known, renin-dependent feedback mechanism (Table 2).
Table 2.
Influence of telmisartan (T), amlodipine (A) or a combination of the two (T + A) on various endocrine and metabolic parameter in plasma of rats that that were continuously fed with CD
| Cchow | CCD | T | A | T + A | |
|---|---|---|---|---|---|
| Leptin (ng·mL−1)c | 6.0 ± 0.5* | 16.6 ± 1.5 | 15.7 ± 2.2 | 15.7 ± 2.2 | 15.2 ± 2.6 |
| Adiponectin (μg·mL−1)d | 3.8 ± 0.2* | 6.4 ± 0.2 | 4.6 ± 0.3* | 5.4 ± 0.3* | 4.7 ± 0.1* |
| Triglycerides (mmol·L−1)b | 0.68 ± 0.02* | 0.88 ± 0.05 | 0.73 ± 0.03* | 0.80 ± 0.03 | 0.78 ± 0.03 |
| Free fatty acids (mmol·L−1)b | 1.15 ± 0.06* | 1.54 ± 0.06 | 1.33 ± 0.02* | 1.55 ± 0.06 | 1.54 ± 0.07 |
| HDL (mmol·L−1)b | 0.62 ± 0.02* | 0.057 ± 0.01 | 0.62 ± 0.02* | 0.59 ± 0.01 | 0.57 ± 0.01 |
| LDL (mmol·L−1)b | 0.14 ± 0.01* | 0.19 ± 0.01 | 0.18 ± 0.01 | 0.17 ± 0.01 | 0.17 ± 0.01 |
| Total cholesterol (mmol·L−1)b | 2.31 ± 0.15 | 2.28 ± 0.02 | 2.30 ± 0.09 | 2.45 ± 0.06 | 2.24 ± 0.05 |
| Glucosenonfasting (mmol·L−1)a | 4.98 ± 0.14* | 5.97 ± 0.35 | 6.66 ± 0.13 | 6.51 ± 0.19 | 6.23 ± 0.15 |
| Glucosefasting (mmol·L−1)b | 2.84 ± 0.09 | 3.21 ± 0.15 | 3.69 ± 0.29* | 3.36 ± 0.15 | 3.82 ± 0.23* |
| Insulinnonfasting (ng·mL−1)a | 6.08 ± 0.47 | 5.95 ± 0.63 | 7.25 ± 0.62* | 6.18 ± 0.62 | 7.18 ± 0.20* |
| Insulinfasting (ng·mL−1)b | 0.21 ± 0.06* | 0.89 ± 0.13 | 1.75 ± 0.35* | 0.99 ± 0.17 | 1.61 ± 0.25* |
| HOMA indexb | 0.68 ± 0.26* | 3.16 ± 0.60 | 7.94 ± 2.36* | 3.74 ± 0.75 | 7.11 ± 1.64* |
| Glucagonnonfasting (pg·mL−1)a | 239.6 ± 17.0* | 122.2 ± 9.4 | 176.1 ± 17.8* | 117.8 ± 10.7 | 154.4 ± 24.6 |
| Glucagonfasting (pg·mL−1)b | 96.1 ± 7.6* | 67.0 ± 6.3 | 82.3 ± 6.9* | 64.1 ± 6.8 | 66.6 ± 6.7 |
| AngII (pmol·L−1)d | 15.6 ± 1.2 | 18.9 ± 2.8 | 169.9 ± 10.1* | 62.9 ± 9.3* | 137.6 ± 13.5* |
Controls received vehicle and were fed with CD (CCD) or only chow (Cchow). Blood samples were taken on days
171
238
249
255
Means ± SEM (n = 10–12),
P < 0.05 versus CCD.
Body weight, energy intake, and energy expenditure
During the drug treatment period, the weights of CCD rats increased further. Amlodipine and telmisartan + amlodipine treatment did not affect the weight gain. In contrast, telmisartan reduced any gain in body weight by 7% and the magnitude of this increase was similar to that observed in the Cchow group (Figure 1A/B). The weight gain in CCD rats can primarily be attributed to an increase in fat mass because body length (+3%) and femur length (+4%) were only marginally increased, but BMI (+16%) and girth (+6%) markedly so (Table 1). According to the body weight, only telmisartan reduced BMI and girth, but amlodipine or telmisartan + amlodipine did not (Table 1). The increase in body weight, BMI and girth of CCD rats was accompanied by an increased amount of visceral and subcutaneous fat (Figure 1C/D). Telmisartan selectively decreased the visceral fat mass compared with that in CCD rats (Figure 1C/D).
Table 1.
Influence oftelmisartan (T), amlodipine (A) or a combination of the two (T + A) on growth parameters of rats that were continuously fed with CD
| Cchow | CCD | T | A | T + A | |
|---|---|---|---|---|---|
| BMI | 7.21 ± 0.11* | 8.36 ± 0.14 | 7.86 ± 0.11* | 8.13 ± 0.12 | 8.05 ± 0.11 |
| Girth (cm) | 17.6 ± 0.1* | 18.7 ± 0.1 | 18.0 ± 0.2* | 18.6 ± 0.2 | 18.4 ± 0.3 |
| Length (cm) | 21.7 ± 0.2* | 22.3 ± 0.2 | 22.0 ± 0.1 | 22.2 ± 0.1 | 22.2 ± 0.1 |
| Femur length (mm) | 37.8 ± 0.4* | 39.2 ± 0.2 | 38.9 ± 0.3 | 39.1 ± 0.3 | 39.1 ± 0.2 |
| Liver weight (g) | 11.8 ± 0.3 | 12.3 ± 0.4 | 12.0 ± 0.3 | 11.7 ± 0.3 | 12.3 ± 0.4 |
| Kidney weight (g) | 1.32 ± 0.02 | 1.32 ± 0.03 | 1.27 ± 0.01 | 1.28 ± 0.02 | 1.27 ± 0.02 |
| Adrenal weight (mg) | 24.3 ± 1.0* | 28.2 ± 0.7 | 29.5 ± 0.8 | 27.1 ± 0.6 | 29.0 ± 0.5 |
Controls received vehicle and were also fed with CD (CCD) or received only chow (Cchow). Means ± SEM (n = 10–12),
P < 0.05 versus CCD.
At the end of the study, plasma leptin and adiponectin had approximately doubled in all rats, compared with th e levels in the Cchow group. Adiponectin, but not leptin levels were lower in telmisartan −, amlodipine or telmisartan + amlodipine-treated rats than in the CCD group (Table 2). Compared with CCD rats, only telmisartan reduced TGs, FFA and LDL whereas HDL was normalized (Table 2).
When rats were treated with amlodipine or telmisartan + amlodipine, energy intake still remained at the same levels as in CCD rats for weeks. In telmisartan-treated rats, the energy intake even exceeded the levels in the CCD group at the end of the study (Figure 2A/B). Comparable food behaviour was detected in rats during calorimetry, except that energy intake of telmisartan-treated rats and CCD rats was similar (Figures 2D, 3I–L). As mentioned earlier, CD feeding led to leptin resistance within the initial feeding period. A right and upwards shift of correlated leptin and energy intake values at the end of the drug treatment period suggested that leptin resistance was still pronounced (Figure 2C). This conclusion is compatible with our findings that hypothalamic (an)orexigenic peptides were only minimally altered in drug-treated rats (Supporting information Figure S3).
Figure 3.

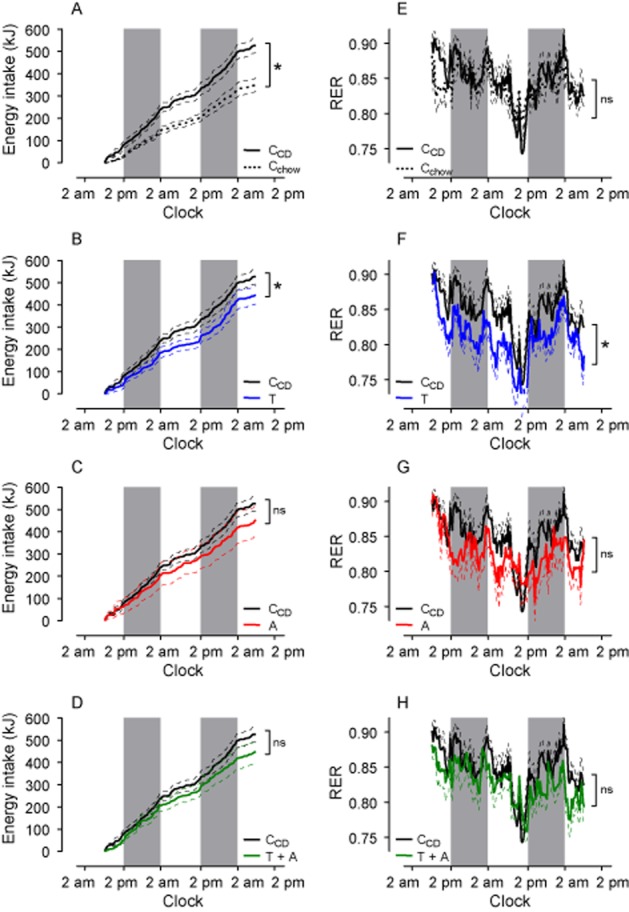
RER (A–D) is selectively reduced by telmisartan (T), but not by amlodipine (A) or the combination telmisartan + amlodipine (T + A). E–H: VO2 did not differ between groups. I–L: cumulative energy intake was reduced in Cchow, but remained unchanged in telmisartan-, amlodipine- and telmisartan + amlodipine-treated rats. M–P: The locomotion of rats was increased during the dark period when fed with CD, but was not influenced compared with CCD by any drug treatment. RER, energy intake and locomotion are depicted only at the third day of measurements. The gray bars indicate the dark periods. Means ± SEM, n = 11–12, *P < 0.05 versus CCD.
We observed a circadian rhythm of RER and oxygen consumption (VO2) in Cchow and CCD and in drug-treated animals, levels being higher in the active period (Figure 3A–D, E–H). RER and VO2 were not different between the CCD and Cchow groups (Figure 3A/E), which established that the CCD rats had become obese because energy intake and expenditure were not balanced. RER, but not VO2 was reduced during the dark and light period in telmisartan-treated rats, suggesting that fat oxidation was increased in these rats (Figure 3B/F). In contrast, treatment with amlodipine or telmisartan + amlodipine had no effects on RER and VO2 (Figure 3C/D/G/H). A similar pattern could be observed when RER was monitored during the leptin-resistance tests (Figure 4E–H). The locomotion was higher in CCD than in Cchow groups but not affected by telmisartan, amlodipine or telmisartan + amlodipine treatment (Figure 3M–P).
Figure 4.
CD feeding induces leptin resistance, which is selectively alleviated by telmisartan. At the first day, leptin was injected at 0800, 1100, 1400 and 1700 h (100 μg·kg−1 s.c. each time) and at 2000 h. (200 μg·kg−1 s.c.). At the second day, rats were treated with leptin at 0800 and 1100 h (100 μg·kg−1 s.c.) and at 1400 h (200 μg·kgv−1 s.c.). The gray bars indicate the dark periods. A: The energy intake after exogenous leptin is increased in CD- (CCD) compared with chow-fed controls (Cchow), which indicates leptin resistance. B–D: Leptin sensitivity is partially restored by telmisartan (T), but not by amlodipine (A) and the combination telmisartan + amlodipine (T + A). E–H: RER during the leptin exposure was only diminished by telmisartan compared with CCD, but not by amlodipine and telmisartan +amlodipine. Means ± SEM, n = 11–12, *P < 0.05 versus CCD.
Energy intake was decreased after leptin compared with saline injections in chow-fed SD rats, demonstrating its hypophagic potency (Supporting information Figure S5). For functional proof of leptin sensitivity after long-term treatment with telmisartan in obese rats, we performed a LRT. In response to exogenous leptin injections, the AUC of the plasma leptin time curve was slightly higher in CCD than in Cchow rats (Supporting information Figure S6). Compared with values in CCD rats, AUC was doubled by telmisartan but unaffected by amlodipine and telmisartan + amlodipine, although rats received weight-adjusted leptin doses (Supporting information Figure S6B). In response to exogenous leptin, the cumulative energy intake over 48 h was higher in CCD than in the Cchow group, confirming the leptin resistance in these rats (Figure 4A). When rats were treated with telmisartan, energy intake was reduced after leptin compared with CCD rats, suggesting that leptin sensitivity is at least partially restored (Figure 4B). This was not observed in amlodipine − or telmisartan + amlodipine-treated rats (Figure 4C/D).
Alterations in glucose utilization
The CCD group developed insulin resistance because fasting insulin levels were clearly higher than in the Cchow group and the HOMA index was > 3 (Table 2). However, it was noticeable that, on the one hand, glucose and insulin levels of fasting or non-fasting telmisartan-treated rats are higher than in CCD, rats and, on the other hand, that glucagon was normalized selectively by telmisartan (Table 2). The insulin resistance of CCD rats compared with the Cchow group was confirmed as glucose and insulin levels were enhanced in response to the glucose challenge (Figure 5), and the glucose-lowering potency of insulin was diminished in such animals (Figure 6). The glucose responses in OGTT after telmisartan and telmisartan + amlodipine were almost the same as those of the Cchow group as AUC, and in particular, Cmax were almost normalized, but not when rats were only treated with amlodipine (Figure 5B/C). Compared with CCD, peak insulin levels were diminished by telmisartan, amlodipine and telmisartan + amlodipine, whereas AUCs were reduced only by amlodipine and telmisartan + amlodipine (Figure 5E/F). The insulin sensitivity was normalized by telmisartan as well as by telmisartan + amlodipine, but not by amlodipine alone, because both the magnitude and the speed of glucose decline was similar to that of the Cchow group (Figure 6B–D).
Figure 5.
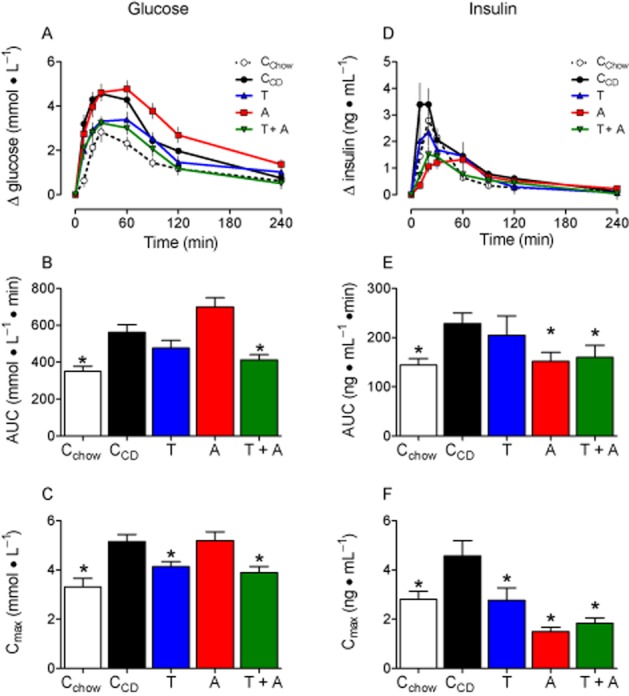
Glucose utilization is impaired in CD-fed rats, but normalized by telmisartan. A: Plasma glucose levels in response to an OGTT (1 g glucose·kg−1). B: Compared with CD-fed controls (CCD), the AUCs were lower in Cchow and telmisartan + amlodipine (A) (T + A)-treated rats and only. C: Due to glucose exposure the maximal increase in plasma glucose was higher in CCD than in Cchow, but normalized by telmisartan and telmisartan + amlodipine. D: Insulin increased in response to glucose administration in all groups of rats. E + F: The AUCs and Cmax were higher after CD feeding and reduced by telmisartan (only Cmax), amlodipine and telmisartan + amlodipine Means ± SEM, n = 11–12, *P < 0.05 versus CCD.
Figure 6.
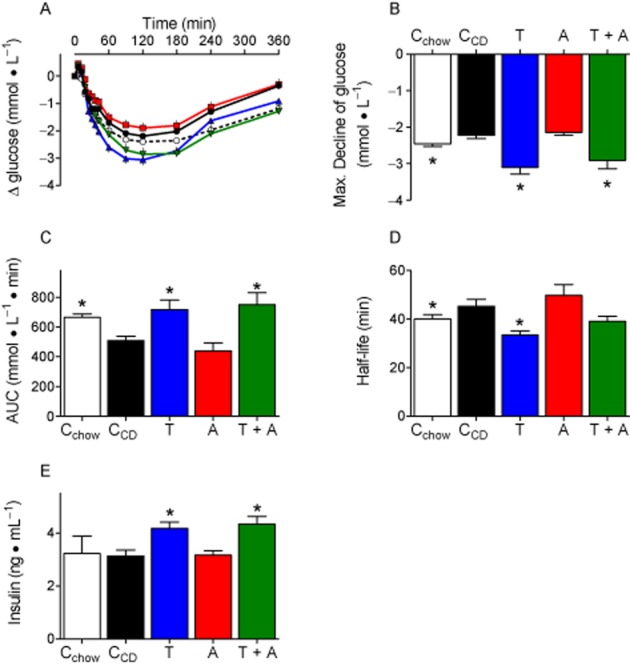
Insulin response is impaired by CD feeding, but improved by telmisartan. A: Glucose plasma concentrations after insulin injections (0.6 IU insulin·kg−1, s.c.). B + C: The maximal glucose decrease (B) and the AUC (C) were lower in CCD than in Cchow, indicating impaired glucose utilization. Both parameters were improved by telmisartan (T) and telmisartan + amlodipine (T + A), but not byamlodipine (A). D: Half-life of glucose decline was quantified after ln transformation and determining slopes of regression lines. The fitting (R2) considering plasma values between 6 and 42 min was quite good and did not differ between groups (Cchow: 0.9436 ± 0.0099, CCD: 0.8293 ± 0.0247, telmisartan: 0.9288 ± 0.01449, amlodipine: 0.8457 ± 0.0268, telmisartan + amlodipine: 0.8658 ± 0.0406). Compared with CCD, glucose declined faster in telmisartan-, but not in telmisartan + amlodipine- (P = 0.0640) treated rats. E: Plasma insulin was controlled 24 min after insulin injections. Insulin concentrations were higher in telmisartan and telmisartan +amlodipine treated animals. Means ± SEM, n = 11–12, *P < 0.05 versus CCD.
Discussion
The goal of this study was to elucidate the functional role of chronic AT1 receptor blockade in body weight regulation, food behaviour and energy expenditure in rats that were clearly showing all the symptoms of the metabolic syndrome. The key findings are: (i) the ARB telmisartan induced weight loss when given as a treatment to rats with obesity originating from long-term, high-calorie feeding with the CD; (ii) this weight loss may be related more to increased energy expenditure than to decreased energy intake; and (iii) leptin sensitivity was at least partially restored, which may have contributed to adjusting the imbalance between energy intake and expenditure. All these effects occurred independently of blood pressure reduction because amlodipine alone had no effect and only after administering telmisartan at supranormal, but not at normal, doses as used in the telmisartan + amlodipine group, confirming previous findings (Müller-Fielitz et al., 2011). Thus, it seems rather unlikely that ARB in therapeutic doses would exhibit any anti-obesity properties that could be beneficial for the treatment of obese hypertensive patients.
Anti-obesity effects
In contrast to our previous reports showing anti-obesity effects of ARBs when drugs were prophylactically administered (Miesel et al., 2012; Müller-Fielitz et al., 2012a), we specifically investigated in this study whether similar effects could also be observed when drug treatment was initiated after CD feeding for a 19-week period. These animals had developed all the signs of the metabolic syndrome, in particular, hyperleptinaemia, hyperlipidaemia, obesity, insulin resistance and high blood pressure. Although body weight and fat mass were not normalized to levels of the Cchow group as seen in our previous study following a preventive drug regimen (Müller-Fielitz et al., 2012a), telmisartan clearly decreased all parameters of obesity when given as a treatment. Interestingly, gain in body weight during the drug treatment period returned to levels of the Cchow group in both the preventive and the treatment trials, thus strengthening the notion that AT1 receptor blockade effectively regulates weight. Amlodipine and telmisartan + amlodipine had no effects on body weight, confirming that the anti-obesity effects of ARB are expressed independently of their ability to reduce blood pressure (Zorad et al., 2006; Müller-Fielitz et al., 2011; Miesel et al., 2012), and only by using supranormal doses (Kohya et al., 1995; Mukawa et al., 2003; Müller-Fielitz et al., 2011). We further questioned whether the balance between energy intake and expenditure was affected. The energy intake was not reduced at all by telmisartan, but rather exceeded levels of CCD rats during the last 5 weeks of treatment. Hence, the expression of (an-)orexigenic peptides in hypothalami of telmisartan-treated rats was similar to that for CCD rats. These findings support our previous observations that telmisartan-treated rats remain hyperphagic despite their loss in body weight (Müller-Fielitz et al., 2012a) and also confirm data from other groups showing that the cumulative food intake was almost unchanged (Benson et al., 2004; Schupp et al., 2005; Sugimoto et al., 2006; Zanchi et al., 2007; He et al., 2010). To assess energy expenditure, RER was non-invasively determined by indirect calorimetry, which reflects the partition of energy expenditure coverage between carbohydrate (high RER) and fat oxidation (low RER; Schutz, 1995). RER did not differ between CCD and Cchow groups Thus, we can conclude that the CCD rats became obese because energy intake and expenditure were not balanced. In agreement with the results of others (Araki et al., 2006), we found that RER was reduced during the dark and light period in telmisartan-treated rats, implying a higher fat oxidation. Thus, it appears reasonable that fat mass was lowered at the same time. Although we failed to clearly show that VO2 was increased by telmisartan, others have shown that thermogenesis was increased in normal animals treated with an ARB or in the knock-out mice, lacking the AT1 receptor (Kouyama et al., 2005; Leite et al., 2006), indicating an enhanced energy expenditure after AT1 receptor blockade. The treatment with amlodipine or telmisartan + amlodipine had no effect on RER, which is line with our findings that weight gain and BMI were affected just as little by these treatment regimens.
Leptin and adiponectin have a crucial function in regulating energy homeostasis (Kadowaki et al., 2008; Friedman, 2009). Surprisingly, plasma adiponectin levels were higher at the end of the CD feeding period. This observation somehow conflicts with others (Kadowaki et al., 2008), showing an inverse relationship between plasma adiponectin and body weight and might be associated with findings showing that adipocyte size enlarges during CD feeding (Müller-Fielitz et al., 2012a) and that large adipocytes secrete more adipokines (Skurk et al., 2007). Reduction in blood pressure and increase in plasma AngII are probably involved in decreasing adiponectin levels after telmisartan, amlodipine and telmisartan + amlodipine (see also extended discussion in Supporting Information). We clearly could assume that animals had become leptin-resistant before starting drug treatment as food intake was high despite increased leptin levels (Frederich et al., 1995). Here, we observed that plasma leptin levels were unaffected by any drug regimen. These results are in contrast to our findings showing that plasma leptin remained normalized when rats were prophylactically treated with ARBs in parallel to CD feeding and this was further attributed to an absence of adipocyte growth (Zorad et al., 2006; Müller-Fielitz et al., 2012a). We assume that, due to the long feeding period (19 weeks), adipocytes are still enlarged despite telmisartan treatment.
Next, we wanted to know whether leptin function is altered in response to drug treatment because, on the one hand, high leptin and high energy intake indicate leptin resistance, but on the other, higher energy expenditure after telmisartan suggests the opposite. We performed a LRT by applying exogenous leptin at weight-adjusted doses. Due to weight differences, AUC and Cmax of plasma leptin were slightly lower in the Cchow group and were similar in amlodipine- and telmisartan + amlodipine-treated rats when compared with CCD rats. In contrast to in vitro findings in 3T3-L1 cells and human adipocytes showing that leptin secretion is stimulated by AngII in an AT1 receptor-dependent manner (Kim et al., 2002; Skurk et al., 2005), we demonstrated clearly, here, that plasma leptin levels were increased in telmisartan-treated animals (for further discussion see Supporting Information Discussion). In LRT, energy intake and gain in body weight were higher in CCD than in Cchow rats, functionally confirming the leptin resistance, but were reduced by telmisartan compared with CCD, indicating an at least partial recovery of leptin sensitivity. A major component of the peripheral leptin resistance is likely to be impaired transport of leptin across the blood–brain barrier (BBB) via a saturable leptin transporter (Banks et al., 1999; Banks and Farrell, 2003). Serum TGs impair the ability of the BBB to transport leptin (Banks et al., 2004). In contrast, central leptin resistance specifies an impaired ability of leptin to induce a response, which might be due to reduced leptin receptors and diminished leptin signalling via both the STAT3 phosphorylation and PI3 kinase pathways (Scarpace et al., 2001; Sahu and Metlakunta, 2005). Here, we demonstrated that CD feeding increased serum TGs (Table 2) and rats became leptin-insensitive, indicating a peripheral leptin resistance and thus supporting Banks's concept (Banks et al., 2004) of peripheral leptin resistance. Plasma concentrations of TGs were only reduced by telmisartan compared with CCD, but not by amlodipine or telmisartan + amlodipine, which, again, agrees more closely with our findings that leptin sensitivity was restored after telmisartan.
It is still entirely unclear how AT1 receptor blockade functionally induces improved leptin transport across the BBB; this requires further investigation. Permeability of BBB endothelial cell monolayers was decreased in the presence of AngII in an AT1 receptor-dependent manner by influencing the rearrangement of specific multiprotein tight junction proteins to lipid rafts, a phenomenon necessary to promote BBB integrity (Wosik et al., 2007). Moreover, leptin specifically enters the CNS via leptin transporters located in the choroid plexus (Chodobski and Szmydynger-Chodobska, 2001). AngII was shown to decrease blood flow in choroidal blood vessels (Chodobski and Szmydynger-Chodobska, 2001) and AT1 receptors are located within the choroid plexus (Jöhren and Saavedra, 1996). Hence, blocking AT1 receptors may improve choroidal blood flow, thus increasing the penetration of leptin into the hypothalamus.
Improvement in insulin resistance
Obesity represents a major risk factor for the development of both leptin and insulin resistance (Konner and Brüning, 2012). Leptin has several direct effects on the pancreas and pancreatic functions. It is usually accepted that leptin inhibits insulin secretion both in vitro and in vivo (Kieffer and Habener, 2000; Konner and Brüning, 2012). However, in our study, fasting plasma insulin levels were higher in CCD than in Cchow rats, indicating insulin resistance, and this occurred together with higher leptin levels after a feeding period of 19 weeks and after the additional drug treatment period. We also demonstrated here that glucose utilization is improved by telmisartan, but not by amlodipine, and that this was mainly attributed to better insulin sensitivity. Compared with telmisartan alone, the combination of amlodipine + telmisartan did not further improve insulin sensitivity, which Sueta et al. also found, despite differences in the rat model of the metabolic syndrome, ARB and methods of determining insulin resistance (Sueta et al., 2012). In particular, telmisartan has been implicated in the induction of PPARγ activity in adipose tissue (Benson et al., 2004; Schupp et al., 2004; 2005; 2006,,; Clasen et al., 2005; Kintscher and Unger, 2005; Kintscher et al., 2008), thus resulting in improved glucose homeostasis. However, plasma adiponectin was not increased, but rather decreased after telmisartan or telmisartan + amlodipine treatment (Table 2), which does not support the PPARγ-stimulating effect in this study. In a recently published report, we also concluded that improved insulin sensitivity after long-term treatment with ARBs was not related to a PPARγ-dependent mechanism as the expression of PPARγ target genes was not affected by telmisartan (Müller-Fielitz et al., 2012a). Obviously, fasting and non-fasting insulin levels of telmisartan-treated rats particularly exceeded levels in CCD rats. This insulinotropic effect may be attributed to reduced activity of the hypothalamic-pituitary-adrenal (HPA) axis, as glucocorticoids suppressed insulin secretion in vitro and in vivo (Barseghian and Levine, 1980; Delaunay et al., ; Lambillotte et al., 1997; Davani et al., 2004). AngII itself increases HPA activity, thereby worsening glucose utilization by hampering insulin function (Müller et al., 2007; Müller-Fielitz and Raasch, 2013). Conversely, glucose utilization could be improved in rats by increasing plasma insulin after chronic AT1 receptor blockade (Raasch et al., 2006; Miesel et al., 2012). Saturated FFAs reduce insulin biosynthesis and secretion and induce beta-cell apoptosis (Nolan et al., 2006). We have shown here that telmisartan selectively reduced plasma concentration of FFA, which may contribute to the increased insulin levels. Moreover, anti-inflamatory properties of the ARB valsartan protect pancreatic islets and adipose tissue, which was thought to improve glucose utilization after AT1 receptor blockade (Cole et al., 2010).
In summary, using a rat model of the human metabolic syndrome, we have demonstrated that AT1 receptor blockade promoted weight loss even in animals with fully developed obesity when ARBs were applied as a treatment. This required high doses of the ARB and occurred independently of the reduction in blood pressure. Thus, treatment with AT1 blockers promises not only antihypertensive efficacy and improvement in glucose homeostasis, but also weight reduction in individuals with the metabolic syndrome. However, the mechanism underlying these anti-obesity effects still needs to be elucidated.
Acknowledgments
The authors would like to thank Mrs. Ines Stölting for excellent expert technical assistance. This study was supported by a grant (P04-2010) from the Medical Section of the University of Lübeck.
Glossary
- AngI
angiotensin I
- AngII
angiotensin II
- ARB
AT1 receptor blocker
- BBB
blood–brain barrier
- BMI
body mass index
- bw
body weight
- CCD
CD-fed controls
- Cchow
chow-fed controls
- CD
cafeteria diet
- Cmax
maximal concentration
- FFA
free fatty acid
- HDL
high-density lipoprotein
- HOMA
homeostasis model assessment
- HPA axis
hypothalamic-pituitary-adrenal axis
- ITT
insulin tolerance test
- LDL
low-density lipoprotein
- LRT
leptin resistance test
- OGTT
oral glucose tolerance test
- RAAS
renin–angiotensin–aldosterone system
- RER
respiratory exchange rate
- SBP
systolic BP
- SHR
spontaneously hypertensive rats
- TG
triglycerides
- VO2
oxygen consumption
Conflicts of interest
Walter Raasch received grant support from Boehringer Ingelheim Pharmaceuticals, Inc. (Ridgefield, CT, USA).
Supporting information
Additional Supporting Information may be found in the online version of this article at the publisher's web-site: http://dx.doi.org/10.1111/bph.12510
Time schedule of the test protocols.
Influence of drugs on cardiovascular parameters. A: Dose–response curves for evaluating equieffective antihypertensive doses of telmisartan (T) and amlodipine (A). Combining telmisartan and amlodipine, the dose of telmisartan was fixed at 2 mg and the appropriate dose of amlodipine was titrated. Dose–response curves were performed in three groups of rats (n = 6). Each dose of each drug was administered for 7 days, and after blood pressure was determined by plethysmography the doses were enhanced. B-D: Influence of telmisartan (8 mg·kg−1·d−1), amlodipine (12 mg·kg−1·d−1), and telmisartan + amlodipine (2 + 10 mg·kg−1·d−1) on systolic blood pressure (SBP), heart rat (HR), and left ventricular index. Chow- (Cchow) or CD-fed (CCD) rats received water. D: Correlation (Pearson r = 0.7469, P < 0.001) between the systolic blood pressure (SBP) and the left ventricular weight (LVW). Means ± SEM, n = 11–12. * P < 0.05 versus CCD, † P < 0.05 versus A, † P < 0.05 versus telmisartan + A, # P < 0.05 versus week 19.
Panel A: Influence of telmisartan (T: mg·kg−1·d−1), amlodipine (A: 12 mg·kg−1·d−1), and the combination telmisartan + amlodipine (2 + 10 mg·kg−1·d−1) on hypothalamic mRNA levels of orexigenic and anorexigenic peptides. Chow- (Cchow) or CD-fed (CCD) rats received water. Means ± SEM, n = 11–12, * P < 0.05 versus CCD. AgRP, agouti-related protein; CART, cocaine- and amphetamine-regulated transcript; CRH, corticotropin-releasing hormone; MCH, melanin concentrating hormone; NPY, neuropeptide Y; POMC, proopiomelanocortin; PPO, prepro-orexin.
Water intake was markedly reduced in rats when they were fed with CD. Water intake increased particularly after telmisartan and amlodipine treatment, almost reaching the levels of chow-fed controls: Panel A: Influence of telmisartan (T: 8 mg·kg−1·d−1), amlodipine (A:12 mg·kg−1·d−1), and the combination telmisartan + amlodipine (2 + 10 mg·kg−1·d−1) on water intake. Chow-(Cchow) or CD-fed (CCD) rats received water. The dotted line indicates the beginning of the treatment period with telmisartan, amlodipine, and telmisartan + amlodipine. Panel B: cumulative water energy intake during the feeding (filled bars) and treatment period (open bars). Panel C: Water intake during calorimetry; Panel D: Total water intake during calorimetry. Means ± SEM, n = 11–12, * P < 0.05 versus CCD, a) P < 0.05 versus CCD during the feeding period, b) P < 0.05 versus CCD during the treatment period.
Changes in energy intake in chow-fed Sprague Dawley rats after injections of leptin or saline. The injection regimen for leptin is given in the Methods. Means ± SEM, n = 10, * P < 0.05 Students t-test.
Plasma leptin levels in leptin resistance test. Leptin was injected at time point 0 and at three further times after 3, 6 and 9 hours (each time 100 μg·kg−1 s.c.) and once more after 12 hours (200 μg·kg−1 s.c.). Blood was withdrawn at each time point and leptin was determined by RIA. The area under the curve (panel B) and Cmax values (panel C) were calculated, considering the delta values. Means ± SEM, n = 9–12, * P < 0.05 versus CCD.
Correlations between plasma adiponectin and total fat mass (A), blood pressure reduction (B) and plasma AngII (C), respectively. Values of Cchow were not included in correlation analysis of (B) and (C). Means ± SEM (n = 11–12) are depicted as large symbols and single values as small symbols.
Leptin, adiponectin, glucose, insulin and lipids in plasma of rats immediately before drug treatment. Controls received only chow (Cchow); all other rats could freely choose between cafeteria diet (CD) and chow. Blood samples were withdrawn at day 122a) or day 123b) after fasting. Means ± SEM ( n = 12), * P < 0.05 versus CCD.
References
- Alexander SPH, et al. The Concise Guide to PHARMACOLOGY 2013/14: Overview. Br J Pharmacol. 2013;170:1449–1867. doi: 10.1111/bph.12444. [DOI] [PMC free article] [PubMed] [Google Scholar]
- Araki K, Masaki T, Katsuragi I, Tanaka K, Kakuma T, Yoshimatsu H. Telmisartan prevents obesity and increases the expression of uncoupling protein 1 in diet-induced obese mice. Hypertension. 2006;48:51–57. doi: 10.1161/01.HYP.0000225402.69580.1d. [DOI] [PubMed] [Google Scholar]
- Banks WA, Farrell CL. Impaired transport of leptin across the blood–brain barrier in obesity is acquired and reversible. Am J Physiol Endocrinol Metab. 2003;285:E10–E15. doi: 10.1152/ajpendo.00468.2002. [DOI] [PubMed] [Google Scholar]
- Banks WA, DiPalma CR, Farrell CL. Impaired transport of leptin across the blood–brain barrier in obesity. Peptides. 1999;20:1341–1345. doi: 10.1016/s0196-9781(99)00139-4. [DOI] [PubMed] [Google Scholar]
- Banks WA, Coon AB, Robinson SM, Moinuddin A, Shultz JM, Nakaoke R, et al. Triglycerides induce leptin resistance at the blood–brain barrier. Diabetes. 2004;53:1253–1260. doi: 10.2337/diabetes.53.5.1253. [DOI] [PubMed] [Google Scholar]
- Barseghian G, Levine R. Effect of corticosterone on insulin and glucagon secretion by the isolated perfused rat pancreas. Endocrinology. 1980;106:547–552. doi: 10.1210/endo-106-2-547. [DOI] [PubMed] [Google Scholar]
- Benson SC, Pershadsingh HA, Ho CI, Chittiboyina A, Desai P, Pravenec M, et al. Identification of telmisartan as a unique angiotensin II receptor antagonist with selective PPARgamma-modulating activity. Hypertension. 2004;43:993–1002. doi: 10.1161/01.HYP.0000123072.34629.57. [DOI] [PubMed] [Google Scholar]
- Boustany CM, Bharadwaj K, Daugherty A, Brown DR, Randall DC, Cassis LA. Activation of the systemic and adipose renin-angiotensin system in rats with diet-induced obesity and hypertension. Am J Physiol Regul Integr Comp Physiol. 2004;287:R943–R949. doi: 10.1152/ajpregu.00265.2004. [DOI] [PubMed] [Google Scholar]
- Brink M, Wellen J, Delafontaine P. Angiotensin II causes weight loss and decreases circulating insulin-like growth factor I in rats through a pressor-independent mechanism. J Clin Invest. 1996;97:2509–2516. doi: 10.1172/JCI118698. [DOI] [PMC free article] [PubMed] [Google Scholar]
- Cabassi A, Coghi P, Govoni P, Barouhiel E, Speroni E, Cavazzini S, et al. Sympathetic modulation by carvedilol and losartan reduces angiotensin II-mediated lipolysis in subcutaneous and visceral fat. J Clin Endocrinol Metab. 2005;90:2888–2897. doi: 10.1210/jc.2004-1995. [DOI] [PubMed] [Google Scholar]
- Cassis LA, English VL, Bharadwaj K, Boustany CM. Differential effects of local versus systemic angiotensin II in the regulation of leptin release from adipocytes. Endocrinology. 2004;145:169–174. doi: 10.1210/en.2003-0767. [DOI] [PubMed] [Google Scholar]
- Chodobski A, Szmydynger-Chodobska J. Choroid plexus: target for polypeptides and site of their synthesis. Microsc Res Tech. 2001;52:65–82. doi: 10.1002/1097-0029(20010101)52:1<65::AID-JEMT9>3.0.CO;2-4. [DOI] [PubMed] [Google Scholar]
- Clasen R, Schupp M, Foryst-Ludwig A, Sprang C, Clemenz M, Krikov M, et al. PPARgamma-activating angiotensin type-1 receptor blockers induce adiponectin. Hypertension. 2005;46:137–143. doi: 10.1161/01.HYP.0000168046.19884.6a. [DOI] [PubMed] [Google Scholar]
- Cole BK, Keller SR, Wu R, Carter JD, Nadler JL, Nunemaker CS. Valsartan protects pancreatic islets and adipose tissue from the inflammatory and metabolic consequences of a high-fat diet in mice. Hypertension. 2010;55:715–721. doi: 10.1161/HYPERTENSIONAHA.109.148049. [DOI] [PMC free article] [PubMed] [Google Scholar]
- Davani B, Portwood N, Bryzgalova G, Reimer MK, Heiden T, Ostenson CG, et al. Aged transgenic mice with increased glucocorticoid sensitivity in pancreatic beta-cells develop diabetes. Diabetes. 2004;53(Suppl. 1):S51–S59. doi: 10.2337/diabetes.53.2007.s51. [DOI] [PubMed] [Google Scholar]
- Delaunay F, Khan A, Cintra A, Davani B, Ling ZC, Andersson A, et al. Pancreatic beta cells are important targets for the diabetogenic effects of glucocorticoids. J Clin Invest. 100:2094–2098. doi: 10.1172/JCI119743. (1997) [DOI] [PMC free article] [PubMed] [Google Scholar]
- Engeli S, Gorzelniak K, Kreutz R, Runkel N, Distler A, Sharma AM. Co-expression of renin-angiotensin system genes in human adipose tissue. J Hypertens. 1999;17:555–560. doi: 10.1097/00004872-199917040-00014. [DOI] [PubMed] [Google Scholar]
- Engeli S, Bohnke J, Gorzelniak K, Janke J, Schling P, Bader M, et al. Weight loss and the renin-angiotensin-aldosterone system. Hypertension. 2005;45:356–362. doi: 10.1161/01.HYP.0000154361.47683.d3. [DOI] [PubMed] [Google Scholar]
- Frederich RC, Hamann A, Anderson S, Lollmann B, Lowell BB, Flier JS. Leptin levels reflect body lipid content in mice: evidence for diet-induced resistance to leptin action. Nat Med. 1995;1:1311–1314. doi: 10.1038/nm1295-1311. [DOI] [PubMed] [Google Scholar]
- Friedman JM. Leptin at 14 y of age: an ongoing story. Am J Clin Nutr. 2009;89:973S–979S. doi: 10.3945/ajcn.2008.26788B. [DOI] [PMC free article] [PubMed] [Google Scholar]
- Gembardt F, Heringer-Walther S, van Esch JH, Sterner-Kock A, van Veghel R, Le TH, et al. Cardiovascular phenotype of mice lacking all three subtypes of angiotensin II receptors. FASEB J. 2008;22:3068–3077. doi: 10.1096/fj.08-108316. [DOI] [PubMed] [Google Scholar]
- Giacchetti G, Faloia E, Mariniello B, Sardu C, Gatti C, Camilloni MA, et al. Overexpression of the renin-angiotensin system in human visceral adipose tissue in normal and overweight subjects. Am J Hypertens. 2002;15:381–388. doi: 10.1016/s0895-7061(02)02257-4. [DOI] [PubMed] [Google Scholar]
- Harte A, McTernan P, Chetty R, Coppack S, Katz J, Smith S, et al. Insulin-mediated upregulation of the renin angiotensin system in human subcutaneous adipocytes is reduced by rosiglitazone. Circulation. 2005;111:1954–1961. doi: 10.1161/01.CIR.0000161954.17870.5D. [DOI] [PubMed] [Google Scholar]
- He H, Yang D, Ma L, Luo Z, Ma S, Feng X, et al. Telmisartan prevents weight gain and obesity through activation of peroxisome proliferator-activated receptor-delta-dependent pathways. Hypertension. 2010;55:869–879. doi: 10.1161/HYPERTENSIONAHA.109.143958. [DOI] [PubMed] [Google Scholar]
- Jöhren O, Saavedra JM. Expression of AT1A and AT1B angiotensin II receptor messenger RNA in forebrain of 2-wk-old rats. Am J Physiol. 1996;271:E104–E112. doi: 10.1152/ajpendo.1996.271.1.E104. [DOI] [PubMed] [Google Scholar]
- Kadowaki T, Yamauchi T, Kubota N. The physiological and pathophysiological role of adiponectin and adiponectin receptors in the peripheral tissues and CNS. FEBS Lett. 2008;582:74–80. doi: 10.1016/j.febslet.2007.11.070. [DOI] [PubMed] [Google Scholar]
- Karlsson C, Lindell K, Ottosson M, Sjostrom L, Carlsson B, Carlsson LM. Human adipose tissue expresses angiotensinogen and enzymes required for its conversion to angiotensin II. J Clin Endocrinol Metab. 1998;83:3925–3929. doi: 10.1210/jcem.83.11.5276. [DOI] [PubMed] [Google Scholar]
- Kieffer TJ, Habener JF. The adipoinsular axis: effects of leptin on pancreatic beta-cells. Am J Physiol Endocrinol Metab. 2000;278:E1–E14. doi: 10.1152/ajpendo.2000.278.1.E1. [DOI] [PubMed] [Google Scholar]
- Kilkenny C, Browne W, Cuthill IC, Emerson M, Altman DG. Animal research: reporting in vivo experiments: the ARRIVE guidelines. Br J Pharmacol. 2010;160:1577–1579. doi: 10.1111/j.1476-5381.2010.00872.x. [DOI] [PMC free article] [PubMed] [Google Scholar]
- Kim S, Whelan J, Claycombe K, Reath DB, Moustaid-Moussa N. Angiotensin II increases leptin secretion by 3T3-L1 and human adipocytes via a prostaglandin-independent mechanism. J Nutr. 2002;132:1135–1140. doi: 10.1093/jn/132.6.1135. [DOI] [PubMed] [Google Scholar]
- Kintscher U, Unger T. Vascular protection in diabetes: a pharmacological view of angiotensin II type 1 receptor blockers. Acta Diabetol. 2005;42(Suppl. 1):S26–S32. doi: 10.1007/s00592-005-0178-y. [DOI] [PubMed] [Google Scholar]
- Kintscher U, Foryst-Ludwig A, Unger T. Inhibiting angiotensin type 1 receptors as a target for diabetes. Expert Opin Ther Targets. 2008;12:1257–1263. doi: 10.1517/14728222.12.10.1257. [DOI] [PubMed] [Google Scholar]
- Kohya T, Yokoshiki H, Tohse N, Kanno M, Nakaya H, Saito H, et al. Regression of left ventricular hypertrophy prevents ischemia-induced lethal arrhythmias. Beneficial effect of angiotensin II blockade. Circ Res. 1995;76:892–899. doi: 10.1161/01.res.76.5.892. [DOI] [PubMed] [Google Scholar]
- Konner AC, Brüning JC. Selective insulin and leptin resistance in metabolic disorders. Cell Metab. 2012;16:144–152. doi: 10.1016/j.cmet.2012.07.004. [DOI] [PubMed] [Google Scholar]
- Kouyama R, Suganami T, Nishida J, Tanaka M, Toyoda T, Kiso M, et al. Attenuation of diet-induced weight gain and adiposity through increased energy expenditure in mice lacking angiotensin II type 1a receptor. Endocrinology. 2005;146:3481–3489. doi: 10.1210/en.2005-0003. [DOI] [PubMed] [Google Scholar]
- Lambillotte C, Gilon P, Henquin JC. Direct glucocorticoid inhibition of insulin secretion. An in vitro study of dexamethasone effects in mouse islets. J Clin Invest. 1997;99:414–423. doi: 10.1172/JCI119175. [DOI] [PMC free article] [PubMed] [Google Scholar]
- Leite LH, Lacerda AC, Marubayashi U, Coimbra CC. Central angiotensin AT1-receptor blockade affects thermoregulation and running performance in rats. Am J Physiol Regul Integr Comp Physiol. 2006;291:R603–R607. doi: 10.1152/ajpregu.00038.2006. [DOI] [PubMed] [Google Scholar]
- McGrath JC, Drummond GB, McLachlan EM, Kilkenny C, Wainwright CL. Guidelines for reporting experiments involving animals: the ARRIVE guidelines. Br J Pharmacol. 2010;160:1573–1576. doi: 10.1111/j.1476-5381.2010.00873.x. [DOI] [PMC free article] [PubMed] [Google Scholar]
- Miesel A, Müller H, Thermann M, Heidbreder M, Dominiak P, Raasch W. Overfeeding-induced obesity in spontaneously hypertensive rats: an animal model of the human metabolic syndrome. Ann Nutr Metab. 2010;56:127–142. doi: 10.1159/000278748. [DOI] [PubMed] [Google Scholar]
- Miesel A, Müller-Fielitz H, Jöhren O, Vogt FM, Raasch W. Double blockade of angiotensin II (AT(1))-receptors and ACE does not improve weight gain and glucose homeostasis better than single-drug treatments in obese rats. Br J Pharmacol. 2012;165:2721–2735. doi: 10.1111/j.1476-5381.2011.01726.x. [DOI] [PMC free article] [PubMed] [Google Scholar]
- Mukawa H, Toki Y, Miyazaki Y, Matsui H, Okumura K, Ito T. Angiotensin II type 2 receptor blockade partially negates antihypertrophic effects of type 1 receptor blockade on pressure-overload rat cardiac hypertrophy. Hypertens Res. 2003;26:89–95. doi: 10.1291/hypres.26.89. [DOI] [PubMed] [Google Scholar]
- Müller H, Schweitzer N, Jöhren O, Dominiak P, Raasch W. Angiotensin II stimulates the reactivity of the pituitary-adrenal axis in leptin-resistant Zucker rats, thereby influencing the glucose utilization. Am J Physiol Endocrinol Metab. 2007;293:E802–E810. doi: 10.1152/ajpendo.00650.2006. [DOI] [PubMed] [Google Scholar]
- Müller-Fielitz H, Raasch W. Angiotensin II impairs glucose utilization in obese Zucker rats by increasing HPA activity via an adrenal-dependent mechanism. Horm Metab Res. 2013;45:173–180. doi: 10.1055/s-0032-1327679. [DOI] [PubMed] [Google Scholar]
- Müller-Fielitz H, Markert A, Wittmershaus C, Pahlke F, Jöhren O, Raasch W. Weight loss and hypophagia after high-dose AT1-blockade is only observed after high dosing and depends on regular leptin signalling but not blood pressure. Naunyn Schmiedebergs Arch Pharmacol. 2011;383:373–384. doi: 10.1007/s00210-011-0602-5. [DOI] [PubMed] [Google Scholar]
- Müller-Fielitz H, Landolt J, Heidbreder M, Werth S, Vogt FM, Jöhren O, et al. Improved insulin sensitivity after long-term treatment with AT1 blockers is not associated with PPARgamma target gene regulation. Endocrinology. 2012a;153:1103–1115. doi: 10.1210/en.2011-0183. [DOI] [PubMed] [Google Scholar]
- Müller-Fielitz H, Lau M, Jöhren O, Stellmacher F, Schwaninger M, Raasch W. Blood pressure response to angiotensin ii is enhanced in obese zucker rats and is attributed to an aldosterone-dependent mechanism. Br J Pharmacol. 2012b;166:2417–2429. doi: 10.1111/j.1476-5381.2012.01953.x. [DOI] [PMC free article] [PubMed] [Google Scholar]
- Nolan CJ, Madiraju MS, Delghingaro-Augusto V, Peyot ML, Prentki M. Fatty acid signaling in the beta-cell and insulin secretion. Diabetes. 2006;55(Suppl. 2):S16–S23. doi: 10.2337/db06-s003. [DOI] [PubMed] [Google Scholar]
- Raasch W, Bartels T, Schwartz C, Häuser W, Rütten H, Dominiak P. Regression of ventricular and vascular hypertrophy: are there differences between structurally different angiotensin-converting enzyme inhibitors? J Hypertens. 2002;20:2495–2504. doi: 10.1097/01.hjh.0000042885.24999.e9. [DOI] [PubMed] [Google Scholar]
- Raasch W, Wittmershaus C, Dendorfer A, Voges I, Pahlke F, Dodt C, et al. Angiotensin II inhibition reduces stress sensitivity of hypothalamo-pituitary-adrenal axis in spontaneously hypertensive rats. Endocrinology. 2006;147:3539–3546. doi: 10.1210/en.2006-0198. [DOI] [PubMed] [Google Scholar]
- Rong X, Li Y, Ebihara K, Zhao M, Naowaboot J, Kusakabe T, et al. Angiotensin II type 1 receptor-independent beneficial effects of telmisartan on dietary-induced obesity, insulin resistance and fatty liver in mice. Diabetologia. 2010;53:1727–1731. doi: 10.1007/s00125-010-1744-6. [DOI] [PubMed] [Google Scholar]
- Sahu A, Metlakunta AS. Hypothalamic phosphatidylinositol 3-kinase-phosphodiesterase 3B-cyclic AMP pathway of leptin signalling is impaired following chronic central leptin infusion. J Neuroendocrinol. 2005;17:720–726. doi: 10.1111/j.1365-2826.2005.01362.x. [DOI] [PubMed] [Google Scholar]
- Scarpace PJ, Matheny M, Tumer N. Hypothalamic leptin resistance is associated with impaired leptin signal transduction in aged obese rats. Neuroscience. 2001;104:1111–1117. doi: 10.1016/s0306-4522(01)00142-7. [DOI] [PubMed] [Google Scholar]
- Scheen AJ. Renin-angiotensin system inhibition prevents type 2 diabetes mellitus. Part 1. A meta-analysis of randomised clinical trials. Diabetes Metab. 2004a;30:487–496. doi: 10.1016/s1262-3636(07)70146-5. [DOI] [PubMed] [Google Scholar]
- Scheen AJ. Renin-angiotensin system inhibition prevents type 2 diabetes mellitus. Part 2. Overview of physiological and biochemical mechanisms. Diabetes Metab. 2004b;30:498–505. doi: 10.1016/s1262-3636(07)70147-7. [DOI] [PubMed] [Google Scholar]
- Schupp M, Janke J, Clasen R, Unger T, Kintscher U. Angiotensin type 1 receptor blockers induce peroxisome proliferator-activated receptor-gamma activity. Circulation. 2004;109:2054–2057. doi: 10.1161/01.CIR.0000127955.36250.65. [DOI] [PubMed] [Google Scholar]
- Schupp M, Clemenz M, Gineste R, Witt H, Janke J, Helleboid S, et al. Molecular characterization of new selective peroxisome proliferator-activated receptor gamma modulators with angiotensin receptor blocking activity. Diabetes. 2005;54:3442–3452. doi: 10.2337/diabetes.54.12.3442. [DOI] [PubMed] [Google Scholar]
- Schupp M, Lee LD, Frost N, Umbreen S, Schmidt B, Unger T, et al. Regulation of peroxisome proliferator-activated receptor gamma activity by losartan metabolites. Hypertension. 2006;47:586–589. doi: 10.1161/01.HYP.0000196946.79674.8b. [DOI] [PubMed] [Google Scholar]
- Schutz Y. Abnormalities of fuel utilization as predisposing to the development of obesity in humans. Obes Res. 1995;3(Suppl. 2):173S–178S. doi: 10.1002/j.1550-8528.1995.tb00460.x. [DOI] [PubMed] [Google Scholar]
- Skurk T, van Hamelen V, Blum WF, Hauner H. Angiotensin II promotes leptin production in cultured human fat cells by an ERK1/2-dependent pathway. Obes Res. 2005;13:969–973. doi: 10.1038/oby.2005.113. [DOI] [PubMed] [Google Scholar]
- Skurk T, Alberti-Huber C, Herder C, Hauner H. Relationship between adipocyte size and adipokine expression and secretion. J Clin Endocrinol Metab. 2007;92:1023–1033. doi: 10.1210/jc.2006-1055. [DOI] [PubMed] [Google Scholar]
- Sueta D, Nakamura T, Dong YF, Kataoka K, Koibuchi N, Yamamoto E, et al. Amlodipine enhances amelioration of vascular insulin resistance, oxidative stress, and metabolic disorders by candesartan in metabolic syndrome rats. Am J Hypertens. 2012;25:704–710. doi: 10.1038/ajh.2012.26. [DOI] [PubMed] [Google Scholar]
- Sugimoto K, Qi NR, Kazdova L, Pravenec M, Ogihara T, Kurtz TW. Telmisartan but not valsartan increases caloric expenditure and protects against weight gain and hepatic steatosis. Hypertension. 2006;47:1003–1009. doi: 10.1161/01.HYP.0000215181.60228.f7. [DOI] [PubMed] [Google Scholar]
- Wosik K, Cayrol R, Dodelet-Devillers A, Berthelet F, Bernard M, Moumdjian R, et al. Angiotensin II controls occludin function and is required for blood brain barrier maintenance: relevance to multiple sclerosis. J Neurosci. 2007;27:9032–9042. doi: 10.1523/JNEUROSCI.2088-07.2007. [DOI] [PMC free article] [PubMed] [Google Scholar]
- Zanchi A, Dulloo AG, Perregaux C, Montani JP, Burnier M. Telmisartan prevents the glitazone-induced weight gain without interfering with its insulin-sensitizing properties. Am J Physiol Endocrinol Metab. 2007;293:E91–E95. doi: 10.1152/ajpendo.00024.2007. [DOI] [PubMed] [Google Scholar]
- Zorad S, Dou JT, Benicky J, Hutanu D, Tybitanclova K, Zhou J, et al. Long-term angiotensin II AT1 receptor inhibition produces adipose tissue hypotrophy accompanied by increased expression of adiponectin and PPARgamma. Eur J Pharmacol. 2006;552:112–122. doi: 10.1016/j.ejphar.2006.08.062. [DOI] [PMC free article] [PubMed] [Google Scholar]
Associated Data
This section collects any data citations, data availability statements, or supplementary materials included in this article.
Supplementary Materials
Time schedule of the test protocols.
Influence of drugs on cardiovascular parameters. A: Dose–response curves for evaluating equieffective antihypertensive doses of telmisartan (T) and amlodipine (A). Combining telmisartan and amlodipine, the dose of telmisartan was fixed at 2 mg and the appropriate dose of amlodipine was titrated. Dose–response curves were performed in three groups of rats (n = 6). Each dose of each drug was administered for 7 days, and after blood pressure was determined by plethysmography the doses were enhanced. B-D: Influence of telmisartan (8 mg·kg−1·d−1), amlodipine (12 mg·kg−1·d−1), and telmisartan + amlodipine (2 + 10 mg·kg−1·d−1) on systolic blood pressure (SBP), heart rat (HR), and left ventricular index. Chow- (Cchow) or CD-fed (CCD) rats received water. D: Correlation (Pearson r = 0.7469, P < 0.001) between the systolic blood pressure (SBP) and the left ventricular weight (LVW). Means ± SEM, n = 11–12. * P < 0.05 versus CCD, † P < 0.05 versus A, † P < 0.05 versus telmisartan + A, # P < 0.05 versus week 19.
Panel A: Influence of telmisartan (T: mg·kg−1·d−1), amlodipine (A: 12 mg·kg−1·d−1), and the combination telmisartan + amlodipine (2 + 10 mg·kg−1·d−1) on hypothalamic mRNA levels of orexigenic and anorexigenic peptides. Chow- (Cchow) or CD-fed (CCD) rats received water. Means ± SEM, n = 11–12, * P < 0.05 versus CCD. AgRP, agouti-related protein; CART, cocaine- and amphetamine-regulated transcript; CRH, corticotropin-releasing hormone; MCH, melanin concentrating hormone; NPY, neuropeptide Y; POMC, proopiomelanocortin; PPO, prepro-orexin.
Water intake was markedly reduced in rats when they were fed with CD. Water intake increased particularly after telmisartan and amlodipine treatment, almost reaching the levels of chow-fed controls: Panel A: Influence of telmisartan (T: 8 mg·kg−1·d−1), amlodipine (A:12 mg·kg−1·d−1), and the combination telmisartan + amlodipine (2 + 10 mg·kg−1·d−1) on water intake. Chow-(Cchow) or CD-fed (CCD) rats received water. The dotted line indicates the beginning of the treatment period with telmisartan, amlodipine, and telmisartan + amlodipine. Panel B: cumulative water energy intake during the feeding (filled bars) and treatment period (open bars). Panel C: Water intake during calorimetry; Panel D: Total water intake during calorimetry. Means ± SEM, n = 11–12, * P < 0.05 versus CCD, a) P < 0.05 versus CCD during the feeding period, b) P < 0.05 versus CCD during the treatment period.
Changes in energy intake in chow-fed Sprague Dawley rats after injections of leptin or saline. The injection regimen for leptin is given in the Methods. Means ± SEM, n = 10, * P < 0.05 Students t-test.
Plasma leptin levels in leptin resistance test. Leptin was injected at time point 0 and at three further times after 3, 6 and 9 hours (each time 100 μg·kg−1 s.c.) and once more after 12 hours (200 μg·kg−1 s.c.). Blood was withdrawn at each time point and leptin was determined by RIA. The area under the curve (panel B) and Cmax values (panel C) were calculated, considering the delta values. Means ± SEM, n = 9–12, * P < 0.05 versus CCD.
Correlations between plasma adiponectin and total fat mass (A), blood pressure reduction (B) and plasma AngII (C), respectively. Values of Cchow were not included in correlation analysis of (B) and (C). Means ± SEM (n = 11–12) are depicted as large symbols and single values as small symbols.
Leptin, adiponectin, glucose, insulin and lipids in plasma of rats immediately before drug treatment. Controls received only chow (Cchow); all other rats could freely choose between cafeteria diet (CD) and chow. Blood samples were withdrawn at day 122a) or day 123b) after fasting. Means ± SEM ( n = 12), * P < 0.05 versus CCD.