

ABSTRACT
Objective:
The aim of this study was to investigate the effect of growing-up milk (GUM) with added short-chain galacto-oligosaccharides (scGOS)/long-chain fructo-oligosaccharides (lcFOS) (9:1) (Immunofortis) and n-3 long-chain polyunsaturated fatty acids (LCPUFAs) on the occurrence of infections in healthy children attending day care centres.
Methods:
In a randomised double-blind controlled, parallel, multicountry intervention study, 767 healthy children, ages 11 to 29 months, received GUM with scGOS/lcFOS/LCPUFAs (the active group, n = 388), GUM without scGOS/lcFOS/LCPUFAs (the control group, n = 379), or cow's milk (n = 37) for 52 weeks. The primary outcome measure was the number of episodes of upper respiratory tract infections or gastrointestinal infections based on a combination of subject's illness symptoms reported by the parents during the intervention period.
Results:
Children in the active group compared with the control group had a decreased risk of developing at least 1 infection (299/388 [77%] vs 313/379 [83%], respectively, relative risk 0.93, 95% confidence interval [CI] 0.87–1.00; logistic regression P = 0.03). There was a trend toward a reduction (P = 0.07) in the total number of infections in the active group, which was significant when confirmed by one of the investigators (268/388 [69%] vs 293/379 [77%], respectively, relative risk 0.89, 95% CI 0.82–0.97; P = 0.004, post hoc). More infectious episodes were observed in the cow's milk group, when compared with both GUM groups (34/37 [92%] vs 612/767 [80%], respectively, relative risk 1.15, 95% CI 1.04–1.28).
Conclusions:
This is the first study in children to show a reduced risk of infection following consumption of GUM supplemented with scGOS/lcFOS/n-3 LCPUFAs. The borderline statistical significance justifies a new study to confirm this finding.
Keywords: growing-up milk, infection, n-3 LCPUFAs, scGOS/lcFOS, young children
In many developed countries, many parents send their infants and young children to day care centres. It is well documented that day care attendance increases the risk of infections and that the risk of infections increases with the number of children in a group (1–3). Both respiratory and gastrointestinal infections (GIIs) are a major cause of disease in children attending day care centres (4). At least 89% of illness-related absence from a day care centre is the result of infectious diseases, of which 60% to 70% is because of respiratory infections. A study by Ponka et al (5) reported that the most common diagnoses were upper respiratory tract infections (URTIs) (46%), diarrhoea (17%), otitis media (12.9%), eye infection (4%), acute tonsillitis (3.2%), and bronchitis (3%). The first 3 years of life are important for the development of various organs, and essential for the development of the immune system. A specific mixture of short-chain galacto-oligosaccharides and long-chain fructo-oligosaccharides (scGOS/lcFOS; Immunofortis; Danone Research, Wageningen, the Netherlands) in a ratio of 9:1 has been shown to support immune development by significantly influencing the intestinal microbiota (6,7). Prebiotics are nondigestible food ingredients that beneficially affect the host by selectively stimulating the growth and/or activity of one or a limited number of bacteria in the colon that can improve host health (8). This mixture of scGOS/lcFOS mimics the molecular size distribution of human milk oligosaccharides and has been shown to positively affect the development of the immune system of infants; it has been demonstrated that the incidence and severity of URTIs were lower in healthy infants who received an infant formula with this mixture (9), and in another study, it was shown that the number of infectious episodes during the first 6 months of life was lower in infants receiving this mixture (10). The scGOS/lcFOS mixture has therefore been shown to be beneficial in infants; however, whether similar benefit can also be shown in young children needs further investigation.
Another factor that may affect the immunological defence of healthy young children, and which is receiving increasing attention, is the long-chain polyunsaturated fatty acids (LCPUFAs) status. LCPUFAs are functionally the most important fatty acids for immune cells (11–15). The most important n-3 LCPUFAs are docosahexaenoic acid (DHA) and eicosapentaenoic acid (EPA). The most important n-6 LCPUFA is arachidonic acid (AA). Most regular Western diets have an imbalanced intake of n-6:n-3 LCPUFAs. This imbalance is associated with inflammatory/immune responses. A more balanced LCPUFAs profile in immune cells may result in a more balanced and optimal immune regulation, maturation, and response following a stimulus (16). Such a better-balanced LCPUFAs profile may be achieved by increasing dietary intake of n-3 LCPUFAs. This is particularly important in a period of rapid growth, such as during infancy or young childhood. Increasing intake of n-3 LCPUFAs will balance LCPUFAs ratios and may support an appropriate immune system response.
Given the different mechanisms by which scGOS/lcFOS and LCPUFAs appear to exert their beneficial effect on the immune system, we hypothesised that a combination of scGOS/lcFOS and n-3 LCPUFAs may, in a complementary manner, be effective in reducing the risk of infections in young children. This study assessed the effect of a growing-up milk (GUM) with added scGOS/lcFOS/n-3 LCPUFAs on the occurrence of infections in young children attending day care centres in 5 countries in Europe and Asia. The potential effect of cow's milk in comparison with GUM in a small nonrandomised reference group was also assessed.
METHODS
Participants
The study was a randomised double-blind controlled clinical study carried out in private practices, children's hospitals, university hospitals, or site management organisations (organisations that provide clinical trial–related services) located in 5 countries in Europe and Asia: Malaysia, the Netherlands, Poland, Portugal, and Thailand.
Healthy young children ages 11 to 29 months attending a day care centre at least 2 times per week were recruited into the study between September 2008 and May 2009 after informed written consent was obtained from the parents or legal guardians. Day care centres were defined as any private or governmental facility providing care or playgroups for at least 20 children. Exclusion criteria included atopic dermatitis according to the Hannifin criteria; disorders requiring a special diet; any relevant congenital abnormality, chromosomal disorder, or severe disease; preexisting pathology of severe respiratory or GI diseases; use of antiregurgitation, antireflux, or laxative medication at the time of inclusion; and use of immune modulators or of prescribed prophylactic antibiotics at the time of inclusion.
The study was conducted following the principles of the Declaration of Helsinki and Good Clinical Practice guidelines. The protocol was approved by the ethics committees of the different institutes in the countries.
Study Design/Intervention
Study products were either the active study product, GUM with the addition of 1.2 g/100 mL of scGOS/ lcFOS (9:1) (Immunofortis) and 19.2 mg/100 mL of n-3 LCPUFAs (EPA + DHA, 4:6), the control study product, GUM without scGOS/lcFOS/n-3 LCPUFAs (Danone Research). GUM is specially formulated milk for young children ages 1 to 3 years, enriched with key nutrients such as vitamins A, C, and D, iron, and calcium. Both study products were packed in identical tins; they were of the same colour, weight, smell, and taste. Both the research staff and parents and subjects were unaware of the real nature of the product. The unblinding procedure was performed after the study was completed and after the statistical analyses were finalised.
The study consisted of a 4-week run-in period and a 52-week intervention period. Subjects eligible for participation started with the run-in period, in which control product was consumed. The run-in period was needed to get the children used to the product and the parents used to the completion of the diaries. Subjects who had successfully completed the run-in period were randomly allocated to receive either the active study product or the control study product in a double-blind period of 52 weeks. To ensure a gradual transition during the first 2 weeks of this period, the run-in product was mixed with the active/control study product following a schedule provided by the centres. The requested intake of the study product was 400 to 750 mL daily for both the run-in period and the 52-week intervention period. This wide range was chosen because the different countries involved in the study had a wide variety of dosage recommendations. Every 2 to 4 weeks, there was a contact session with the parents, either by visit or by telephone, in which study diaries were discussed. A final contact session took place 2 weeks after intervention, at 54 weeks.
In addition, there was a reference group of subjects receiving cow's milk already before the start of the study and which followed the same procedures as the intervention groups; however, this group was not randomised and consumed regular cow's milk for 52 weeks. Subjects from the reference group were only recruited in the Netherlands.
Data Collection
Background information was collected on the family, their environment, the child's nutritional habits, and illnesses. During the study, parents daily recorded the intake of study product as well as, in a symptom diary, any respiratory symptoms (cough, fever, blocked or runny nose, sore throat, wheeze, and/or ear discharge) and GI symptoms (vomiting or diarrhoea). They also reported absence from the day care centre, absence of parents from work, contacts with a physician, doctor's diagnoses, and prescription of medication. If parents suspected that their child had fever, body temperature of the subject was measured and recorded, with thermometers provided to all of the children.
Furthermore, parents completed 3 times a 3-day diary, with questions about GI symptoms and stool characteristics, at the start of the intervention period, at 26 weeks, and at 52 weeks. The diary covered stool frequency and stool consistency and severity of GI tract characteristics (diarrhoea, constipation, and flatulence) with a 4-point scale (none, mild, moderate, severe).
Sample Size and Randomisation
Sample size was estimated based on the incidence of respiratory tract infections. Based on a previous study on the incidence of respiratory tract infections (17,18), the study was designed to have sufficient power (80%) to detect a 20% difference between the groups with a 0.05 significance level based on a 2-tailed test. The number of children necessary in each group was 300 subjects, including an estimated dropout rate of 25%.
Each child, except for the children in the reference group, was randomly allocated to either the active study product or the control study product. The randomised subjects were distributed to the 2 study groups based on a randomisation code, developed using a computer random number generator. A block size of 6 was used, and stratification was applied for investigator site.
Outcome Measures
The primary outcome was the number of episodes of URTI or GIIs based on a combination of subject's illness symptoms reported by the parents during the intervention period. URTI was defined as any combination of at least 2 of the following symptoms: cough, fever, blocked or runny nose, sore throat, wheeze, and/or ear discharge. GII was defined as the occurrence of vomiting or diarrhoea or both for at least 1 day, with or without fever. See Table 1 for the definition of symptoms.
TABLE 1.
Definition of symptoms
| Symptom | Definition |
| Cough | Sudden expulsion of air from the lungs with a noise that clears the air passages |
| Blocked or runny nose | Nasal discharge of any mucus-like material coming out of the nose (rhinorrhea) |
| Sore throat | Discomfort, pain, or scratchiness in the throat |
| Wheeze | Breathing with an abnormal (eg, husky, whistling) sound mostly caused by difficult respiration from narrowed airway passages |
| Ear discharge | Drainage of blood, ear wax, pus, or fluid from the ear |
| Fever | A rectal temperature of at least 38°C for at least 2 measurements with an interval of at least 2 hours |
| Diarrhoea | ≥3 loose or liquid stools per day |
| Vomiting | Forcing the contents of the stomach up through the oesophagus and out of the mouth |
An episode of URTI and/or GII was defined as having ≥1 symptoms for at least 1 day. A child was considered as recovered from an episode when the subject showed no symptoms of the reported infection and had a normal level of activity. A new episode was considered to have occurred if the symptom(s) occurred at least 3 days after the stated time of recovery from a previous episode.
The symptoms that were reported by the parents were always checked by the investigator. He or she could indicate whether he or she found the symptoms to be an infection.
Secondary outcomes were total number and duration of episodes of URTI and/or GII; parents’ absence from work because of illness of the child; number, duration, and season of subjects’ absence from day care centre; and number and type of all infections diagnosed by a physician or investigator.
Statistical Analysis
Descriptive statistics were used to describe the basic features according to the age, sex, food intake, and family characteristics. Results on the primary parameter were obtained from both a logistic regression model and a zero-inflated negative binomial regression model. The latter model combines 2 separate parts: a (binomial) part, whether or not a subject would get an infection; and a (negative-binomial) part fitting the counts for infections for the subjects. All analyses were based on the all-subjects randomised group: all of the subjects who had been randomised and to whose parents the study product had been dispensed. For safety analysis, such as growth, height, and tolerance, the safety analysis population was used consisting of all children except the screen failure subjects for the intervention period. In an analysis of the normally distributed continuous data, a t test was performed, whereas a Wilcoxon rank-sum test was used in analysis of non-normality continuous data. In addition, a χ2 test (Fisher exact test in the case of <5 expected cell counts) was performed in analysis of nominal data. Furthermore, Kaplan-Meier (KM) curves together with corresponding log-rank tests were conducted in analysis of time to event type of data. All statistical analyses were performed with SAS (SAS Enterprise Guide 4.1 or higher) for Windows (SAS Institute Inc, Cary, NC).
RESULTS
Of the 907 subjects screened and enrolled in the run-in period, 767 were randomised: 388 received the active study product, and 379 received the control study product. In total, there were 697 completers: Malaysia 135, the Netherlands 199, Poland 126, Portugal 70, and Thailand 167. Thirty-seven subjects were included in the reference group, which was not randomised (Fig. 1). There were more subjects randomised than was actually calculated as sample size. This was because of logistical reasons, timing differences of start of inclusion periods at different locations and the run-in period, and the fact that it was uncertain how many subjects would remain in the intervention period.
FIGURE 1.
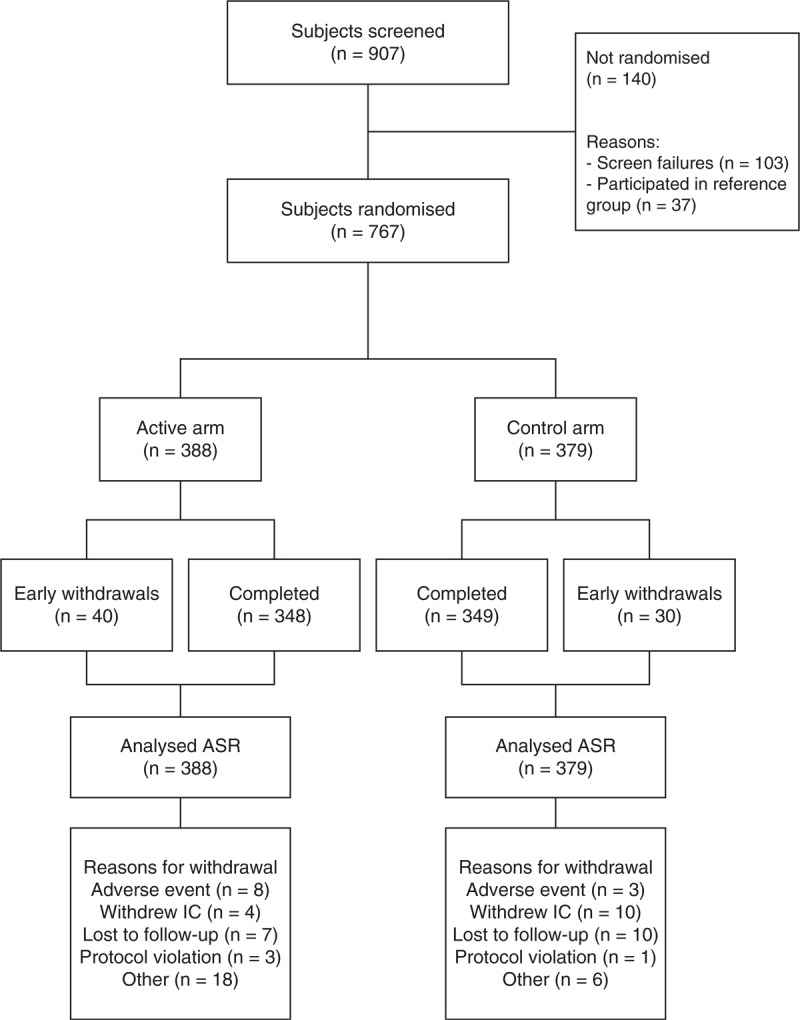
Flowchart of the study. ASR = all subjects randomised.
No statistically significant differences were observed between the 2 groups in regard to age, sex, length, and weight at birth and any of the other baseline characteristics analysed (Table 2). Also, no differences were seen in the mother's and father's characteristics, with regard to the highest level of education or the professional status at baseline (Tables 3 and 4).
TABLE 2.
Demographic data and subjects’ characteristics at baseline in the study groups
| Active group, N = 388 | Control group, N = 379 | P | ||
| Sex* | ||||
| Female | 175 (45.1) | 157 (41.4) | 0.304 | |
| Male | 213 (54.9) | 222 (58.6) | ||
| Age at screening, mo† | 19 (14–24) | 19 (15–24) | 0.283 | |
| Ethnicity* | ||||
| Asian | 165 (42.5) | 159 (42.0) | 0.658 | |
| Black | 4 (1.0) | 6 (1.6) | ||
| White | 202 (52.1) | 189 (49.9) | ||
| Combination | 16 (4.1) | 23 (6.1) | ||
| Other | 1 (0.3) | 2 (0.5) | ||
| Season of birth* | ||||
| Autumn | 95 (24.5) | 87 (23.0) | 0.874 | |
| Spring | 88 (22.7) | 94 (24.8) | ||
| Summer | 70 (18.0) | 71 (18.7) | ||
| Winter | 135 (34.8) | 127 (33.5) | ||
| Type of delivery* | ||||
| Caesarean | 109 (28.1) | 106 (28.0) | 0.969 | |
| Vaginal | 279 (71.9) | 273 (72.0) | ||
| Gestational age, wk† | 39 (38–40) | 39 (38–40) | 0.890 | |
| Length at birth, cm† | 50 (48–53) | 51 (49–53) | 0.241 | |
| Weight at birth, kg† | 3 (3–4) | 3 (3–4) | 0.546 | |
| Estimated total number of infection episodes in the last 6 mo‡ | 3.4 (2.17) | 3.4 (2.17) | 0.942 | |
| Start age of breast-feeding, mo† | 0 (0–0) | 0 (0–0) | 0.606 | |
| End age of breast-feeding, mo† | 5 (2–9) | 5 (3–9) | 0.230 | |
| Start age of formula feeding, mo† | 3 (1–6) | 4 (1–6) | 0.381 | |
| End age of formula feeding, mo† | 18 (14–23) | 18 (14–23) | 0.955 | |
| Start age of cow's milk, mo† | 12 (12–15) | 12 (12–13) | 0.972 | |
| End age of cow's milk† | 30 (27–37) | 33 (29–38) | 0.082 | |
| Start age of weaning food, mo† | 6 (4–6) | 6 (4–6) | 0.426 | |
| Living area of the family* | ||||
| Rural | 37 (9.5) | 36 (9.5) | 0.897 | |
| Suburban | 136 (35.1) | 127 (33.5) | ||
| Urban | 215 (55.4) | 216 (57.0) | ||
| No. rooms in the family house (excl. kitchens, bathrooms, and toilets)* | ||||
| 1–3 | 183 (47.8) | 192 (51.3) | 0.345 | |
| 4–6 | 190 (49.6) | 168 (44.9) | ||
| >6 | 10 (2.6) | 14 (3.7) | ||
| Missing | 5 | 5 | ||
| No. people living at the family house (excl. participating child)* | ||||
| 0 | 0 (0.0) | 1 (0.3) | ||
| 1–3 | 225 (58.7) | 236 (63.1) | 0.410 | |
| 4–6 | 138 (36.0) | 117 (31.3) | ||
| >6 | 20 (5.2) | 20 (5.3) | ||
| Missing | 5 | 5 | ||
| No. siblings of the child (excl. participating child)* | ||||
| 0 | 136 (35.2) | 162 (42.7) | 0.571 | |
| 1 | 166 (43.0) | 145 (38.3) | ||
| 2 | 55 (14.2) | 45 (11.9) | ||
| 3 | 21 (5.4) | 20 (5.3) | ||
| 4 | 4 (1.0) | 3 (0.8) | ||
| 5 | 3 (0.8) | 3 (0.8) | ||
| >5 | 1 (0.3) | 1 (0.3) | ||
| Missing | 2 | 0 | ||
| Smoking during pregnancy of child* | ||||
| No | 364 (95.3) | 358 (95.2) | 0.961 | |
| Yes | 18 (4.7) | 18 (4.8) | ||
| Missing | 6 | 3 | ||
| Age of father, y† | 33 (30–37) | 33 (30–37) | 0.868 | |
| Age of mother, y† | 31 (27–34) | 31 (27–34) | 0.466 | |
| Age of siblings, y† | 5 (2–8) | 4 (2–7) | 0.328 | |
*N (%), P from the χ2 test.
†Median (Q1–Q3), P from the Wilcoxon rank-sum test.
TABLE 3.
Demographic data and mothers’ characteristics at baseline in the study groups
| Active arm, N = 388 | Control arm, N = 379 | P | |
| Highest level of education at baseline* | |||
| Basic minimum education | 47 (12.2) | 45 (11.9) | 0.821 |
| Additional education but not tertiary level | 151 (39.2) | 156 (41.2) | |
| Tertiary education | 184 (47.8) | 173 (45.6) | |
| Unknown | 3 (0.8) | 5 (1.3) | |
| Missing | 3 | 0 | |
| Professional status at baseline* | |||
| Working or self-employed | 325 (84.6) | 328 (87.0) | 0.765 |
| Unable to work | 15 (3.9) | 9 (2.4) | |
| In search of employment | 7 (1.8) | 5 (1.3) | |
| Housewife or houseman | 28 (7.3) | 29 (7.7) | |
| Unemployed | 5 (1.3) | 4 (1.1) | |
| Studying | 4 (1.0) | 2 (0.5) | |
| Missing | 4 | 2 | |
| Mother smoking during pregnancy* | |||
| No | 364 (95.3) | 358 (95.2) | 0.961 |
| Yes | 18 (4.7) | 18 (4.8) | |
| Missing | 6 | 3 | |
*N (%), P from the χ2 test.
TABLE 4.
Demographic data and fathers’ characteristics at baseline in the study groups
| Active arm, N = 388 | Control arm, N = 379 | P | |
| Highest level of education at baseline* | |||
| Basic minimum education | 66 (17.2) | 59 (15.8) | 0.125 |
| Additional education but not tertiary level | 167 (43.5) | 170 (45.5) | |
| Tertiary education | 143 (37.2) | 144 (38.5) | |
| Unknown | 8 (2.1) | 1 (0.3) | |
| Missing | 4 | 5 | |
| Professional status at baseline* | |||
| Working or self-employed | 367 (96.8) | 361 (97.0) | 0.612 |
| Unable to work | 6 (1.6) | 2 (0.5) | |
| In search of employment | 2 (0.5) | 3 (0.8) | |
| Unemployed | 3 (0.8) | 5 (1.3) | |
| Studying | 1 (0.3) | 1 (0.3) | |
| Missing | 9 | 7 | |
*N (%), P value from the χ2 test.
Occurrence of Infections
Logistic regression analysis was performed in which the chance of having ≥1 episodes was modelled against the chance of having 0 episodes; this yielded a P value of 0.03 (299/388 [77%] children active group vs 313/379 [83%] children control group) and a relative risk of 0.93 with a 95% confidence interval 0.87–1.00 and number needed to treat (NNT) 17.
The logistic regression model was based on a distinction between the 2 categories: did infections occur, yes or no; however, the data contained information on the number of reported infection episodes as well (Fig. 2). To analyse all of the available information in the data, a Poisson regression model is needed that can address the fact that a considerable proportion of children had the value 0 (ie, no infections, Fig. 3). The zero-inflated negative binomial regression model is such a model and showed a P value of 0.07 for the overall effect on occurrence of infections. The binomial part of the model analyses the occurrence of zero infections and showed a significant difference (89/388 children active group vs 66/379 children control group; P = 0.03; Fig. 3), whereas the negative binomial part of the model did not show a significant difference. This suggests that the intervention increased the likelihood of having no infections.
FIGURE 2.
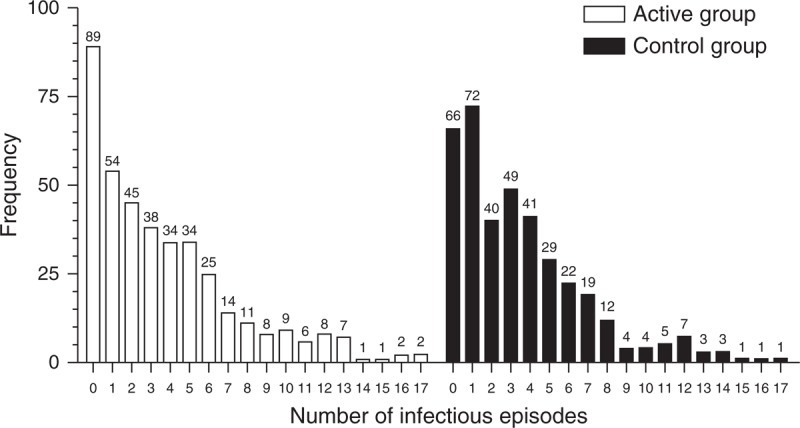
Descriptive statistics for the number of reported episodes during intervention period per group.
FIGURE 3.
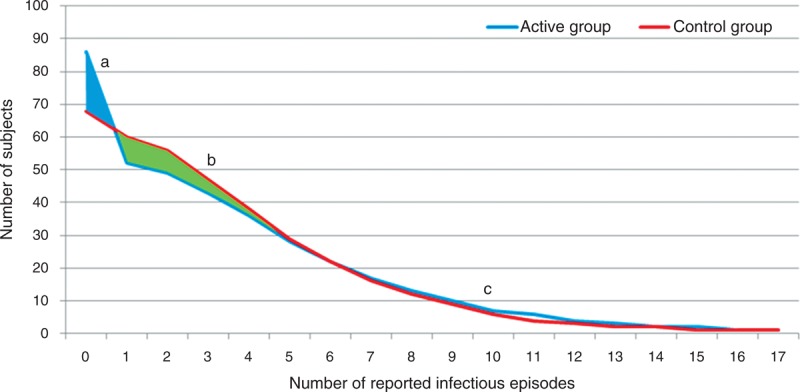
Number of subjects with number of infections for active and control group, based on the statistical model. There are more children with no reported episodes in active group (A). There are fewer children with small numbers of reported episodes in active group (1–5 number of reported infectious episodes) (B). No difference between groups in percentages of children with high number of reported episodes (≥6 number of reported infectious episodes) (C).
A post hoc analysis that focused on only those parent-reported symptoms that were confirmed by an investigator (based on their experience) showed a significant effect (P = 0.004 and relative risk 0.89 with a 95% confidence interval 0.82–0.97, NNT 12, Table 5) on the number of infectious episodes. Also, here this was mostly driven by the higher statistically significant effect on having no infectious episodes (P = 0.003).
TABLE 5.
Percentage of children with episodes with and without confirmation given by investigator
| Active group, N = 388 | Control group, N = 379 | P | RR (95% CI) | NNT | |
| % Children with episodes | 77 | 83 | 0.03 | 0.93 (0.87–1.00) | 17 |
| % Children with episodes confirmed by investigator | 69 | 77 | 0.004 | 0.89 (0.82–0.97) | 12 |
Post hoc analyses: arm comparison: (active vs control), P values are based on logistic regression. CI = confidence interval; NNT = number needed to treat.
Furthermore, post hoc analyses were performed to check for differences when URTI and GII were analysed separately with or without fever. No effect was observed (Table 6).
TABLE 6.
Number of infectious episodes split for GII and URTI with or without fever
| Active vs control group | GII or URTI (original) | Only GII | Only URTI | With fever | Without fever |
| RR | 0.93 | 0.98 | 0.91 | 0.91 | 1.00 |
| 95% CI | 0.87–1.00 | 0.86–1.12 | 0.84–0.99 | 0.82–1.02 | 0.90–1.11 |
| P | 0.07 | 0.50 | 0.10 | 0.19 | 0.47 |
Post hoc analyses: arm comparison: RR and corresponding 95% CIs are calculated based on raw data, whereas P values are based on zero-inflated negative binomial regression model. CI = confidence interval; GII = gastrointestinal infections; NNT = number needed to treat; URTI = upper respiratory tract infection; RR = relative risk.
Secondary outcomes such as any type of medication use (which consisted of oral antibiotics, paracetamol-acetaminophen, cough mixture medication, nose drops/spray, ear drops, oral rehydration solution, homeopathic medication, and any other medication) and duration of absence from day care showed no significant differences between the 2 study groups (Table 7).
TABLE 7.
Medication use and duration of absence from day care
| Active group, N = 388 | Control group, N = 379 | P | |
| Use of any type of medication, median (IQR) | 3.0 (1.0–6.0) | 3.0 (1.0–6.0) | 0.408 |
| Duration of absence from day care, median (IQR) | 2.0 (0.0–7.0) | 3.0 (0.0–8.0) | 0.536 |
Secondary outcomes: arm comparison: (active vs control), P values are based on Wilcoxon rank-sum test. IQR = interquartile range.
In total, 2217 adverse events, including 78 serious adverse events, were reported. The majority of adverse events (∼49%) were related to the respiratory system (eg, cough, fever, blocked or runny nose, sore throat, wheeze, ear discharge). A total of 29 adverse events were assessed by the investigator as possibly or probably related to the study product during the run-in or intervention period. The related adverse events were mild GI symptoms and occurred equally between the 2 groups. None of the reported serious adverse events were assessed as related to study product and none were unexpected.
Comparison of GUM Groups With Cow's Milk Group
In the study, the small nonrandomised cow's milk reference group, coming from the Netherlands only, was compared with the total active and control groups. Both study groups had fewer parent-reported episodes than the cow's milk group (cow's milk vs active: P = 0.008; and cow's milk vs control: P = 0.004; Table 8).
TABLE 8.
Comparison of cow's milk reference group vs GUM groups on the occurrence of infections
| Cow's milk group vs | RR (95% CI) | P |
| Active group | 1.19 (1.07–1.33) | 0.008 |
| Control group | 1.11 (1.00–1.24) | 0.004 |
| Active and control groups | 1.15 (1.04–1.28) | 0.005 |
Post hoc analyses: RR and corresponding 95% CIs are calculated based on raw data, whereas P obtained from nonparametric test of the Mann-Whitney U test. CI = confidence interval; RR = relative risk.
Time to occurrence of first reported episode was significantly different (P = 0.04) between active and cow's milk group in favour of the active group with a survival comparison with log-rank test. A Kaplan-Meier curve (Fig. 4) showed the same result when looking at deviations between the active versus the cow's milk group.
FIGURE 4.
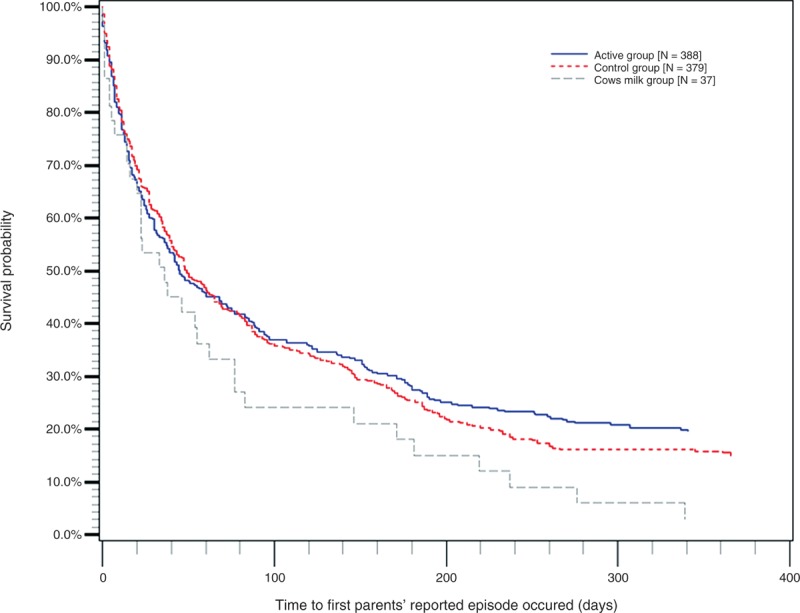
The Kaplan-Meier curve. Active, control, and cow's milk group: time to occurrence of first reported episode.
GUM Intake, Weight, and Height
The mean average intake of GUM products was 528 mL/day, and no significant differences were found between the 2 study groups regarding daily intake of the study products (active: 529 ± 128 vs control: 527 ± 139 mL/day; Table 9). The daily intake of scGOS/lcFOS (9:1) was at least 3.6 g/day, and for DHA + EPA, this was at least 57.6 mg/day. Subjects in the active arm weighed statistically significantly less at baseline and were smaller when compared with the control arm (Table 10); however, these differences are seen as normal variability of weight and height. It is not expected that this difference could influence the study outcome. The difference in weight was maintained throughout the intervention period; however, for body mass index and for the change in weight and height, no statistically significant difference between the 2 study arms was observed.
TABLE 9.
Compliance with study product intake
| Intake of study product during intervention period, mL/day | |||
| Active group, N = 388 | Control group, N = 379 | Overall | |
| No. infants missing | 377 (11) | 378 (1) | 755 (12) |
| Mean | 528.8 | 527.2 | 528.0 |
| Standard deviation | 128.2 | 139.2 | 133.7 |
Arm comparison: active vs control, the t test P = 0.8715.
TABLE 10.
Weight, height, and BMI
| Weight (kg), length (cm), and BMI (kg/m2) by visit (excluding screen failures)* | Active group, N = 388 | Control group, N = 379 | Reference group, N = 33 | P active vs control | P active vs reference | P control vs reference |
| Weight of child at baseline | 11.2 (1.64) | 11.6 (1.77) | 12.2 (1.16) | 0.007 | 0.0001 | 0.003 |
| Weight of child at wk 52 | 13.9 (2.05) | 14.4 (2.27) | 14.8 (1.30) | 0.005 | 0.0007 | 0.087 |
| Weight change of child from baseline at wk 52 | 2.7 (1.45) | 2.8 (1.41) | 2.5 (0.91) | 0.266 | 0.196 | 0.051 |
| Length of child at baseline | 82.4 (5.80) | 83.1 (6.06) | 86.5 (5.15) | 0.098 | 0.0001 | 0.001 |
| Length of child at wk 52 | 92.3 (5.50) | 93.3 (5.52) | 97.8 (5.78) | 0.010 | 0.0001 | 0.0001 |
| Length change of child from baseline at wk 52 | 9.9 (3.29) | 10.3 (3.20) | 11.2 (3.62) | 0.149 | 0.045 | 0.144 |
| BMI of child at baseline | 16.6 (1.66) | 16.8 (1.89) | 16.4 (1.77) | 0.107 | 0.540 | 0.243 |
| BMI of child at wk 52 | 16.4 (1.90) | 16.5 (2.19) | 15.6 (1.72) | 0.321 | 0.023 | 0.012 |
| BMI change of child from baseline at wk 52 | −0.1 (1.92) | −0.2 (1.88) | −0.9 (1.37) | 0.693 | 0.010 | 0.017 |
BMI = body mass index.
*Mean (SD), P refers to the t test.
The weight change from baseline at week 52 of children from the reference group compared with the active or control group did not differ significantly; however, the length change and BMI change did differ significantly (except for length change when reference was compared with control).
DISCUSSION
This randomised double-blind controlled clinical study is the first to show a reduced risk of infections in young children following consumption of GUM supplemented with scGOS/lcFOS/n-3 LCPUFAs. It is remarkable that although the GUM is only a relatively small part of a young child's diet, it can apparently influence the risk of infections. The borderline significant effect we observed is mainly derived from the decreased risk of developing an infection. This does not mean that the child does not encounter any viral or bacterial microorganism, but that the child does not experience symptoms of the infection. This implies that the child is better equipped against infections.
This is the first study conducted in young children to demonstrate that the use of a prebiotic mixture can influence the risk of infections. Similar studies have evaluated the effect of consumption of milk with probiotics on incidence of infections, with different results. In a randomised double-blind placebo-controlled study (n = 281, age range 1–7 years), administration of Lactobacillus GG (LGG) resulted in a significantly reduced risk of URTI (19). Another study in which LGG was administered showed a reduction in the number of children with respiratory infections (20). Neither study showed any effect on GII. A more recent study with LGG could not show an effect on respiratory illness in children (21), but the daily dose of LGG in this study was lower compared with the other studies. In contrast, results from another study with other bacteria, Bifidobacterium lactis or Lactobacillus reuteri, did not show a beneficial probiotic effect on the duration of respiratory illness (18). In contrast to the above reports, in our study, we investigated the effect of GUM with prebiotics and LCPUFAs, not with the addition of probiotics. Our results indicate that the specific scGOS/lcFOS prebiotic mixture and LCPUFAs can have an effect only on the risk of infections. Moreover, the dropout rate was extremely low (only 10%) in this study, and also the compliance of product intake over both groups was better compared with other published studies. In our study, we evaluated the combination of URTI and GII together and not separately.
As for the mechanism responsible for the beneficial role of GUM supplemented with scGOS/lcFOS/n-3 LCPUFAs, studies in infants have documented that the mixture of scGOS/lcFOS supports immune development by significantly improving the intestinal microbiota. A healthy microbiota in turn is important for the development of the immune system. The positive effects of scGOS/lcFOS on the immune response have also been observed in experimental animal studies (22,23). Furthermore, several LCPUFA supplementation studies in preterm infants (24), term infants (25,26), and school-age children (27) suggest normalisation and improved immune function following dietary LCPUFAs supplementation. Supplementation of LCPUFAs to infant formula resulted in cytokine and T-cell population profiles that were more similar to those of breast-fed infants compared with those of unsupplemented formula-fed infants, and resulted in reduced incidence of respiratory illnesses (26). LCPUFA supplementation in children 5 to 7 years of age appeared to result in enhanced initiation of the immune response to B-cell mitogen and a reduced inflammatory response (27). Finally, dietary DHA enrichment reduced the incidence and severity of illnesses in Thai schoolchildren (28,29), and these effects were accompanied by a shift of cytokine profile toward a less inflammatory profile. Together, these studies support the concept that a dietary source of n-3 LCPUFAs can improve immune function in children, and thereby support disease resistance. Few studies have been done in which the effect of prebiotics on infections was examined. We recently reported the results of a study with healthy young children indicating that the use of a GUM with added scGOS/lcFOS/n-3 LCPUFAs leads to a higher level of bifidobacteria during the intake period compared with the control group (29a). The mechanisms of prebiotics and n-3 LCPUFAs apparently operated in a complementary way on infections in this study.
As for the clinical relevance of the results of this study, there was only a 6% lower risk of infectious episodes when using GUM supplemented with scGOS/lcFOS/n-3 LCPUFAs and an 8% lower risk when the data of the investigator-confirmed episodes analysis are used. The NNT to prevent one child from having an infectious episode is 17, and when the data of the investigator-confirmed episodes analysis are used, this decreases to 12. Knowing that the study product is a food product, which only accounts for a small part of a child's diet, the effect on NNT is large. Furthermore, this may have a positive effect on health economics. What the exact effect will be on health care cost reduction remains to be investigated.
We are aware of several limitations to our study. First, the symptoms were based on parental reporting, but we did not actually determine whether the children with symptoms had infections by measuring immune responses. Second, a low frequency of infections was observed, which could be because of underreporting. Underreporting could also be a result of the parental reporting of symptoms. Study results were only measured as parent-reported symptoms, to limit the burden for the child. Third, because there are no clear definitions, the definitions for the respiratory and/or GI symptoms used throughout this study are not exactly the same as in other published studies, which makes it sometimes difficult to compare the results. In addition, there are no validated questionnaires available for the monitoring of respiratory symptoms, which would have made the results more consistent with other studies.
The comparison of the cow's milk group with the GUM groups showed that more infectious episodes were observed in the cow's milk group. We realise that the cow's milk group was not randomised or powered. Therefore, the results obtained should be interpreted with caution; however, the results suggest that GUM as such has a beneficial effect on the occurrence of infections compared with cow's milk. This could be because of the fact that GUM is nutritionally enriched compared with cow's milk. GUM contains relevant vitamins and minerals required for that age range, which may contribute to a better support of growth and development, and may indirectly positively affect the immune system. Iron and vitamin D, for instance, are 2 nutrients included in GUM for which intake is often seen as insufficient in young children (30,31) (nutritional surveys in several countries, systematic surveys of nutrition and health status of young children and women of child-bearing age based on literature review and expert opinions conducted in several countries). An explanation for the significant difference in height change between reference group and active group could be that the children from the reference group were from the Netherlands only. It is well known that people from northern Europe, and especially the Netherlands, are tall compared with people from other European countries and Asia. The fact that there was no significant difference in weight change was to be expected because the ratio of height and weight should not differ. Further studies in which cow's milk is compared with GUM for effects on the occurrence of infections are needed to obtain conclusive results.
In conclusion, this is the first study in children to show a reduced risk of infection following consumption of GUM supplemented with scGOS/lcFOS/n-3 LCPUFAs. Although the primary outcome was of borderline statistical significance, it is supported by the post hoc significantly decreased risk of infectious symptoms with investigator-confirmed episodes; therefore, this study supports the use of GUM supplemented with scGOS/lcFOS/n-3 LCPUFAs to reduce the risk of infection in children attending day care centres.
Acknowledgments
The authors thank the parents of the children in the GIANT study for their contribution and the site staff from all of the participating sites from the GIANT study group for their valuable assistance in the study.
Footnotes
Drs Chatchatee and Lee participated equally in this study.
www.trialregister.nl registration no.: NTR1451.
Y.Y., B.S., and P.L. are employees of Nutricia Research. The other authors report no conflicts of interest.
REFERENCES
- 1.Ferson MJ. Infections in day care. Curr Opin Pediatr 1993; 5:35–40 [DOI] [PubMed] [Google Scholar]
- 2.Istre GR, Conner JS, Broome CV, et al. Risk factors for primary invasive Haemophilus influenzae disease: increased risk from day care attendance and school-aged household members. J Pediatr 1985; 106:190–195 [DOI] [PubMed] [Google Scholar]
- 3.Nystad W, Skrondal A, Magnus P. Day care attendance, recurrent respiratory tract infections and asthma. Int J Epidemiol 1999; 28:882–887 [DOI] [PubMed] [Google Scholar]
- 4.Lu N, Samuels ME, Shi L, et al. Child day care risks of common infectious diseases revisited. Child Care Health Dev 2004; 30:361–368 [DOI] [PubMed] [Google Scholar]
- 5.Ponka A, Nurmi T, Salminen E, et al. Infections and other illnesses of children in day-care centers in Helsinki. I: incidences and effects of home and day-care center variables. Infection 1991; 19:230–236 [DOI] [PubMed] [Google Scholar]
- 6.Boehm G, Lidestri M, Casetta P, et al. Supplementation of a bovine milk formula with an oligosaccharide mixture increases counts of faecal bifidobacteria in preterm infants. Arch Dis Child Fetal Neonatal Ed 2002; 86:F178–F181 [DOI] [PMC free article] [PubMed] [Google Scholar]
- 7.Knol J, Scholtens P, Kafka C, et al. Colon microflora in infants fed formula with galacto- and fructo-oligosaccharides: more like breast-fed infants. J Pediatr Gastroenterol Nutr 2005; 40:36–42 [DOI] [PubMed] [Google Scholar]
- 8.Gibson GR, Roberfroid MB. Dietary modulation of the human colonic microbiota: introducing the concept of prebiotics. J Nutr 1995; 125:1401–1412 [DOI] [PubMed] [Google Scholar]
- 9.Bruzzese E, Volpicelli M, Squeglia V, et al. A formula containing galacto- and fructo-oligosaccharides prevents intestinal and extra-intestinal infections: an observational study. Clin Nutr 2009; 28:156–161 [DOI] [PubMed] [Google Scholar]
- 10.Arslanoglu S, Moro GE, Boehm G. Early supplementation of prebiotic oligosaccharides protects formula-fed infants against infections during the first 6 months of life. J Nutr 2007; 137:2420–2424 [DOI] [PubMed] [Google Scholar]
- 11.Kew S, Mesa MD, Tricon S, et al. Effects of oils rich in eicosapentaenoic and docosahexaenoic acids on immune cell composition and function in healthy humans. Am J Clin Nutr 2004; 79:674–681 [DOI] [PubMed] [Google Scholar]
- 12.Miles EA, Banerjee T, Dooper MM, et al. The influence of different combinations of gamma-linolenic acid, stearidonic acid and EPA on immune function in healthy young male subjects. Br J Nutr 2004; 91:893–903 [DOI] [PubMed] [Google Scholar]
- 13.Rees D, Miles EA, Banerjee T, et al. Dose-related effects of eicosapentaenoic acid on innate immune function in healthy humans: a comparison of young and older men. Am J Clin Nutr 2006; 83:331–342 [DOI] [PubMed] [Google Scholar]
- 14.Thies F, Nebe-von-Caron G, Powell JR, et al. Dietary supplementation with gamma-linolenic acid or fish oil decreases T lymphocyte proliferation in healthy older humans. J Nutr 2001; 131:1918–1927 [DOI] [PubMed] [Google Scholar]
- 15.Yaqoob P, Pala HS, Cortina-Borja M, et al. Encapsulated fish oil enriched in alpha-tocopherol alters plasma phospholipid and mononuclear cell fatty acid compositions but not mononuclear cell functions. Eur J Clin Invest 2000; 30:260–274 [DOI] [PubMed] [Google Scholar]
- 16.Simopoulos AP. The importance of the ratio of omega-6/omega-3 essential fatty acids. Biomed Pharmacother 2002; 56:365–379 [DOI] [PubMed] [Google Scholar]
- 17.Cohen HA, Varsano I, Kahan E, et al. Effectiveness of an herbal preparation containing echinacea, propolis, and vitamin C in preventing respiratory tract infections in children: a randomised, double-blind, placebo-controlled, multicenter study. Arch Pediatr Adolesc Med 2004; 158:217–221 [DOI] [PubMed] [Google Scholar]
- 18.Weizman Z, Asli G, Alsheikh A. Effect of a probiotic infant formula on infections in child care centers: comparison of two probiotic agents. Pediatrics 2005; 115:5–9 [DOI] [PubMed] [Google Scholar]
- 19.Hojsak I, Snovak N, Abdovik S, et al. Lactobacillus GG in the prevention of gastrointestinal and respiratory tract infections in children who attend day care centers: a randomized, double-blind, placebo-controlled trial. Clin Nutr 2010; 29:312–316 [DOI] [PubMed] [Google Scholar]
- 20.Hatakka K, Savilahti E, Ponka A, et al. Effect of long term consumption of probiotic milk on infections in children attending day care centres: double blind, randomised trial. BMJ 2001; 322:1327. [DOI] [PMC free article] [PubMed] [Google Scholar]
- 21.Kumpu M, Kekkonen RA, Kautianinen H, et al. Milk containing probiotic Lactobacillus rhamnosus GG and respiratory illness in children: a randomized, double-blind, placebo-controlled trial. Eur J Clin Nutr 2012; 66:1–4 [DOI] [PubMed] [Google Scholar]
- 22.Vos AP, Haarman M, Buco A, et al. A specific prebiotic oligosaccharide mixture stimulates delayed-type hypersensitivity in a murine influenza vaccination model. Int Immunopharmacol 2006; 6:1277–1286 [DOI] [PubMed] [Google Scholar]
- 23.Vos AP, Haarman M, van Ginkel JW, et al. Dietary supplementation of neutral and acidic oligosaccharides enhances Th1-dependent vaccination responses in mice. Pediatr Allergy Immunol 2007; 18:304–312 [DOI] [PubMed] [Google Scholar]
- 24.Field CJ, Thomson CA, Van Aerde JE, et al. Lower proportion of CD45R0+ cells and deficient interleukin-10 production by formula-fed infants, compared with human-fed, is corrected with supplementation of long-chain polyunsaturated fatty acids. J Pediatr Gastroenterol Nutr 2000; 31:291–299 [DOI] [PubMed] [Google Scholar]
- 25.Field CJ, Van Aerde JE, Robinson LE, et al. Effect of providing a formula supplemented with long-chain polyunsaturated fatty acids on immunity in full-term neonates. Br J Nutr 2008; 99:1–9 [DOI] [PubMed] [Google Scholar]
- 26.Pator N, Soler B, Mitmesser SH, et al. Infants fed docosahexaenoic acid and arachidonic acid supplemented formula have decreased incidence of respiratory illnesses the first year of life. Clin Pediatr (Phila) 2006; 45:850–855 [DOI] [PubMed] [Google Scholar]
- 27.Mazurak VC. Supplementation with long chain polyunsaturated fatty acids reduces markers of inflammation in children with low DHA intakes. Paper presented at: 39th annual meeting of the European Society of Paediatric Gastroenterology, Hepatology and Nutrition; Dresden, Germany; 2006 [Google Scholar]
- 28.Thienprasert A, et al. Omega-3 fatty acids supplementation reduces episodes and severity of illnesses in schoolchildren: a double blind randomized placebo controlled trial. Paper presented at: 5th European Federation Lipid Congress; Gothenburg, Sweden; 2007 [Google Scholar]
- 29.Thienprasert A, Pattanapanyasat K, Sukapirom K. Dose effect of docosahexaenoic acid on severity of illness in Thai schoolchildren: a randomized double blind placebo controlled intervention trial. Paper presented at: 7th Congress of the International Society for the Study of Fatty Acids & Lipids; Cairns, Australia; 2006 [Google Scholar]
- 29.Rezaiki L, et al. Paper presented at: International Symposium of Probiotics Prebiotics in Pediatrics (IS3P); Istanbul; February 24–26, 2012 [Google Scholar]
- 30.Ziegler EE. Consumption of cow's milk as a cause of iron deficiency in infants and toddlers. Nutr Rev 2014; 69 suppl 1:S37–s42 [DOI] [PubMed] [Google Scholar]
- 31.Gordon CM, Feldman HA, Sinclair L, et al. Prevalence of vitamin D deficiency among healthy infants and toddlers. Arch Pediatr Adolesc Med 2008; 162:505–512 [DOI] [PMC free article] [PubMed] [Google Scholar]