

Abstract
The prevalence of multidrug resistance among clinically significant bacterial pathogens underscores a critical need for the development of new classes of antibiotics with novel mechanisms of action. Here we describe the synthesis and evaluation of a guanidinomethyl biaryl compound {1-((4′-(tert-butyl)-[1,1′-biphenyl]-3-yl)methyl)guanidine} that targets the bacterial cell division protein FtsZ. In vitro studies with various bacterial FtsZ proteins reveal that the compound alters the dynamics of FtsZ self-polymerization via a stimulatory mechanism, while minimally impacting the polymerization of tubulin, the closest mammalian homologue of FtsZ. The FtsZ binding site of the compound is identified through a combination of computational and mutational approaches. The compound exhibits a broad spectrum of bactericidal activity, including activity against the multidrug-resistant pathogens methicillin-resistant Staphylococcus aureus (MRSA) and vancomycin-resistant Enterococcus (VRE), while also exhibiting a minimal potential to induce resistance. Taken together, our results highlight the compound as a promising new FtsZ-targeting bactericidal agent.
INTRODUCTION
Multidrug resistance in bacterial pathogens has emerged as a major global public health problem.1–8 Examples of multidrug-resistant (MDR) strains of Gram-positive and Gram-negative bacteria include methicillin-resistant Staphylococcus aureus (MRSA), vancomycin-resistant Enterococcus (VRE), and extended spectrum β-lactamase (ESBL)-producing Escherichia coli and Klebsiella pneumoniae. The growing threat from MDR bacterial pathogens highlights a critical need to expand our currently available arsenal of antibiotics. Despite this critical need, many of the new antibiotics that have reached the clinic in the past 50 years have been next-generation derivatives of existing drugs and thus suffer from the same propensity as their predecessors to become targets of resistance pathways.9 Consequently, there is an urgent need for the development of new classes of antibiotics that exhibit novel mechanisms of action.
The bacterial cell division protein FtsZ has been recently highlighted as an important new antibacterial target yet to be clinically exploited.9–31 FtsZ is particularly appealing as an antibacterial target due to it being (i) essential for bacterial viability, (ii) highly conserved among significant bacterial pathogens, and (iii) absent in humans. Bi and Lutkenhaus identified FtsZ as the first bacterial cell division protein, while showing that it adopts a ring-like structure (termed the Z-ring) at midcell.32 FtsZ forms the Z-ring via a process of GTP-dependent self-polymerization.33–36 The Z-ring plays a key role in constriction of the cell membrane and serves as a scaffold for recruitment of other components of the cell division machinery (the divisome).33,34,36 Thus, FtsZ resides at the top of the hierarchy of divisome assembly.
As part of a program to develop new chemical classes of FtsZ-targeting antibacterial agents, we have synthesized libraries of a broad array of heterocyclic molecules, including benzo[c]-phenanthridines and dibenzo[a,g]quinoliziniums.37,38 In the current study, we describe the chemical synthesis and characterization of a guanidinomethyl biaryl compound that acts as a stimulator of FtsZ self-polymerization and exhibits potent bactericidal activity. The interactions of the compound, and two of its aza-substituted analogues, with FtsZ proteins from S. aureus, E. coli, and Enterococcus faecalis are investigated, and the target site on the protein is identified using a combination of computational, spectroscopic, mutational, and biochemical analyses. The antibacterial activities of the compounds are assessed against a broad array of both Gram-positive and Gram-negative pathogens, including MDR strains of S. aureus, E. faecalis, E. coli, and K. pneumoniae.
CHEMISTRY
The commercially available halogenated aryl aldehydes 1, 2, and aryl bromide 3 were treated with 4-(tert-butyl)-phenylboronic acid using standard Suzuki conditions to provide the biaryl compounds 4, 5, and 6 in over 80% yield. Reduction of 4 and 5 using NaBH4 followed by reaction with excess MsCl provided the corresponding chlorides 7 and 8 in very good yield. Bromination of 6 in the presence of light with N-bromosuccinimide in carbon tetrachloride furnished the 2-(bromomethyl)aryl intermediate in moderate yield. These chloro and bromomethyl intermediates were then treated with 1,3-bis(tert-butoxycarbonyl)guanidine to give 10, 11, and 12. Removal of the bis-N-Boc protecting groups with trifluoroacetic acid provided the desired guanidinomethyl analogues 13–15 in quantitative yield.
RESULTS AND DISCUSSION
Binding Affinity of 13 for S. aureus, E. coli, and E. faecalis FtsZ
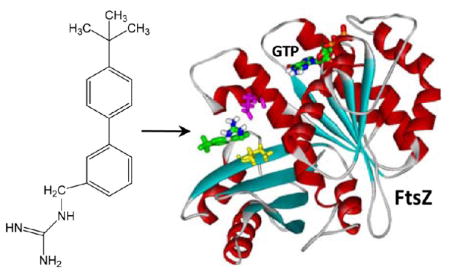
We sought to determine whether the synthesized compound 13 shown in Figure 1 interacts with bacterial FtsZ proteins, and if so, to define the binding affinity of the compound for the host proteins. For these determinations, we exploited the fluorescence properties of 13, which exhibits an emission maximum at 318 nm when excited with middle UV light at a wavelength of 245 nm. Purified S. aureus, E. coli, and E. faecalis FtsZ (denoted SaFtsZ, EcFtsZ, and EfFtsZ, respectively) were used as model bacterial FtsZ proteins in these experiments. The fluorescence anisotropy of 13 was measured in the presence of increasing FtsZ concentrations, with the resulting anisotropy profiles being shown in Figure 2. Note that addition of each of the three FtsZ proteins increases the anisotropy of 13 in a concentration-dependent manner, with the magnitude of the increase being similar in the presence of SaFtsZ and EcFtsZ, while being comparatively lower in the presence of EfFtsZ. This observation is indicative of 13 binding to each host protein, while also suggesting that the rotational diffusion of the compound is greater when bound to EfFtsZ than to SaFtsZ or EcFtsZ. The FtsZ-induced changes in 13 anisotropy (r) were analyzed with the following 1:1 binding formalism to yield compound–protein dissociation constants (Kd):
| (1) |
Figure 1.
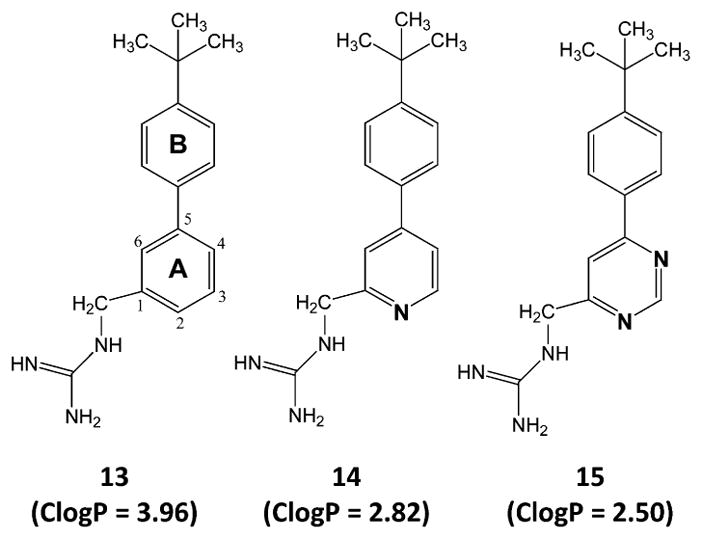
Chemical structures and calculated lipophilicities (ClogP) of 13–15. The indicated ClogP values were calculated using the weighted method (VG = KLOP = PHYS = 1) in the Marvin 5.7 Software Suite (ChemAxon, Ltd.), with Cl− and Na+/K+ concentrations being set at 0.1 mol/dm3. The atomic numbering and ring lettering are indicated in the structure of 13.
Figure 2.
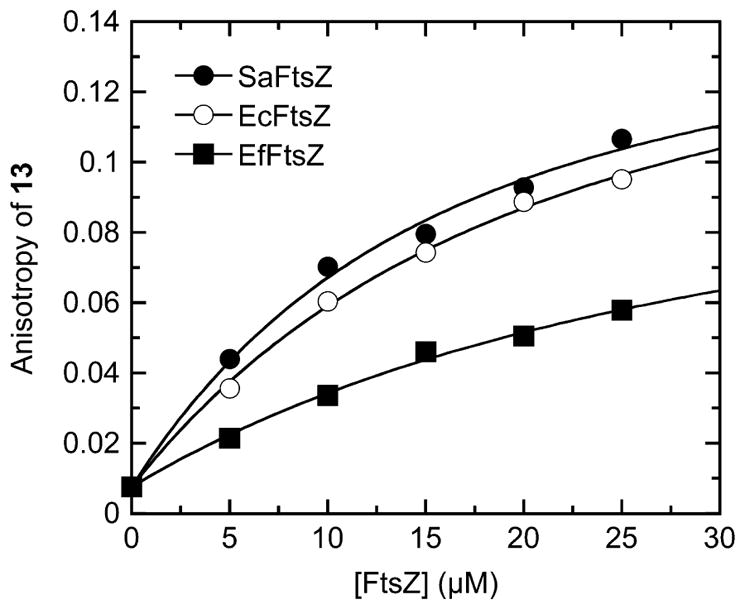
Fluorescence anisotropies of 5 μM 13 as a function of increasing concentrations of SaFtsZ (●), EcFtsZ (○), or EfFtsZ (■). The solid lines reflect the nonlinear least-squares fits of the data with eq 1. Experiments were conducted at 25 °C in solution containing 50 mM Tris·HCl (pH 7.4), 50 mM KCl, and 2 mM magnesium acetate.
In this relationship, r0 and r are the anisotropies of the compound in the absence and presence of protein, respectively, r∞ is the anisotropy of the compound in the presence of an infinite protein concentration, and [C]tot and [P]tot are the total concentrations of compound and protein, respectively. Note that the 1:1 binding formalism yields excellent fits (R2 > 0.99) of all three 13 anisotropy profiles (the solid lines in Figure 2). The Kd values obtained from these fits are listed in Table 1. The interactions of 13 with SaFtsZ and EcFtsZ are associated with similar Kd values of 3.5 ± 0.5 μM and 3.8 ± 0.3 μM, respectively, the difference between the two values being within the experimental uncertainty. The corresponding interaction of EfFtsZ with 13 is associated with a Kd value of 21.8 ± 4.6 μM, indicating that the affinity of 13 for the FtsZ protein from E. faecalis is approximately 6-fold lower than the corresponding affinity of the compound for the FtsZ proteins from S. aureus and E. coli. Taken together, these results indicate that 13 binds to the three FtsZ proteins with a stoichiometry of one compound molecule per protein and affinities in the range of 3.5 ± 0.5 to 21.8 ± 4.6 μM. Although we also investigated the binding of 14 and 15 to the three FtsZ proteins, the weak nature of the binding interactions precluded the quantitative assessment of Kd values for these compounds, due to large experimental uncertainties.
Table 1.
Affinity of 13 for S. aureus, E. coli, and E. faecalis FtsZ at 25 °Ca
| FtsZ | Kd (μM) |
|---|---|
| S. aureus | 3.5 ± 0.5 |
| E. coli | 3.8 ± 0.3 |
| E. faecalis | 21.8 ± 4.6 |
Solution conditions were 50 mM Tris·HCl (pH 7.4), 50 mM KCl, and 2 mM magnesium acetate.
13 Stimulates the Polymerization Dynamics of SaFtsZ, EcFtsZ, and EfFtsZ in a Concentration-Dependent Manner
We next sought to examine whether the binding of 13 to FtsZ had an impact on the self-polymerization activity of the protein. To assay this FtsZ function, we utilized a microtiter plate-based light-scattering assay in which FtsZ polymerization is detected in solution by a time-dependent increase in light scattering, as reflected by a corresponding increase in solution absorbance at 340 nm (A340). Using this light-scattering assay, the impact of increasing concentrations of 13 on the polymerization dynamics of purified SaFtsZ, EcFtsZ, and EfFtsZ was assessed. Figure 3 shows the time-dependent A340 profiles of SaFtsZ (panel A), EcFtsZ (panel B), and EfFtsZ (panel C) in the presence of 13 at concentrations ranging from 0 to 40 μg/mL. Note that 13 increases both the kinetics and extent of SaFtsZ, EcFtsZ, and EfFtsZ polymerization, with the magnitude of these stimulatory effects increasing with increasing compound concentration. It has been previously reported that the antistaphylococcal substituted benzamide PC190723 exerts a similar stimulatory impact on SaFtsZ polymerization.15,24,25 However, unlike 13, PC190723 does not affect the polymerization of EcFtsZ.25
Figure 3.

Concentration dependence and structure–activity relationship of the impact of the biaryl compounds on the polymerization of SaFtsZ (A and D), EcFtsZ (B and E), and EfFtsZ (C and F), as determined by monitoring time-dependent changes in absorbance at 340 nm (A340) at 25 °C. (A–C) The time-dependent A340 polymerization profiles of each target FtsZ in the presence of 13 at the indicated concentrations. (D–F) Time-dependent A340 polymerization profiles of each target FtsZ in the presence of vehicle (DMSO) only or 40 μg/mL of 13, 14, 15, or the indicated comparator drugs. Experimental conditions for all the FtsZ polymerization studies were 10 μM protein, 50 mM Tris·HCl (pH 7.4), 50 mM KCl, 2 mM magnesium acetate, 1 mM CaCl2 (for SaFtsZ) or 10 mM CaCl2 (for EcFtsZ and EfFtsZ), and 1 mM GTP.
There is a marked increase in 13-induced stimulation of EcFtsZ polymerization when the compound concentration is increased from 30 to 40 μg/mL (Figure 3B), with the same being true for the induced stimulation of EfFtsZ polymerization when the concentration of 13 is increased above 20 μg/mL (Figure 3C). This behavior is likely due to an increase in the extent of FtsZ polymer bundling at the higher compound concentrations. The presence of large bundles of FtsZ polymers may also underlie the noisy nature of the A340 profiles of SaFtsZ and EfFtsZ at the higher concentrations of 13 (Figure 3A,C).
Structure–Activity Relationship (SAR) of 13–15: Aza Substitution of 13 Diminishes Stimulation of FtsZ Polymerization
The impacts of 14 and 15 on SaFtsZ, EcFtsZ, and EfFtsZ polymerization were also determined for subsequent comparison with the corresponding behavior of 13. Recall that 14 and 15 are aza-substituted analogues of 13, with 14 containing a single aza substitution at position 4 and 15 containing two aza substitutions at positions 2 and 4 (see Figure 1). At equivalent concentrations of 40 μg/mL, the extent to which the three compounds stimulate the polymerization of all three host FtsZ proteins follows the hierarchy: 13 > 14 > 15 (see Figure 3D–F). Thus, the monoaza substitution in 14 adversely impacts the ability of the compound to stimulate FtsZ polymerization relative to the unsubstituted compound 13, with the corresponding adverse impact of the diaza substitution in 15 being even greater still. Note that each aza substitution results in a decrease in compound hydrophobicity, as reflected by the decreasing ClogP values of 13 (ClogP = 3.96), 14 (ClogP = 2.82), and 15 (ClogP = 2.50). Significantly, this ClogP hierarchy is identical to that defined above for the extent of FtsZ polymerization stimulation by the three compounds. This correlation implies that the ability to stimulate FtsZ polymerization is influenced by the hydrophobicity of the compound, with increasing hydrophobicity resulting in enhanced stimulation of FtsZ polymerization. We have observed a similar pattern with other classes of heterocyclic compounds.37,38
Also included in the polymerization profiles shown in Figure 3D–F are four non-FtsZ-targeting control drugs for each FtsZ protein investigated. Clindamycin and oxacillin were used as non-FtsZ-targeting controls in the SaFtsZ polymerization assays, as these agents exhibit potent antistaphylococcal activity. For similar reasons of antibacterial specificity, ampicillin and vancomycin were used as the controls agents in the polymerization assays of EcFtsZ and EfFtsZ, respectively. The four control antibiotics target either the bacterial cell wall (oxacillin, ampicillin, and vancomycin) or bacterial protein synthesis (clindamycin).39,40 As expected, and in marked contrast to 13, equivalent concentrations of the non-FtsZ-targeting control drugs exert a negligible impact on FtsZ polymerization.
13 Promotes the Assembly and Bundling of FtsZ Polymers As Revealed by Electron Microscopy
We visualized the FtsZ polymers induced by 20 μg/mL 13 using transmission electron microscopy (EM). Negatively stained electron micrographs of 13-induced polymers of SaFtsZ and EcFtsZ are shown in Figure 4. Inspection of these images reveals that 13 induces long filamentous polymers in both SaFtsZ and EcFtsZ. However, the widths of the filaments observed for SaFtsZ vary widely from approximately 4 to 25 nm, while the widths of the EcFtsZ filaments have a narrow range of approximately 4 to 6 nm. The arrows in Figure 4A highlight SaFtsZ filaments approximately 5 nm (red arrow), 11 nm (white arrow), and 25 nm (yellow arrow) in width. Previously reported crystal structures of both Gram-positive and Gram-negative bacterial FtsZ proteins have revealed molecular widths ranging from approximately 45 to 60 Å in a perpendicular direction to the protofilament axis.15,41–44 It is, therefore, likely that the 5-nm filament corresponds to a single SaFtsZ polymer, the 11-nm filament corresponds to two SaFtsZ polymers bundled together, and the 25-nm filament corresponds to a bundle of four to five SaFtsZ polymers. In contrast to the SaFtsZ filaments, the EcFtsZ filaments have a relatively uniform width of approximately 4 to 6 nm (with the arrow in Figure 4B highlighting a representative 5-nm filament) and likely reflect single EcFtsZ polymers that are not bundled together. Note that, under the experimental conditions employed, neither SaFtsZ nor EcFtsZ polymers were observable in the absence of added compound.
Figure 4.

Transmission electron micrographs of 13-induced filaments of (A) SaFtsZ and (B) EcFtsZ. Polymerization of the proteins was induced by addition of 20 μg/mL 13 under the experimental conditions described in the legend to Figure 3. The filaments were negatively stained with a solution of 1% phosphotungstic acid (PTA) and visualized at 80 kV on a Philips CM12 transmission microscope interfaced with an AMT XR111 camera. The red, white, and yellow arrows in panel A highlight filaments 5, 11, and 25 nm wide, respectively. The red arrow in panel B highlights a 5 nm wide filament.
Viewed as a whole, the EM data suggest that, at 20 μg/mL, 13 promotes both the assembly and bundling of SaFtsZ polymers, while promoting only the assembly, and not the bundling, of EcFtsZ polymers. This difference in the impact of 13 on SaFtsZ versus EcFtsZ polymerization and bundling may account for the difference in the magnitudes of the light-scattering (A340) signals of the two proteins induced by the compound (compare Figure 3A,B). At each equivalent concentration of 13, the extent of light scattering is greater for SaFtsZ than for EcFtsZ, which may reflect the presence of thick filaments of bundled polymers in the SaFtsZ solution that are absent from or reduced in the EcFtsZ solution. Thick filaments of bundled FtsZ polymers would scatter light more effectively than thin filaments of single FtsZ polymers.
The Interaction of GTP with SaFtsZ, EcFtsZ, and EfFtsZ Is Minimally Affected by the Presence of 13
The studies described above indicate that 13 binds to bacterial FtsZ and stimulates its self-polymerization in the presence of GTP. These findings prompted further investigation into the nature of the FtsZ binding site targeted by 13. Our initial investigations focused on determining whether 13 targeted the GTP binding pocket of FtsZ. Toward this end, we developed a fluorescence anisotropy competition assay to assess the impact, if any, of 13 binding on the interaction of SaFtsZ, EcFtsZ, and EfFtsZ with GTP. Note that in this assay, the anisotropy of a fluorescent nonhydrolyzable GTP analogue (composed of GTPγS conjugated to the fluorescent dye BODIPY and, hereafter, denoted as BoGTPγS) was monitored rather than the anisotropy of 13. Specifically, the impact of increasing concentrations of 13 on the anisotropy of FtsZ-bound BoGTPγS was recorded and compared with the corresponding anisotropy of unbound (FtsZ-free) BoGTPγS.
Upon binding to each target FtsZ, the anisotropy of BoGTPγS increases by approximately 5- to 6-fold (Figure 5). If 13 targets the nucleotide binding pocket of FtsZ, then it should compete with the binding of BoGTPγS, thereby resulting in the release of the FtsZ-bound nucleotide analogue and a concomitant decrease in BoGTPγS anisotropy. For comparative purposes, unlabeled nonfluorescent GTP was included as a positive control in these assays. Inspection of the anisotropy profiles in Figure 5A–C reveals that unlabeled GTP induces a marked, concentration-dependent decrease in the anisotropy of FtsZ-bound BoGTPγS, consistent with the expected GTP-induced release of FtsZ-bound BoGTPγS. By contrast, 13 does not significantly alter the anisotropy of BoGTPγS bound to SaFtsZ, EcFtsZ, or EfFtsZ, even at a 40-fold excess of 13 (40 μM) relative to BoGTPγS (1 μM). These observations suggest that 13 binding to SaFtsZ, EcFtsZ, and EfFtsZ does not induce the release of bound GTP and are therefore inconsistent with the nucleotide binding pocket of FtsZ serving as the target site for the compound.
Figure 5.
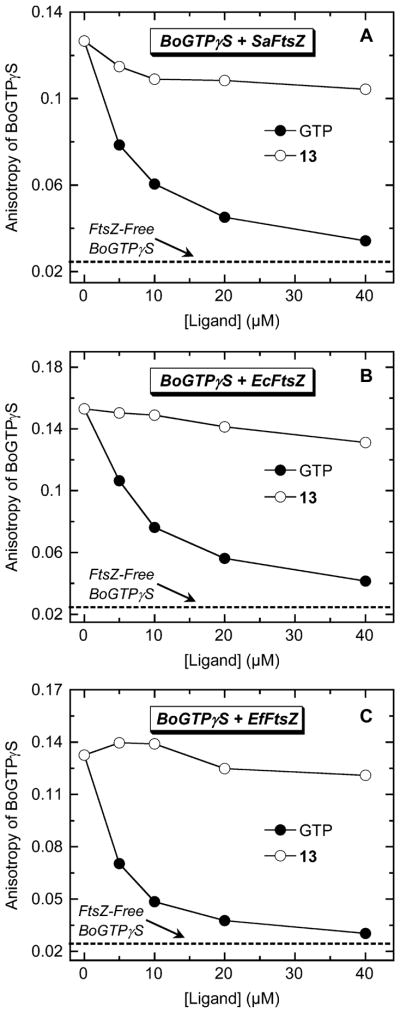
Fluorescence anisotropies of SaFtsZ-bound (A), EcFtsZ-bound (B), and EfFtsZ-bound (C) BoGTPγS (1 μM BoGTPγS, 5 μM FtsZ) as a function of increasing concentrations of nonfluorescent unlabeled GTP (●) or 13 (○). The dashed line represents the anisotropy value of 1 μM BoGTPγS in the absence of FtsZ (FtsZ-free BoGTPγS). Experimental conditions were as described in the legend to Figure 2.
Computational Studies Suggest That 13 Binds SaFtsZ at a Site Distal from the GTP Binding Pocket
As our fluorescence anisotropy competition assays ruled against the GTP binding pocket as the target site for 13, we probed for other potential FtsZ binding sites for the compound using a computational approach. In this computational approach (detailed in Experimental Section), we first developed a homology model for SaFtsZ using a reported crystal structure of Bacillus subtilis FtsZ,15 which has an 81% sequence identity with SaFtsZ. We then used the Autodock Vina docking algorithm to dock 13 to the structural model of SaFtsZ and found that the compound preferentially targeted a pocket in SaFtsZ located near the C-terminal domain of the protein, at a site distinct from the GTP binding pocket (see Figure 6). Significantly, this pocket is in the same vicinity as the purported binding site of the FtsZ polymerization stimulator PC190723.15,24,25 Figure 6B,C presents expanded views of 13 bound to SaFtsZ. Note that residues E185 and I228 form key interactions with the compound, the first being an electrostatic contact between the acidic side chain of E185 and the basic guanidinomethyl functionality of the compound and the second being a van der Waals contact between the branched alkyl side chain of I228 and phenyl ring A of the compound.
Figure 6.
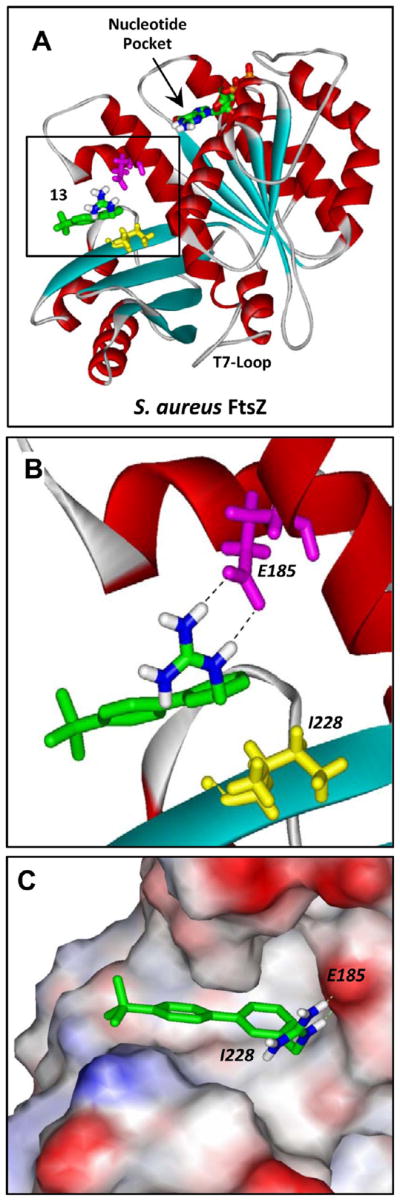
Structural homology model of SaFtsZ in complex with 13 derived as detailed in Experimental Section. (A) SaFtsZ is schematically depicted according to its secondary structural elements (α-helices in red, β-strands in cyan, and loops in gray), with the GTP binding pocket and T7 loop (which is involved in nucleotide hydrolysis when the proteins are polymerized) indicated. The 13–FtsZ complex shown reflects the highest scoring complex obtained using the Autodock Vina molecular docking program. The E185 and I228 residues of the protein are indicated in magenta and yellow, respectively. 13 and the bound nucleotide are depicted as a stick models and color coded by atom (carbon in green, nitrogen in blue, oxygen in red, phosphorus in orange, and hydrogen in white). (B, C) Expanded views of 13 bound to SaFtsZ. In panel B, the dashed lines reflect hydrogen bonds between the basic guanidinomethyl functionality of the compound and the acidic side chain of E185. In panel C, the protein is depicted in its solvent-accessible surface and color coded according to its electrostatic potential (blue for positive, red for negative, and white for neutral).
Site-Directed Mutagenesis of the E185 and I228 Residues of SaFtsZ Reduce Affinity for 13, as well as the Extent to Which the Compound Stimulates SaFtsZ Polymerization
If 13 does indeed target the SaFtsZ site indicated by our computational studies, then mutations intended to disrupt the contacts between 13 and the E185 and I228 residues should diminish the affinity of the compound for the protein. To this end, we made two different mutant forms of SaFtsZ, one with the E185 residue mutated to alanine (E185A) and the other with the I228 residue mutated to arginine (I228R). We then used the 13 fluorescence anisotropy assay described above to determine the binding affinity of the compound for each of the mutant proteins. As observed for the wild-type protein, addition of either of the mutant proteins to 13 increased the anisotropy of the compound in a concentration-dependent manner (Figure 7). However, the magnitudes of the increases at equivalent protein concentrations were significantly lower for the mutants relative to the wild-type protein. The FtsZ-induced changes in 13 anisotropy were analyzed with eq 1 to yield the Kd values listed in Table 2. Significantly, 13 binds to the E185A and I228R mutant proteins (Kd = 38.3 ± 5.4 and 32.9 ± 6.2 μM, respectively) with an approximately 10-fold lower affinity than the wild-type protein (Kd = 3.5 ± 0.5 μM). These results validate the 13 target site on SaFtsZ identified by the computational studies. The reduced affinity of 13 for the E185A mutant relative to the wild-type protein correlates with the intended disruption of favorable electrostatic contacts between the basic guanidino functionality on the compound and the carboxylate group on E185. Similarly, the reduced affinity of 13 for the I228R mutant relative to the wild-type protein likely includes contributions from the intended abrogation of favorable hydrophobic contacts between ring A of the compound and I228. However, it is also possible that the reduced affinity for the I228R mutant may include contributions from unfavorable electrostatic repulsive forces between the basic guanidino functionality on the introduced arginine and that on the compound.
Figure 7.
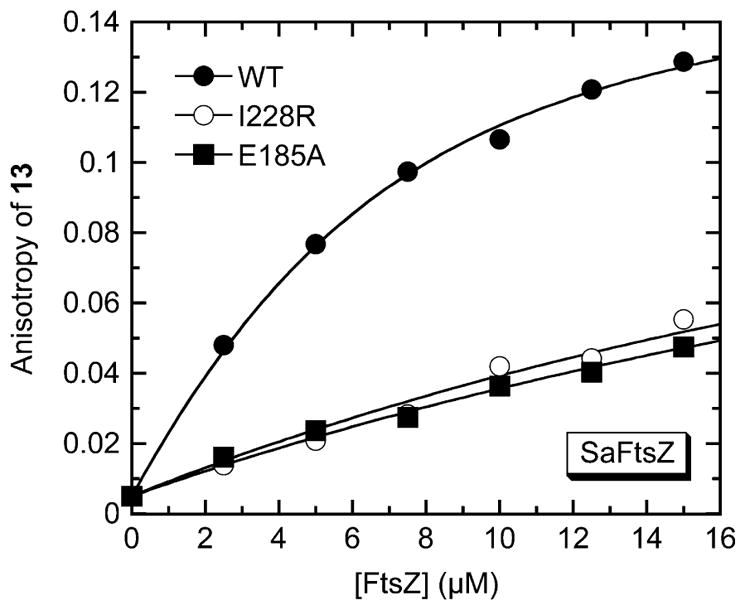
Fluorescence anisotropies of 5 μM 13 as a function of increasing concentrations of wild-type (●), I228R mutant (○), or E185A mutant (■) SaFtsZ. The solid lines reflect the nonlinear least-squares fits of the data with eq 1. Experimental conditions were as described in the legend to Figure 2.
Table 2.
Impact of the E185A and I228R Mutations on the Affinity of 13 for SaFtsZ at 25 °Ca
| SaFtsZ | Kd (μM) |
|---|---|
| wild-type | 3.5 ± 0.5 |
| E185A | 38.3 ± 5.4 |
| I228R | 32.9 ± 6.2 |
Solution conditions were as described in the footnote to Table 1.
Previous studies have shown that a G196A mutation in SaFtsZ confers resistance to the FtsZ polymerization stimulator PC190723.15,24,25 Our computational studies indicate that the G196 residue of SaFtsZ does not form any contacts with bound 13. Thus, a G196A mutation should not impact the affinity of 13 for the protein. To test this hypothesis, we made a third mutant SaFtsZ protein containing the G196A mutation and assessed its affinity for 13. This assessment yielded a Kd value (5.0 ± 0.7 μM) similar in magnitude to that associated with the interaction of 13 with the wild-type protein, lending further support to the computationally defined 13 binding site on SaFtsZ.
We next sought to determine whether the E185A and I228R mutations impact the polymerization activity of SaFtsZ using the light-scattering assay described above. Figure 8 shows the time-dependent A340 profiles of wild-type (panel A), E185A (panel B), and I228R (panel C) SaFtsZ in the absence of compound (the black profiles in each panel). The extent of polymerization exhibited by the E185A mutant protein is reduced in comparison to the wild-type protein, while the extent of polymerization exhibited by the I228R mutant protein is slightly higher than that exhibited by the wild-type protein. In addition, the shape of the time-dependent A340 profile of the I228R mutant protein differs from the corresponding shape of wild-type profile in that it rises to a maximal value at approximately 15 min and then decreases, a behavior that likely reflects a time-dependent depolymerization from larger to smaller polymeric structures on the part of the I228R mutant protein. These collective results indicate that both the E185R and I228R mutations do impact the intrinsic polymerization activity of SaFtsZ to some degree, with the nature of this impact depending on the mutation.
Figure 8.
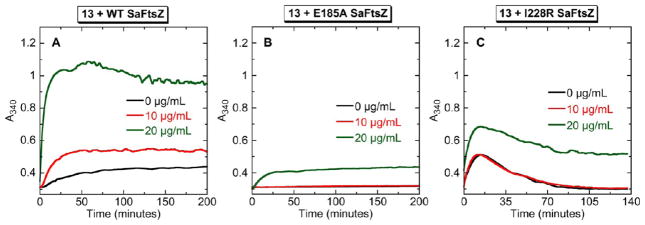
Concentration dependence of the impact of 13 on the polymerization of wild-type (WT) (A), E185A mutant (B), and I228R mutant (C) SaFtsZ, as determined by monitoring time-dependent changes in A340. The time-dependent A340 profiles of 10 μM protein are shown in the absence (black) and presence of 13 at concentrations of 10 (red) or 20 (green) μg/mL. Experimental conditions were as described in the legend to Figure 3.
We also explored how the E185A and I228R mutations affect the stimulation of SaFtsZ polymerization by 13, with the results of these assessments being shown in Figure 8. At a concentration of 10 μg/mL, 13 exerts a stimulatory impact on wild-type SaFtsZ polymerization but has essentially no effect on the polymerization of either mutant protein. Only when 13 is present at a concentration of 20 μg/mL does it stimulate the polymerization of the mutant proteins, but, even then, the magnitude of the stimulation is markedly lower than that observed for wild-type SaFtsZ. As noted above with regard to impact on 13 binding affinity, the G196A mutation had a negligible effect on the stimulation of SaFtsZ polymerization by 13 (not shown). Taken together, these results indicate that the interactions of 13 with the E185 and I228 residues of SaFtsZ play an important role not only in facilitating the binding interaction but also in compound-induced stimulation of polymerization. Recall that reduction of 13 hydrophobicity via mono and diaza substitution of ring A (to yield 14 and 15, respectively) resulted in reduced FtsZ binding as well as reduced stimulation of FtsZ polymerization. On the basis of our mutational studies, it is likely that this behavior stems, at least in part, from the key hydrophobic interactions formed between I228 and compound ring A.
SAR of 13–15 with Regard to Antibacterial Activity against S. aureus, E. faecalis, and E. coli
The antibacterial activities of 13–15 against S. aureus were evaluated using two MSSA strains (8325-4 and ATCC 49951) and two MRSA strains (ATCC 33591 and Mu3). The ATCC 49951 MSSA strain is a heavily encapsulated (CP++) strain denoted as a mucoid strain.45 Mu3 is a MRSA clinical isolate also classified as being a hetero-glycopeptide-intermediate S. aureus (hetero-GISA).46 As shown in Table 3, the two MRSA strains examined are not only resistant to the antistaphylococcal drug oxacillin (MIC >64.0 μg/mL) but are also cross-resistant to other clinical antibiotic classes, including the lincosamides (e.g., clindamycin) and the macrolides (e.g., erythromycin). Significantly, 13 exhibits potent activity against all four S. aureus strains, with an MIC value of 1 μg/mL versus each of the strains. This MIC value associated with 13 is similar to the corresponding MIC values associated with the clinical glycopeptide antibiotic vancomycin (MIC values ranging from 0.5 to 2.0 μg/mL). Although 13 is not as potent as oxacillin, clindamycin, and erythromycin against the two MSSA strains tested, it is worthy to note that it exhibits potent antibacterial activity against both the MRSA strains for which all three comparator antibiotics are ineffective. This observation underscores the potential value of 13 as a promising lead compound with antimicrobial activity against the MDR pathogen MRSA.
Table 3.
Antibacterial Activities of 13–15 against S. aureus and E. faecalis
| MIC (μg/mL)
|
||||||
|---|---|---|---|---|---|---|
| compound or control agent | S. aureus 8325-4 (MSSA) | S. aureus ATCC 49951 (MSSA) | S. aureus ATCC 33591 (MRSA) | S. aureus Mu3a (MRSA) | E. faecalis ATCC 19433 (VSE) | E. faecalis ATCC 51575 (VRE) |
| 13 | 1.0 | 1.0 | 1.0 | 1.0 | 4.0 | 4.0 |
| 14 | 8.0 | 8.0 | 16.0 | 8.0 | 32.0 | 64.0 |
| 15 | 64.0 | 32.0 | 64.0 | 32.0 | >64.0 | >64.0 |
| oxacillin | 0.063 | 0.25 | >64.0 | >64.0 | 8.0 | 64.0 |
| clindamycin | 0.031 | 0.063 | >64.0 | >64.0 | 2.0 | >64.0 |
| erythromycin | 0.125 | 0.25 | >64.0 | >64.0 | 1.0 | >64.0 |
| vancomycin | 0.5 | 0.5 | 2.0 | 2.0 | 1.0 | >64.0 |
Mu3 is a clinical MRSA isolate also identified as being a hetero-glycopeptide-intermediate S. aureus (hetero-GISA) strain.
A comparison of the MIC values of 13–15 for both MSSA and MRSA reveals that the antistaphylococcal potencies of the compounds follow the hierarchy: 13 > 14 > 15 (Table 3). Note the correlation between this hierarchy and that defined above with regard to stimulation of SaFtsZ polymerization (Figure 3D). This gratifying concordance is consistent with FtsZ serving as the antibacterial target of these compounds.
We also investigated the activities of 13–15 against a second Gram-positive bacterial species, E. faecalis, using both vancomycin-sensitive and vancomycin-resistant strains (VSE and VRE, respectively) as models (Table 3). The VSE strain (ATCC 19433) is sensitive to all four comparator antibiotics examined (vancomycin, oxacillin, clindamycin, and erythromycin), with MIC values ranging from 1 to 8 μg/mL. By contrast, the VRE strain (ATCC 51575) is resistant to all four comparator agents (MIC ≥64 μg/mL). Significantly, 13 is equally active against VSE and VRE (MIC = 4 μg/mL). The SAR for 13–15 against E. faecalis follows the same hierarchy noted above for S. aureus (13 > 14 > 15) and also correlates well with the corresponding SAR for the stimulation of EfFtsZ polymerization (Figure 3F).
In addition to their SAR against the Gram-positive bacteria discussed above, the corresponding SAR of 13–15 against the Gram-negative bacteria E. coli was also assessed. Three different E. coli strains were used in these assessments (summarized in Table 4), an AcrAB efflux pump mutant strain (N43) and its wild-type homologue (W4573),47 as well as an extended spectrum β-lactamase (ESBL)-producing strain (ATCC BAA-201) that expresses the TEM-3 lactamase. The β-lactam antibiotic ampicillin and the aminoglycoside amikacin were used as comparator control agents in these assays, as these drugs have known activities versus E. coli. Note that the ESBL-producing strain is resistant (MIC >64.0 μg/mL) not only to the β-lactam drug ampicillin but also to amikacin. By contrast, 13 is active (MIC of 16.0 μg/mL) against the ESBL-producing strain, while also exhibiting a similar activity against W4573. It is also worthy of emphasis that the activity of 13 against N43 is 8-fold more potent (MIC = 2.0 μg/mL) than its activity against W4573, an observation indicating that the compound is a substrate for the AcrAB efflux transporter. This finding provides insights into potential strategies to improve the potency of 13 versus AcrAB-expressing E. coli, including cotreatment of the compound with AcrAB efflux pump inhibitors (EPIs), such as phenylalanyl arginyl β-naphthylamide (PAβN).48
Table 4.
Antibacterial Activities of 13–15 against E. coli
| MIC (μg/mL)
|
|||
|---|---|---|---|
| compound or control agent | ATCC BAA-201a (ESBL) | W4573 | N43b (acrA1) |
| 13 | 16.0 | 16.0 | 2.0 |
| 14 | 64.0 | 64.0 | 8.0 |
| 15 | >64.0 | >64.0 | 32.0 |
| ampicillin | >64.0 | 4.0 | 2.0 |
| amikacin | >64.0 | 2.0 | 1.0 |
ATCC BAA-201 is an extended spectrum β-lactamase (ESBL)-producing strain that expresses the TEM-3 lactamase.
N43 is an AcrAB efflux pump mutant strain of W4573.
Further inspection of the MIC data in Table 4 reveals that the SAR of 13–15 for all three E. coli strains follows the same hierarchy of activity observed for S. aureus and E. faecalis (13 > 14 > 15), as well as the corresponding SAR for the stimulation of EcFtsZ polymerization (Figure 3E). As with 13, the activities of both 14 and 15 are more potent against N43 than W4573, indicating that these compounds are also substrates of the AcrAB efflux pump.
Activity of 13 against Other Gram-Positive and Gram-Negative Bacteria
The antibacterial activity of 13 was further explored against other Gram-positive and Gram-negative bacteria. The Gram-positive organisms examined were Streptococcus pyogenes (Strep A), Streptococcus agalactiae (Strep B), and B. subtilis, while the Gram-negative organisms tested included Acinetobacter baumannii and two different strains of K. pneumoniae, one of which is an ESBL-producing strain that expresses the SHV-18 β-lactamase. Although 13 is active against all the bacterial strains examined (MIC = 2.0 to 32.0 μg/mL), its potency is, in general, greater against the Gram-positive than the Gram-negative bacteria (see Table 5). This difference in potency could be due, at least in part, to the expression of RND-type efflux pumps such as AcrAB by the Gram-negative bacteria.49
Table 5.
Activity of 13 against Other Gram-Positive and Gram-Negative Bacteria
| bacterial strain | ATCC no. | MIC (μg/mL) |
|---|---|---|
| S. pyogenes (Strep A) | 19615 | 2.0 |
| S. agalactiae (Strep B) | 12386 | 16.0 |
| B. subtilis | 23857 | 4.0 |
| A. baumannii | 19606 | 16.0 |
| K. pneumoniae | 13883 | 32.0 |
| K. pneumoniae (ESBL)a | 700603 | 16.0 |
ATCC 700603 is an ESBL-producing strain of K. pneumoniae that expresses the SHV-18 lactamase.
13 is Bactericidal against S. aureus and E. coli
The antibacterial activity of 13 highlighted by the results in Tables 3–5 prompted further investigation as to whether this activity is bactericidal or bacteriostatic in nature. To this end, the MBC values of 13 against S. aureus 8325-4 (MSSA) and E. coli W4573 were determined and subsequently compared with corresponding MIC values. The bactericidal antistaphylococcal drug vancomycin and the bacteriostatic drug erythromycin were used as comparator controls in the S. aureus determinations, with the bactericidal aminoglycoside neomycin being used as a comparator control in the E. coli assays.39,50 As per CLSI standards, a MBC/MIC ratio of 1 to 2 is considered indicative of bactericidal behavior.51 By contrast, an MBC/MIC ratio ≥8 is viewed as being indicative of bacteriostatic behavior. As expected, the control bactericidal agents vancomycin and neomycin yielded MBC/MIC ratios of 2, with a corresponding ratio of 256 being observed for the bacteriostatic agent erythromycin (see Table 6). Significantly, 13 exhibits identical MBC and MIC values (i.e., an MBC/MIC ratio of 1) for both S. aureus and E. coli, indicative of a bactericidal mode of action against both bacterial species. Thus, 13 exhibits bactericidal behavior against both Gram-positive and Gram-negative bacteria.
Table 6.
Comparison of MIC and MBC Values for 13 in S. aureus and E. coli
| compound or control agenta | MIC (μg/mL) | MBC (μg/mL) | MBC/MIC |
|---|---|---|---|
| S. aureus 8325-4 | |||
| 13 | 1.0 | 1.0 | 1 |
| vancomycin | 0.5 | 1.0 | 2 |
| erythromycin | 0.125 | 32.0 | 256 |
| E. coli W4573 | |||
| 13 | 16.0 | 16.0 | 1 |
| neomycin | 1.0 | 2.0 | 2 |
Vancomycin and neomycin are included as control bactericidal agents, while erythromycin is included as a control bacteriostatic agent.
Kinetics of the Bactericidal Activity of 13 against S. aureus
With the bactericidal nature of 13 having been established, the kinetics of killing was next investigated in S. aureus 8325-4. Time-kill curves reveal that the rate at which 13 kills S. aureus is dependent on compound concentration, with higher concentrations resulting in greater rates of kill (Figure 9A). At a concentration of 8 × MIC (8 μg/mL), 13 reduces the bacterial number (as indicated by the number of colony forming units, CFUs) by three logs within 2 h and by four logs within 6 h. Note that this rate of kill is approximately 100-times greater than that associated with an equivalent concentration (8 × MIC) of vancomycin and more than 1000-times greater than the corresponding kill rate of erythromycin (Figure 9B).
Figure 9.

Time–kill curves for S. aureus 8325-4 (MSSA). Each data point reflects the average of two independent measurements, with the error bars reflecting the standard deviation from the mean. (A) Bacteria were treated with vehicle (DMSO) only or 13 at concentrations ranging from 1 to 8 × MIC (1 to 8 μg/mL). (B) Bacteria were treated with vehicle only, 13, vancomycin, or erythromycin. When present, all agents were used at a concentration corresponding to 8 × MIC.
13 Exhibits a Minimal Potential for Inducing Resistance in S. aureus
In addition to the bactericidal kinetics of 13, the potential for the compound to induce the emergence of resistance in S. aureus was also assessed using two techniques: (1) a stepwise broth microdilution approach and (2) a large inoculum approach. In the stepwise broth microdilution approach, microtiter wells containing 2-fold increasing concentrations of compound are inoculated with S. aureus 8325-4 bacteria (at 105 CFU/mL). After 24 h of incubation, aliquots from wells containing the highest compound concentration and still showing turbidity (i.e., bacterial growth) are used to inoculate a new microtiter plate containing serial 2-fold compound dilutions. This procedure is then repeated for multiple cycles, and the compound MIC is determined for each cycle. An increase in MIC with successive cycles is indicative of induced resistance. The RNA synthesis inhibitor rifampicin was used as a comparator control agent in these studies (the results of which are shown in Figure 10), since this antibiotic is known to induce spontaneous mutants in S. aureus at a rate of 10−6 to 10−8.52,53 Note that the MIC of rifampicin increased more than 500-fold within 8 incubation cycles. In striking contrast, even after 12 incubation cycles, the MIC of 13 did not change to any significant degree, an observation consistent with the compound having a minimal potential to induce resistance in S. aureus.
Figure 10.
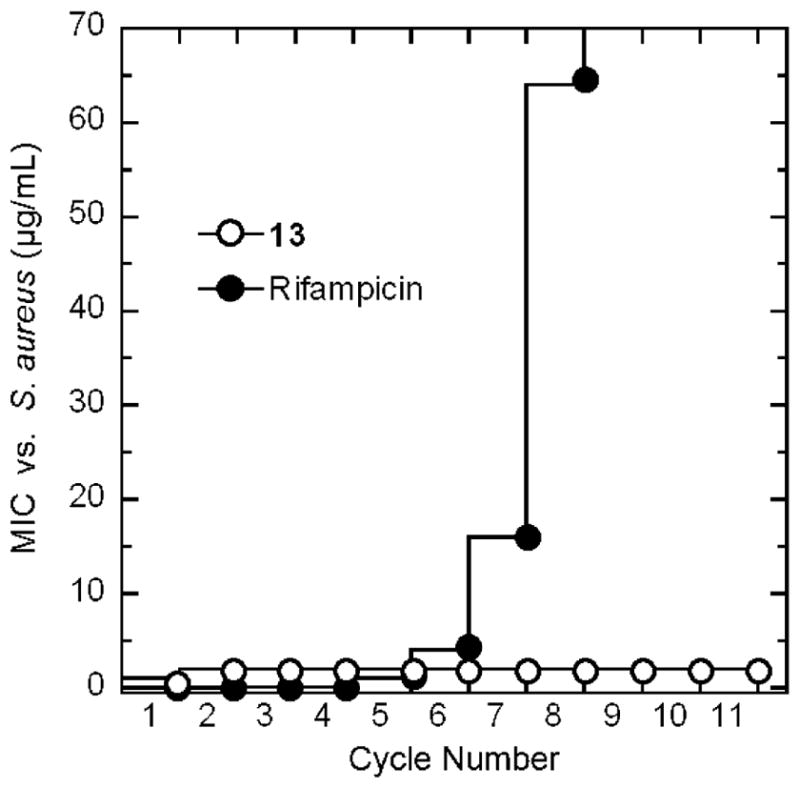
Probing for the emergence of S. aureus 8325-4 (MSSA) resistance to 13 and the comparator agent rifampicin by monitoring MIC over repeated cycles of incubation in the presence of compound.
Consistent with the stepwise broth microdilution approach, the large inoculum approach also indicated that 13 is associated with a minimal potential for inducing resistance in S. aureus. In this latter approach, a large inoculum of ~3 × 10⁹ CFU/mL of S. aureus was prepared and plated onto selective tryptic soy agar (TSA) plates containing either 13 or rifampicin at concentrations 4- to 32-fold higher than their MIC values. The plates were incubated at 37 °C overnight and examined after 24 h. Colonies were observed in 100% of the control rifampicin-containing plates, and the ratio of the number of colonies observed to total number of CFUs plated yielded a mutational frequency of (2.5 ± 0.3) × 10−8, a value similar to that reported previously for rifampicin.54 In contrast to rifampicin, none of the 13-containing plates developed colonies, yielding a mutational frequency of (<3.1 ± 0.8) × 10−9. Collectively, both the stepwise broth microdilution and large inoculum experiments demonstrate a minimal potential on the part of 13 for inducing resistance in S. aureus, a desirable property for an antistaphylococcal agent.
13 Has a Negligible Impact on the Polymerization of Mammalian Tubulin
FtsZ and eukaryotic tubulin share only a weak sequence identity, yet their three-dimensional structures are similar (see Figure 11A).41–44,55,56 Due to this structural similarity, tubulin is considered the closest eukaryotic homologue of FtsZ. The antineoplastic drug paclitaxel (taxol) is known to exert its antitubulin activity by stimulating tubulin self-polymerization,57,58 another example of a compound having a detrimental impact on a protein by interfering with the dynamics of protein self-polymerization. Löwe and coworkers have reported the structure of β-tubulin bound to taxol, thereby revealing the drug binding site in the protein.59 Interestingly, taxol binds tubulin at a site located in an equivalent domain to that identified by our computational studies as the binding site of 13 in SaFtsZ (Figure 11A). The similarity between the target binding sites of taxol and 13, coupled with the similar stimulatory impact the two compounds have on their target proteins, suggests that the two compounds may disrupt the functions of their protein targets via a similar molecular mechanism.
Figure 11.
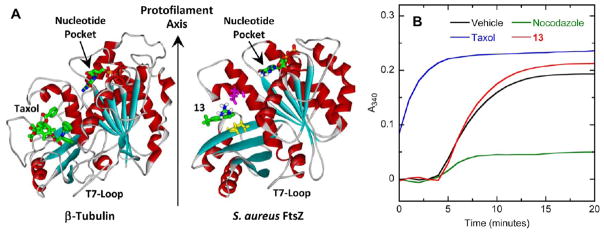
(A) Comparison of the crystal structure of the β-tubulin–taxol complex (PDB 1JFF)59 with the homology model of SaFtsZ in complex with 13. The proteins, nucleotides, and compounds are depicted as described in Figure 6A. The orientation of protofilament growth is indicated. (B) Comparison of the impact of 13 and the antineoplastic drugs paclitaxel (taxol) and nocodazole on the polymerization of microtubule-associated protein (MAP)-rich porcine β-tubulin (70% β-tubulin, 30% MAPs) at 37 °C. The time-dependent A340 profiles of 2 mg/mL porcine β-tubulin are presented in the presence of vehicle (DMSO) only (black), 40 μg/mL 13 (red), 25 μg/mL taxol (blue), or 10 μg/mL nocodazole (green). Experimental conditions for the tubulin polymerization studies were 80 mM PIPES·NaOH (pH 7.0), 2 mM MgCl2, 1 mM EGTA, and 1 mM GTP.
Considering the structural similarity between tubulin and FtsZ, we sought to determine whether 13 exhibits any cross-reactivity with tubulin. If cross-reactive, 13 would likely be associated with toxicity in tubulin-expressing mammalian cells, which, in turn, could potentially limit the clinical utility of the compound. To explore the impact, if any, of 13 on tubulin self-polymerization, we used a light-scattering assay similar to that described above for FtsZ polymerization, but using porcine β-tubulin containing 30% microtubule-associated proteins (MAPS) instead of FtsZ. Taxol and a second antineoplastic drug nocodazole were used as positive controls in these assays, the former drug being a known stimulator of tubulin polymerization57,58 and the latter drug being a known inhibitor of tubulin polymerization.60 Figure 11B shows the time-dependent A340 profiles of porcine β-tubulin in the absence and presence of 13 (at 40 μg/mL), taxol (at 25 μg/mL), or nocodazole (at 10 μg/mL). Taxol exhibits its expected stimulatory impact on tubulin polymerization dynamics, with this stimulation being sufficient in magnitude to render the nucleation phase (i.e., the ~4-min lag period observed in the presence of vehicle only) unobservable within the time frame of the experiment. In addition, nocodazole also exhibits its expected inhibitory impact on tubulin polymerization. In striking contrast to the control agents, 13 exerts a negligible impact, despite it being present at a comparatively higher concentration. Thus, the profound stimulatory impact of 13 on bacterial FtsZ polymerization (Figure 3) is not observed with mammalian tubulin, implying that 13 is not likely to exhibit antitubulin-mediated toxicity in mammalian cells.
CONCLUDING REMARKS
Three guanidinomethyl biaryl analogues have been synthesized and pharmacologically evaluated as FtsZ-targeting antibacterial agents. Regarded as a whole, the studies described herein highlight 13 as a lead compound with potent bactericidal activity against known MDR bacterial pathogens of acute clinical importance and reinforce the importance of FtsZ as a new antibacterial target yet to be exploited in the clinic. An important next step in the development of 13 and related biaryls into clinically useful agents will be an assessment of efficacy in appropriate in vivo models of infection.
EXPERIMENTAL SECTION
General Chemistry Methods
Column chromatography refers to flash chromatography conducted on disposable normal phase Teledyne ISCO columns with a CombiFlash Rf Teledyne ISCO using the solvent systems indicated. Proton and carbon nuclear magnetic resonance (1H and 13C NMR, respectively) were recorded using either a Bruker 400 MHz or a Varian 300 MHz Unity Inova spectrometer in the deuterated solvent indicated, with chemical shifts reported in δ units downfield from tetramethylsilane (TMS). Coupling constants are reported in hertz (Hz). 4-Chloro-6-methylpyrimidine and 4-chloropicolinaldehyde were obtained from Combi-Blocks, LLC. All other starting materials and reagents were obtained from Aldrich. Solvents were purchased from Fisher Scientific and were A.C.S. or HPLC grade. Methylene chloride was freshly distilled from calcium hydride. All other solvents were used as provided without further purification. All stock solutions of final compounds were prepared in DMSO and stored at −20 °C prior to their use in any experiment.
General Method A: Suzuki Coupling
A 100-mL round-bottom flask equipped with a magnetic stirrer, a condenser, and a nitrogen in/outlet adapter was charged with halogenated compounds (8.10 mmol), 4-tert-butylphenylboronic acid (1.93 g, 9.70 mmol), water/dioxane (10 mL/30 mL), and K2CO3 (2.23 g, 16.2 mmol). The resulting solution was degassed for 5 min, whereupon Pd(PPh3)4 (180 mg, 0.162 mmol) was added. The reaction mixture was warmed to 100 °C and stirred for 3 h. After cooling to room temperature, the reaction mixture was diluted with EtOAc (100 mL), washed with saturated NaHCO3 (30 mL) and brine (30 mL), and dried over Na2SO4. The organic layer was concentrated in a rotovapor and purified on silica gel. Elution with EtOAc/hexanes solvent system afforded the title compounds.
General Method B: Aldehyde Reduction
A 50-mL round-bottom flask equipped with a magnetic stirrer was charged with biarylcarbaldehyde (2.94 mmol) and ethanol (95%, 10 mL), and NaBH4 (112 mg, 2.94 mmol) was added in several portions. The reaction mixture was stirred at room temperature for 1 h. Acetone (1 mL) was added to the reaction mixture. After 20 min, the reaction mixture was concentrated, and the residue was partitioned between EtOAc (50 mL) and 1 N HCl (15 mL). The organic layer was washed with saturated NaHCO3 (15 mL) and brine (15 mL), dried over Na2SO4, concentrated in a rotovapor, and purified on silica gel. Elution with 10% EtOAc/hexanes afforded the reduced compounds in good yield.
General Method C: Preparation of Chlorides
A 25-mL round-bottom flask equipped with a magnetic stirrer under nitrogen was charged with alcohol (2.50 mmol), CH2Cl2 (10 mL), and triethylamine (0.70 mL, 5.00 mmol). Methanesulfonyl chloride (0.39 mL, 5.00 mmol) was added via a syringe over 5 min. The resulting reaction mixture was stirred at room temperature overnight. The reaction mixture was then diluted with CH2Cl2 (30 mL), washed with saturated NaHCO3 (15 mL) and brine (15 mL), dried over Na2SO4, concentrated in a rotovapor, and purified on silica gel. Elution with hexanes afforded the products as white solids.
General Method D: Reaction with Diboc-Guanidine
A 25-mL round-bottom flask equipped with a magnetic stirrer, a condenser, and a nitrogen in/outlet adapter was charged with chloro or bromomethyl intermediates (130 mg, 0.50 mmol), DMF (2 mL), K2CO3 (103 mg, 0.75 mmol), and 1,3-bis(tert-butoxycarbonyl)guanidine (143 mg, 0.55 mmol). The reaction mixture was stirred at 50 °C for 2 h. The reaction mixture was then diluted with EtOAc (40 mL), washed with water (10 mL), 10% LiCl (10 mL) and brine (10 mL), dried over Na2SO4, concentrated, and purified on silica gel. Elution with 5% EtOAc/hexanes afforded the title compounds as white solids.
General Method E: Diboc Deprotection
A 10-mL vial was charged with di-tert-butyl guanidine compounds (0.05 mmol), CH2Cl2 (1 mL), and TFA (1 mL). The sealed vial was stirred at room temperature overnight. The solvent was then removed, and the residue was purified on silica gel. Elution with MeOH:CHCl3:ammonium hydroxide (10:89:1) afforded the title compounds 13–15 as white solids. Compounds 13–15 were analyzed for purity by HPLC using a Shimadzu LC-20AT Prominence chromatograph equipped with a SPD-20A UV–vis detector monitoring absorbances at both 254 and 280 nm. Each compound was analyzed using a PrincetonSPHER-100 5-μm C18 reverse-phase column (150 mm × 4.6 mm), using gradients of 0.1% TFA in water with increasing percentages of either 0.1% TFA in acetonitrile or 0.1% TFA in methanol. Under both of these solvent conditions, each compound was eluted over 12 min, using a flow rate of 1.0 mL/min and a gradient ranging from 10% to 90%. The purity of each compound as determined by HPLC was found to be >95%.
Analytical Data. 4′-(tert-Butyl)-[1,1′-biphenyl]-3-carbaldehyde (4)
Prepared by general method A: white solid, mp = 48–50 °C; 1H NMR (300 MHz, CDCl3) δ: 10.12 (s, 1H), 8.13 (s, 1H), 7.88 (m, 2H), 7.63–7.52 (m, 5H), 1.40 (s, 9H). 13C NMR (75 MHz, CDCl3) δ: 151.4, 142.2, 137.2, 137.0, 133.2, 129.7, 128.6, 128.3, 127.0, 126.2, 34.9, 31.6.
4-(4-(tert-Butyl)phenyl)picolinaldehyde (5)
Prepared by general method A: oil; 1H NMR (300 MHz, CDCl3) δ: 10.15 (s, 1H), 8.81 (d, J = 6.0 Hz, 1H), 8.21 (d, J = 3.0 Hz, 1H), 7.74 (dd, J = 6.0, 3.0 Hz, 1H), 7.65 (m, 2H), 7.54 (m, 2H), 1.37 (s, 9H). 13C NMR (75 MHz, CDCl3) δ: 193.8, 153.8, 153.4, 150.8, 149.7, 134.2, 126.9, 126.5, 125.5, 119.5, 35.0, 31.4. HRMS calculated for C16H18NO (M + H)+, 240.1388; found, 240.1381.
4-(4-(tert-Butyl)phenyl)-6-methylpyrimidine (6)
Prepared by general method A: 1H NMR (300 MHz, CDCl3) δ: 9.12 (s, 1H), 8.03–7.99 (m, 2H), 7.56–7.50 (m, 3H), 2.58 (s, 3H), 1.36 (s, 9H). 13C NMR (75 MHz, CDCl3) δ: 167.5, 163.9, 158.9, 154.6, 134.1, 127.1, 126.2, 116.4, 35.1, 31.4, 24.6. HRMS calculated for C15H19N2 (M + H)+, 227.1548; found, 227.1537.
(4′-(tert-Butyl)-[1,1′-biphenyl]-3-yl)methanol
Prepared by general method B: white solid, mp = 52–54 °C; 1H NMR (400 MHz, CDCl3) δ: 7.69–7.35 (m, 8H), 4.81 (m, 2H), 1.40(s, 9H). 13C NMR (100 MHz, CDCl3) δ: 150.4, 141.4, 138.0, 128.9, 126.8, 126.3, 125.7, 65.5, 34.5, 31.4.
(4-(4-t-Butyl)phenyl)pyridin-2-yl)methanol
Prepared by general method B: white solid, mp = 103–105 °C; 1H NMR (300 MHz, CDCl3) δ: 8.57 (d, J = 3.0 Hz, 1H), 7.60 (d, J = 6.0 Hz, 2H), 7.58–7.41 (m, 4H), 4.83 (s, 2H), 1.37 (s, 9H). 13C NMR (75 MHz, CDCl3) δ: 149.1, 135.3, 126.9, 126.3, 120.6, 118.4, 64.6, 34.9, 31.5. HRMS calculated for C16H20NO (M + H)+, 242.1545; found, 242.1530.
4′-(tert-Butyl)-3-(chloromethyl)-1,1′-biphenyl (7)
Prepared by general method C: white solid, mp = 62–64 °C; 1H NMR (400 MHz, CDCl3) δ: 7.53–7.20 (m, 8H), 4.56 (s, 2H), 1.28 (s, 9H). 13C NMR (100 MHz), CDCl3) δ: 150.6, 141.7, 137.8, 129.1, 127.2, 126.8, 125.8, 46.3, 34.6, 31.8.
4-(4-(tert-Butyl)phenyl)2-(chloromethyl)pyridine (8)
Prepared by general method C: 1H NMR (300 MHz, CDCl3) δ: 8.60 (J = 6.0 Hz, 1H), 7.58–7.25 (m, 6H), 4.73 (s, 2H), 1.37 (s, 9H). 13C NMR (75 MHz, CDCl3) δ: 157.3, 152.9, 150.1, 149.7, 135.1, 127.0, 126.4, 121.1, 120.8, 47.1, 35.0, 31.5.
4-(Bromomethyl)-6-(4-(tert-butyl)phenyl)pyrimidine (9)
A mixture of 4-(4-(tert-butyl)phenyl)-6-methylpyrimidine (1 mmol) and NBS (1.3 mmol) in carbon tetrachloride (3.0 mL) was heated under light for 30 min. The solids were filtered, and the solvent was removed to give the crude product. Purification using 10% ethyl acetate in hexane afforded the product in 52% yield along with some dibrominated product. 1H NMR (300 MHz, CDCl3) δ: 9.19 (s, 1H), 8.04 (d, J = 6.0 Hz, 2H), 7.84 (s, 1H), 7.54 (d, J = 6.0 Hz, 2H), 4.5 (s, 2H), 1.37 (s, 9H).
1-((4′-(tert-Butyl)-[1,1′-biphenyl]-3-yl)methyl)-[1,3-bis(tert-Butoxycarbonyl)]guanidine (10)
Prepared by general method D: white solid, mp = 174–176 °C; 1H NMR (400 MHz, CDCl3) δ: 7.54 (m, 3H), 7.48 (m, 3H), 7.37 (t, J = 8.0 Hz, 1H), 7.22 (d, J = 8.0 Hz, 1H), 5.26 (s, 2H), 1.52 (s, 9H), 1.39 (s, 9H), 1.37 (s, 9H). 13C NMR (100 MHz, CDCl3) δ: 150. 3, 140.9, 139.3, 138.2, 128.5, 126.7, 125.8, 125.7, 125.6, 125.3, 84.0, 47.8, 34.5, 31.3, 28.3, 27.8.
1-((4-(4-(tert-Butyl)phenyl)pyridin-2-yl)methyl)-[1,3-bis(tert-butoxycarbonyl)]guanidine (11)
Prepared by general method D: white solid, mp = 65–69 °C; 1H NMR (300 MHz, CDCl3) δ: 9.5 (bs, 2H), 8.47 (d, J = 6.0 Hz, 1H), 7.50–7.42 (m, 4H), 7.3 (m, 2H), 5.4 (s, 2H), 1.47 (s, 9H), 1.36 (s, 9H), 1.25 (s, 9H). 13C NMR (75 MHz, CDCl3) δ: 163.8, 161.2, 159.3, 155.2, 152.6, 149.6, 148.8, 135.6, 126.9, 126.3, 119.9, 118.0, 84.2, 79.2, 49.7, 34.9, 31.5, 28.5, 28.3, 27.9.
1-((6-(4-(tert-Butyl)phenyl)pyrimidin-4-yl)methyl)-[1,3-bis(tert-butoxycarbonyl)]guanidine (12)
Prepared by general method D: white solid, mp = 152–154 °C; 1H NMR (300 MHz, CDCl3) δ: 9.54 (bs, 1H), 9.41 (bs, 1H), 9.16 (s, 1H), 8.01 (d, J = 5.4 Hz, 2H), 7.56–7.53 (m, 3H), 5.38 (s, 2H), 1.48 (s, 9H), 1.37 (s, 1H), 1.31 (s, 1H). 13C NMR (75 MHz, CDCl3) δ: 167.7, 164.1, 163.7, 160.8, 158.8, 154.9, 154.8, 134.0, 113.1, 84.7, 79.3, 49.0, 31.4, 28.5, 28.3, 27.8. HRMS calculated for C26H38N5O4 (M + H)+, 484.2924; found, 484.2908.
1-((4′-(tert-Butyl)-[1,1′-biphenyl]-3-yl)methyl)guanidine (13)
Preparation by general method E: white solid; mp = 134–136 °C; 1H NMR (300 MHz, CDCl3) δ: 7.38–7.35 (m, 6H), 7.15 (t, 1H), 7.06 (d, 1H), 4.1 (s, 2H), 1.28 (s, 9H). 13C NMR (75 MHz, CDCl3) δ: 158.4, 150.7, 141.6, 138.6, 138.0, 129.4, 127.0, 126.3, 125.9, 45.9, 34.7, 31.6. HRMS calculated for C18H24N3 (M + H)+, 282.1970; found, 282.1957.
1-((4-(4-(tert-Butyl)phenyl)pyridin-2-yl)methyl)guanidine (14)
Prepared by general method E: white solid, mp = 88–91 °C; 1H NMR (300 MHz, (CDCl3) δ: 8.32 (s, 1H), 7.45–7.20 (m, 7H), 6.43 (bs, 2H), 4.32 (s, 2H), 1.27 (s, 9H). 13C NMR (75 MHz, CDCl3) δ: 159.1, 157.2, 152.8, 149.7, 149.3, 134.5, 126.9, 126.3, 120.6, 120.4, 47.5, 34.9, 31.4. HRMS calculated for C17H23N4 (M + H)+, 283.1923; found, 283.1917.
1-((6-(4-(tert-Butyl)phenyl)pyrimidin-4-yl)methyl)guanidine (15)
Prepared by general method E: white solid, mp = 78–81 °C; 1H NMR (300 MHz, CDCl3) δ: 9.03 (s, 1H), 7.95 (d, J = 6.0 Hz, 2H), 7.69 (s, 1H), 7.43 (d, J = 6.0 Hz, 2H), 5.33 (bs, 2H), 4.36 (s, 2H), 1.29 (s, 9H). HRMS calculated for C16H22N5 (M + H)+, 284.1875; found, 284.1868.
Comparator Antibiotics and FtsZ Proteins from E. coli and E. faecalis
Vancomycin·HCl, ampicillin (sodium salt), neomycin·3H2SO4·3H20, erythromycin, clindamycin·HCl, oxacillin (sodium salt), and amikacin·2H2SO4 were obtained from Sigma-Aldrich Co. E. coli and E. faecalis FtsZ proteins were obtained from Cytoskeleton, Inc.
Expression and Purification of Wild-Type and Mutant S. aureus FtsZ
The ftsZ gene from S. aureus was amplified by polymerase chain reaction (PCR) from the S. aureus genome obtained from ATCC (ATCC 33591-D). The first primer used for PCR was designed to introduce a unique NdeI site at the 5′-end of the ftsZ gene, while the second primer was designed to introduce a unique EcoRI site at the 3′-end of the gene. The amplified gene product was digested with NdeI and EcoRI and ligated into the pET-22b(+) cloning vector (Novagen-EMD Chemicals, Inc.), which had been previously digested with the same enzymes. The sequence of the final recombinant plasmid (pETSaFtsZ) was verified by sequence analysis and was used to transform E. coli BL21 (DE3) cells.
A single colony of pETSAftsZ-transformed E. coli cells was used to inoculate Luria–Bertani media containing 100 μg/mL of ampicillin (LB-amp) and grown overnight at 37 °C. Twenty milliliters of the overnight culture was diluted into 4 L of LB-amp and grown until an optical density at 600 nm (OD600) of 0.4, at which point FtsZ production was induced by addition of isopropyl β-D-1-thiogalactopyr-anoside (IPTG) to a final concentration of 1 mM. Following addition of IPTG, the cultures were incubated for an additional 3 h at 37 °C. Cells were then harvested by centrifugation at 4 °C and 4000g in a swinging bucket Sorvall RC-3BP+ centrifuge with rotor H-6000 for 20 min. The bacterial cell pellet was washed with ice-cold 50 mM Tris·HCl (pH 8.0) and 0.5 M NaCl and repelleted by centrifugation as described above. The washed bacterial pellet was stored at −20 °C.
Approximately 15 g (wet weight) of cell pellet was resuspended in 40 mL of buffer containing 50 mM Tris·HCl (pH 8.0), 50 mM KCl, 1 mM EDTA, 1 mM EGTA, and 10% (v/v) glycerol (TKEGE buffer) to which 0.5 mM PMSF and EDTA-free Complete protease cocktail inhibitor was added, and the bacteria were lysed by sonication. The crude lysate was clarified into soluble and insoluble fractions by centrifugation in a Sorvall RC 6+ centrifuge using a F21S-8 × 50y rotor at 38 000g for 30 min at 4 °C. The soluble fraction was ultracentrifuged at 76 500g in a Beckman L8–70 M Ultracentrifuge for 90 min at 4 °C. The supernatant was transferred to a beaker, and solid ammonium sulfate was added to a final concentration of 45% (w/v) with stirring. The solution was centrifuged at 38 000g for 20 min at 4 °C and the 45% ammonium sulfate protein pellet collected. The pellet was dissolved in 20 mL of TKEGE buffer and dialyzed overnight against 2 L of TKEGE buffer.
The dialyzed material was loaded onto a MonoQ 10/100 anion exchange column at 1 mL/min and washed with 5 column volumes of TKEGE buffer at 1 mL/min. The column was eluted at 4 °C with a 0–60% (v/v) linear gradient (120 mL total volume) of the following two buffers: (i) TKEGE (containing 50 mM KCl) and (ii) TKEGE containing 1 M KCl instead of 50 mM KCl. The rate of elution was maintained at 1 mL/min. Fractions were assayed for FtsZ by SDS-PAGE analysis on a 10–15% Tris·HCl polyacrylamide gel. FtsZ elutes at 250–350 mM KCl. The FtsZ-containing fractions were pooled and dialyzed against 2 L of TKEGE buffer. The dialyzed fractions were concentrated, if necessary, to 5 mL and loaded onto a Superdex-200 size exclusion column, with TKEGE buffer as the running buffer at 0.25 mL/min. SaFtsZ-containing fractions were detected by SDS-PAGE as above. Peak fractions containing the pure SaFtsZ were pooled and concentrated using Amicon Ultra centrifugal filters (Millipore Corp.). Quantitation was performed spectrophotometrically at 595 nm using a Bio-Rad colorimetric protein assay kit and bovine serum albumin as the standard. Concentration of SaFtsZ was ~8 mg/mL and 90% pure by SDS-PAGE analysis.
The wild-type S. aureus FtsZ gene-expressing plasmid pETSaFtsZ was used to generate the mutant proteins using the QuikChange Site-Directed Mutagenesis Kit (Agilent Technologies) and appropriate primers. Once the sequences of the mutant-protein expressing plasmids were verified, they were each transformed into E. coli BL21 (DE3) bacteria, and the mutant proteins were purified using the protocol described above for purification of wild-type SaFtsZ.
Fluorescence Anisotropy Assays
All steady-state fluorescence anisotropy experiments were conducted at 25 °C on an AVIV Model ATF105 spectrofluorometer (Aviv Biomedical, Lakewood, NJ) equipped with a thermoelectrically controlled cell holder and computer-controlled Glan-Thompson polarizers in both the excitation and emission directions. A quartz ultramicro cell (Hellma, Inc.) with a 2 × 5 mm aperture and a 15 mm center height was used for all measurements. The pathlengths in the excitation and emissions directions were 1 and 0.2 cm, respectively. All anisotropy experiments were conducted in triplicate, with the reported anisotropies reflecting the average values.
Determination of Compound-FtsZ Binding Affinities
Test compound (5 μM) was combined with SaFtsZ, EcFtsZ, or EfFtsZ (at concentrations ranging from 0 to 25 μM) in 150 μL of solution containing 50 mM Tris·HCl (pH 7.4), 50 mM KCl, and 2 mM magnesium acetate. After incubation for 5 min at 25 °C, the fluorescence emission intensities (I) of the compound were measured with the excitation polarizer oriented vertically and the emission polarizer oriented vertically (IVV) or horizontally (IVH). Compound anisotropy (r) values were then determined using the following relationship:
| (2) |
G represents the instrument correction factor, and is given by the ratio of the fluorescence emission intensity acquired with the excitation polarizer oriented horizontally and the emission polarizer oriented vertically (IHV) to that acquired with both the excitation and emission polarizers oriented horizontally (IHH). A G value was measured at the start of each acquisition. The bandwidths were set at 5 nm in both the excitation and emission directions, with the excitation and emission wavelengths being set at 245 and 318 nm, respectively.
BoGTPγS Competition Assay
BoGTPγS (1 μM) (obtained from Life Technologies Corp. as the sodium salt in a 5 mM stock solution) was combined with 0 or 5 μM EcFtsZ or SaFtsZ and either 13 or GTP (at concentrations ranging from 0 to 40 μM) in 150 μL of solution containing 50 mM Tris·HCl (pH 7.4), 50 mM KCl, and 2 mM magnesium acetate. After incubation for 5 min at 25 °C, fluorescence anisotropies for BoGTPγS were determined as described above for 13, with the exception that the bandwidths were set at 4 nm in both the excitation and emission directions and the excitation and emission wavelengths were set at 488 and 510 nm, respectively.
FtsZ Polymerization Assay
Polymerization of SaFtsZ, EcFtsZ, and EfFtsZ as well as all mutant SaFtsZ proteins was monitored using a microtiter plate-based light-scattering assay in which changes in light scattering are reflected by corresponding changes in absorbance at 340 nm (A340). Test compound or comparator drug (at concentrations ranging from 0 to 40 μg/mL) were combined with 1 mM GTP and 10 μM FtsZ in 100 μL of reaction solution. Reaction solutions contained 50 mM Tris·HCl (pH 7.4), 50 mM KCl, 2 mM magnesium acetate, and either 1 mM CaCl2 (for the wild-type and mutant SaFtsZ experiments) or 10 mM CaCl2 (for the EcFtsZ and EfFtsZ experiments). Reactions were assembled in half-volume, flat-bottom, 96-well microtiter plates, and polymerization was continuously monitored at 25 °C by measuring A340 in a VersaMax plate reader (Molecular Devices, Inc.) over a time period of 400 min.
Transmission Electron Microscopy (EM)
At room temperature, SaFtsZ and EcFtsZ polymerization reaction solutions were diluted 1:10 in polymerization buffer, and 25-μL drops of the resulting dilutions were placed on glow-discharged, copper, 400 mesh, Formvar/carbon-coated grids. Excess solution was wicked away with filter paper. The grids were negatively stained with a solution of 1% phosphotungstic acid for 1 min and blotted dry. The grids were then digitally imaged at 80 kV on a Philips CM12 transmission microscope interfaced with an AMT XR111 camera.
Computational Studies
The Modeler program (version 9.10) was used to build the homology model of S. aureus FtsZ via the single template approach.61,62 The model was built from the sequence of S. aureus FtsZ [MRSA252] (protein accession no. YP_040573.1). A BLAST search of nonredundant PDB sequences clustered at 95% identity gave the crystal structure of B. subtilis FtsZ (PDB no. 2VXY)15 as the optimum template, with a sequence identity of 81% and a resolution of 1.7 Å. The homology model with the lowest DOPE score was selected, and the C-terminal residues from number 318 to the C-terminus were removed. Analysis of the model using PROCHECK revealed >95% of the residues to be in the most favored regions of the Ramachandran plot.63
All molecular docking studies were performed using the Autodock Vina (version 1.1.2) docking package.64 The ligand molecule was built using the Sybyl-X version 1.3 (Tripos, Inc.) software package. Each ligand model was refined via conjugate gradient energy minimization using the MMFF94 force field.65,66 The refined ligands and protein receptor model were converted to pdbqt format using Autodock Tools.67 Gasteiger–Hückel partial atomic charges were used for both the ligand and the protein receptor, although these partial atomic charges are not needed by Vina, because it uses an internal intermolecular energy scoring function based on Xscore.68 Vina uses the Iterated Local Search global optimizer method for orientation and conformer search of the ligands,64 with the receptor being kept rigid. Initial docking studies used a grid box dimensioned to cover the entire protein (56 Å × 54 Å × 58 Å) and a global search exhaustiveness of 15, with an energy range of 4 kcal/mol. Subsequent docking studies used a grid box approximately centered in a pocket between residues E305 and R29 and dimensioned to cover the entire pocket (32 Å × 20 Å × 22 Å). In these latter studies, an exhaustiveness of 10 was used for the global search, with an energy range of 4 kcal/mol.
Minimum Inhibitory Concentration (MIC) Assays
MIC assays were conducted in accordance with Clinical and Laboratory Standards Institute (CLSI) guidelines for broth microdilution.51 Briefly, log-phase bacteria were added to 96-well microtiter plates (at 105 CFU/mL) containing 2-fold serial dilutions of compound or comparator drug in cation-adjusted Mueller-Hinton (CAMH) broth at concentrations ranging from 64 to 0.016 μg/mL. The final volume in each well was 0.1 mL, and the microtiter plates were incubated aerobically for 24 h at 37 °C. Bacterial growth was then monitored by measuring OD600 using a VersaMax plate reader, with the MIC being defined as the lowest compound concentration at which growth was ≥90% inhibited. The following bacterial strains were included in these assays: S. aureus 8325-4 (MSSA from Dr. Glenn W. Kaatz, John D. Dingell VA Medical Center, Detroit, MI), S. aureus ATCC 49951 (mucoid MSSA), S. aureus ATCC 33591 (MRSA), S. aureus Mu3 (MRSA and hetero-GISA clinical isolate from Dr. George M. Eliopoulos, Beth Israel Deaconess Medical Center, Boston, MA), E. coli W4573 acrA+ and N43 acrA− (both from Dr. E. Lynn Zechiedrich, Baylor College of Medicine, Houston, TX), E. coli ATCC BAA-201 (ESBL-producing strain expressing the TEM-3 lactamase), S. pyogenes ATCC 19615, S. agalactiae ATCC 12386, E. faecalis ATCC 19433 (VSE), E. faecalis ATCC 51575 (VRE), B. subtilis ATCC 23857, A. baumannii ATCC 19606, K. pneumoniae ATCC 13883, and K. pneumoniae ATCC 700603 (ESBL-producing strain expressing the SHV-18 lactamase). CAMH broth was supplemented with 2% NaCl in the MRSA experiments, while being supplemented with 5% (v/v) defibrinated sheep’s blood (Becton Dickinson and Co.) in the S. pyogenes and S. agalactiae experiments.
Minimum Bactericidal Concentration (MBC) Assays
MBC assays were conducted using the broth microdilution assay described in the preceding section. After the 24 h incubation period, aliquots from the microtiter wells were plated onto tryptic soy agar (TSA). The colonies that grew after 24 h of incubation were counted using an Acolyte colony counter (Synbiosis, Inc.), with MBC being defined as the lowest compound concentration resulting in a ≥3-log reduction in the number of colony forming units (CFU).
Time–Kill Assays
Exponentially growing S. aureus 8325-4 bacteria were diluted in CAMH broth to a final count of 105 to 106 CFU/mL. The colony count at time zero was verified by plating serial dilutions of the culture in duplicate on TSA plates. The initial culture was aliquoted into tubes, each containing either a compound or comparator drug at final concentrations ranging from 0- to 16-times MIC. An equivalent volume of DMSO was added to the vehicle control tube. The cultures were then incubated at 37 °C with shaking. The CFU/mL in each culture was determined over time by withdrawing samples at 2, 4, and 6 h and plating appropriate serial dilutions onto TSA plates. To avoid the possibility of carry-over effects in instances when no dilutions were made of the cultures, the samples were centrifuged at 16 000g, the supernatant was removed, and the bacterial pellet was resuspended in an equal volume of media before plating. All TSA plates were incubated at 37 °C, and the CFU/mL at each time point was determined by counting colonies after 24 h.
Assays for the Emergence of Resistance
Assays for the emergence of resistance following prolonged compound exposure were conducted using both stepwise broth microdilution and large inoculum approaches. The stepwise broth microdilution approach assays for an upward drift in MIC values with repeated incubation cycles, while the large inoculum approach assays for the emergence of resistant colonies on agar plates containing test compounds at concentrations above the MIC value.
For the broth microdilution approach, microtiter plates containing 2-fold increasing concentrations of 13 or comparator drug (rifampicin) were inoculated with S. aureus 8325-4 bacteria (at 105 CFU/mL in 0.1 mL total volume). After 24 h of incubation at 37 °C, 75 μL aliquots from the wells containing the highest compound concentration and still showing bacterial growth (i.e., the well containing a compound concentration 2-fold lower than the MIC) were used to inoculate a new microtiter plate containing serial 2-fold compound dilutions, and the newly inoculated plates were incubated for 24 h at 37 °C. This procedure was repeated for multiple cycles.
For the large inoculum approach, TSA plates containing either 13 or rifampicin at concentrations ranging from 4- to 32-times MIC were prepared. A large inoculum of ~3 × 10⁹ CFU/mL S. aureus was spread onto each plate. The colony count of the inoculum was verified by plating serial dilutions of the culture onto nonselective TSA plates. All plates were incubated at 37 °C overnight and examined after 24 h and daily thereafter. Mutational frequency was calculated from the ratio of the number of colonies observed on the selective plates to the total number of plated bacteria.54
Tubulin Polymerization Assay
Polymerization of MAP-rich porcine β-tubulin containing 70% β-tubulin and 30% MAPs (Cytoskeleton, Inc.) was monitored using a microtiter plate-based light scattering assay similar to that described above for FtsZ polymerization. Test compound or comparator drug was combined with 1 mM GTP and 2 mg/mL porcine β-tubulin in 100 μL of reaction solution containing 80 mM PIPES·NaOH (pH 7.0), 2 mM MgCl2, and 1 mM EGTA. Reactions were assembled in half-volume, flat-bottom, 96-well microtiter plates, and polymerization was continuously monitored at 37 °C by measuring A340 in a VersaMax plate reader over a time period of 60 min.
Scheme 1.
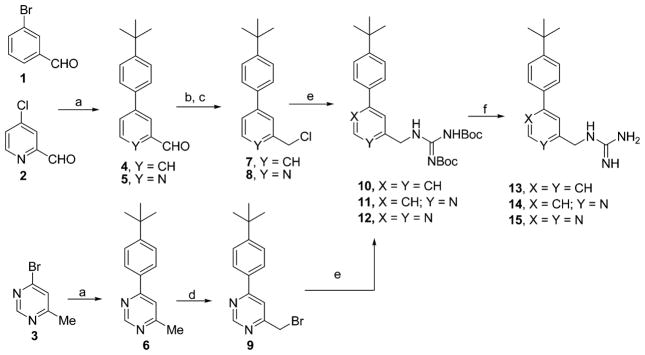
Methods Used in the Preparation of the Guanidinomethyl Biaryl Analogues 13–15a
aReagents and conditions: (a) 4-tert-Butylphenylboronic acid, Pd(PPh3)4, K2CO3, dioxane:H2O (3:1), 82–84%, (b) NaBH4, EtOH, 70–75%, (c) MsCl, Et3N, DCM, 90% (for 7) and 70% (for 8), (d) NBS, CCl4, light, 52%, (e) Diboc guanidine, DMF, K2CO3, quantitative, and (f) TFA:DCM (1:1), quantitative.
Acknowledgments
This study was supported by research agreements between TAXIS Pharmaceuticals, Inc., and both the University of Medicine and Dentistry of New Jersey (D.S.P.) and Rutgers, The State University of New Jersey (E.J.L.). S. aureus 8325-4 was a gift from Dr. Glenn W. Kaatz (John D. Dingell VA Medical Center, Detroit, MI), S. aureus Mu3 was a gift from Dr. George M. Eliopoulos (Beth Israel Deaconess Medical Center, Boston, MA), and E. coli strains W4573 and N43 were gifts from Dr. E. Lynn Zechiedrich (Baylor College of Medicine, Houston, TX). We thank Raj Patel (UMDNJ-RWJMS, Core Imaging Lab) for his assistance with the acquisition and analysis of the EM data. The Bruker Avance III 400 MHz NMR spectrometer used in this study was purchased with funds from NCRR grant no. 1S10RR23698-1A1. Mass spectrometry was provided by the Washington University Mass Spectrometry Resource with support from the NIH National Center for Research Resources grant no. P41RR0954.
ABBREVIATIONS USED
- MRSA
methicillin-resistant Staphylococcus aureus
- MSSA
methicillin-sensitive Staphylococcus aureus
- GISA
glycopeptide intermediate Staphylococcus aureus
- VSE
vancomycin-sensitive Enterococcus
- VRE
vancomycin-resistant Enterococcus
- S. aureus
Staphylococcus aureus
- E. faecalis
Enterococcus faecalis
- E. coli
Escherichia coli
- B. subtilis
Bacillus subtilis
- A. baumannii
Acinetobacter baumannii
- K. pneumoniae
Klebsiella pneumoniae
- S. pyogenes
Streptococcus pyogenes
- S. agalactiae
Streptococcus agalactiae
- ESBL
extended spectrum β-lactamase
- MDR
multidrug-resistant
- MIC
minimum inhibitory concentration
- MBC
minimum bactericidal concentration
- SaFtsZ
Staphylococcus aureus FtsZ
- EcFtsZ
Escherichia coli FtsZ
- EfFtsZ
Enterococcus faecalis FtsZ
- Strep A
Streptococcus A
- Strep B
Streptococcus B
- BoGTPγS
boron-dipyrromethene-conjugated GTPγS
- A340
absorbance at 340 nm
- ClogP
calculated log(partition coefficient)
- ATCC
American Type Culture Collection
- CFU
colony forming units
- TSA
tryptic soy agar
- CLSI
Clinical and Laboratory Standards Institute
- CAMH
cation-adjusted Mueller–Hinton
- MAP
microtubule-associated protein
- EM
electron microscopy
Footnotes
NOTE
The authors declare the following competing financial interest(s): Drs. Pilch and LaVoie are cofounders of TAXIS Pharmaceuticals and therefore have a financial interest in the company.
NOTE ADDED IN PROOF
In the time since this work was conducted, crystal structures of Staphylococcus aureus FtsZ in the absence and presence of PC190723 have been reported in the following references: Tan, C. M. et al. Restoring Methicillin-Resistant Staphylococcus aureus Susceptibility to β-Lactam Antibiotics. Science Transl. Med. 2012, 4, 126ra35. Matsui, T.; Yamane, J.; Mogi, N.; Yamaguchi, H.; Takemoto, H.: Yao, M.; Tanaka, I. Structcural Reorganization of the Bacterial Cell-Division Protein FtsZ from Staphylococcus aureus. Acta Crystal. 2012, D68, 1175–1188.
References
- 1.Rice LB. Antimicrobial Resistance in Gram-Positive Bacteria. Am J Med. 2006;119(6, Supplement1):S11–S19. doi: 10.1016/j.amjmed.2006.03.012. [DOI] [PubMed] [Google Scholar]
- 2.Cornaglia G. Fighting Infections Due to Multidrug-Resistant Gram-Positive Pathogens. Clin Microbiol Infect. 2009;15:209–211. doi: 10.1111/j.1469-0691.2009.02737.x. [DOI] [PubMed] [Google Scholar]
- 3.Cornaglia G, Rossolini GM. Forthcoming Therapeutic Perspectives for Infections Due to Multidrug-Resistant Gram-Positive Pathogens. Clin Microbiol Infect. 2009;15:218–223. doi: 10.1111/j.1469-0691.2009.02740.x. [DOI] [PubMed] [Google Scholar]
- 4.Leclercq R. Epidemiological and Resistance Issues in Multidrug-Resistant Staphylococci and Enterococci. Clin Microbiol Infect. 2009;15:224–231. doi: 10.1111/j.1469-0691.2009.02739.x. [DOI] [PubMed] [Google Scholar]
- 5.Arias CA, Murray BE. Antibiotic-Resistant Bugs in the 21st Century–A Clinical Super-Challenge. New Engl J Med. 2009;360:439–443. doi: 10.1056/NEJMp0804651. [DOI] [PubMed] [Google Scholar]
- 6.Kumarasamy KK, Toleman MA, Walsh TR, Bagaria J, Butt F, Balakrishnan R, Chaudhary U, Doumith M, Giske CG, Irfan S, Krishnan P, Kumar AV, Maharjan S, Mushtaq S, Noorie T, Paterson DL, Pearson A, Perry C, Pike R, Rao B, Ray U, Sarma JB, Sharma M, Sheridan E, Thirunarayan MA, Turton J, Upadhyay S, Warner M, Welfare W, Livermore DM, Woodford N. Emergence of a New Antibiotic Resistance Mechanism in India, Pakistan, and the UK: a Molecular, Biological, and Epidemiological Study. Lancet Infect Dis. 2010;10:597–602. doi: 10.1016/S1473-3099(10)70143-2. [DOI] [PMC free article] [PubMed] [Google Scholar]
- 7.Livermore DM. Has the Era of Untreatable Infections Arrived? J Antimicrob Chemother. 2009;64(suppl 1):i29–i36. doi: 10.1093/jac/dkp255. [DOI] [PubMed] [Google Scholar]
- 8.Snitkin ES, Zelazny AM, Thomas PJ, Stock F, Henderson DK, Palmore TN, Segre JA. Tracking a Hospital Outbreak of Carbapenem-Resistant Klebsiella pneumoniae with Whole-Genome Sequencing. Sci Transl Med. 2012;4:148ra116. doi: 10.1126/scitranslmed.3004129. [DOI] [PMC free article] [PubMed] [Google Scholar]
- 9.Lock RL, Harry EJ. Cell-Division Inhibitors: New Insights for Future Antibiotics. Nat Rev Drug Discovery. 2008;7:324–338. doi: 10.1038/nrd2510. [DOI] [PubMed] [Google Scholar]
- 10.Läppchen T, Hartog AF, Pinas VA, Koomen GJ, den Blaauwen T. GTP Analogue Inhibits Polymerization and GTPase Activity of the Bacterial Protein FtsZ without Affecting its Eukaryotic Homologue Tubulin. Biochemistry. 2005;44:7879–7884. doi: 10.1021/bi047297o. [DOI] [PubMed] [Google Scholar]
- 11.Wang J, Galgoci A, Kodali S, Herath KB, Jayasuriya H, Dorso K, Vicente F, Gonzalez A, Cully D, Bramhill D, Singh S. Discovery of a Small Molecule that Inhibits Cell Division by Blocking FtsZ, a Novel Therapeutic Target of Antibiotics. J Biol Chem. 2003;278:44424–44428. doi: 10.1074/jbc.M307625200. [DOI] [PubMed] [Google Scholar]
- 12.Margalit DN, Romberg L, Mets RB, Hebert AM, Mitchison TJ, Kirschner MW, RayChaudhuri D. Targeting Cell Division: Small-Molecule Inhibitors of FtsZ GTPase Perturb Cytokinetic Ring Assembly and Induce Bacterial Lethality. Proc Natl Acad Sci US A. 2004;101:11821–11826. doi: 10.1073/pnas.0404439101. [DOI] [PMC free article] [PubMed] [Google Scholar]
- 13.Urgaonkar S, La Pierre HS, Meir I, Lund H, RayChaudhuri D, Shaw JT. Synthesis of Antimicrobial Natural Products Targeting FtsZ: (±)-Dichamanetin and (±)-2‴-hydroxy-5″-benzylisouvarinol-B. Org Lett. 2005;7:5609–5612. doi: 10.1021/ol052269z. [DOI] [PMC free article] [PubMed] [Google Scholar]
- 14.Stokes NR, Sievers J, Barker S, Bennett JM, Brown DR, Collins I, Errington VM, Foulger D, Hall M, Halsey R, Johnson H, Rose V, Thomaides HB, Haydon DJ, Czaplewski LG, Errington J. Novel Inhibitors of Bacterial Cytokinesis Identified by a Cell-Based Antibiotic Screening Assay. J Biol Chem. 2005;280:39709–39715. doi: 10.1074/jbc.M506741200. [DOI] [PubMed] [Google Scholar]
- 15.Haydon DJ, Stokes NR, Ure R, Galbraith G, Bennett JM, Brown DR, Baker PJ, Barynin VV, Rice DW, Sedelnikova SE, Heal JR, Sheridan JM, Aiwale ST, Chauhan PK, Srivastava A, Taneja A, Collins I, Errington J, Czaplewski LG. An Inhibitor of FtsZ with Potent and Selective Anti-Staphylococcal Activity. Science. 2008;321:1673–1675. doi: 10.1126/science.1159961. [DOI] [PubMed] [Google Scholar]
- 16.Reynolds RC, Srivastava S, Ross LJ, Suling WJ, White EL. A New 2-Carbamoyl Pteridine that Inhibits Mycobacterial FtsZ. Bioorg Med Chem Lett. 2004;14:3161–3164. doi: 10.1016/j.bmcl.2004.04.012. [DOI] [PubMed] [Google Scholar]
- 17.Huang Q, Kirikae F, Kirikae T, Pepe A, Amin A, Respicio L, Slayden RA, Tonge PJ, Ojima I. Targeting FtsZ for Antituberculosis Drug Discovery: Noncytotoxic Taxanes as Novel Antituberculosis Agents. J Med Chem. 2006;49:463–466. doi: 10.1021/jm050920y. [DOI] [PMC free article] [PubMed] [Google Scholar]
- 18.Mukherjee S, Robinson CA, Howe AG, Mazor T, Wood PA, Urgaonkar S, Hebert AM, Raychaudhuri D, Shaw JT. N-Benzyl-3-sulfonamidopyrrolidines as novel inhibitors of cell division in E. coli. Bioorg Med Chem Lett. 2007;17:6651–6655. doi: 10.1016/j.bmcl.2007.09.010. [DOI] [PMC free article] [PubMed] [Google Scholar]
- 19.Czaplewski LG, Collins I, Boyd EA, Brown D, East SP, Gardiner M, Fletcher R, Haydon DJ, Henstock V, Ingram P, Jones C, Noula C, Kennison L, Rockley C, Rose V, Thomaides-Brears HB, Ure R, Whittaker M, Stokes NR. Antibacterial Alkoxybenzamide Inhibitors of the Essential Bacterial Cell Division Protein FtsZ. Bioorg Med Chem Lett. 2009;19:524–527. doi: 10.1016/j.bmcl.2008.11.021. [DOI] [PubMed] [Google Scholar]
- 20.Beuria TK, Santra MK, Panda D. Sanguinarine Blocks Cytokinesis in Bacteria by Inhibiting FtsZ Assembly and Bundling. Biochemistry. 2005;44:16584–16593. doi: 10.1021/bi050767+. [DOI] [PubMed] [Google Scholar]
- 21.Domadia PN, Bhunia A, Sivaraman J, Swarup S, Dasgupta D. Berberine Targets Assembly of Escherichia coli Cell Division Protein FtsZ. Biochemistry. 2008;47:3225–3234. doi: 10.1021/bi7018546. [DOI] [PubMed] [Google Scholar]
- 22.Schaffner-Barbero C, Martin-Fontecha M, Chacón P, Andreu JM. Targeting the Assembly of Bacterial Cell Division Protein FtsZ with Small Molecules. ACS Chem Biol. 2012;7:269–277. doi: 10.1021/cb2003626. [DOI] [PubMed] [Google Scholar]
- 23.Ma S. The Development of FtsZ Inhibitors As Potential Antibacterial Agents. ChemMedChem. 2012;7:1161–1172. doi: 10.1002/cmdc.201200156. [DOI] [PubMed] [Google Scholar]
- 24.Haydon DJ, Bennett JM, Brown D, Collins I, Galbraith G, Lancett P, Macdonald R, Stokes NR, Chauhan PK, Sutariya JK, Nayal N, Srivastava A, Beanland J, Hall R, Henstock V, Noula C, Rockley C, Czaplewski L. Creating an Antibacterial with in Vivo Efficacy: Synthesis and Characterization of Potent Inhibitors of the Bacterial Cell Division Protein FtsZ with Improved Pharmaceutical Properties. J Med Chem. 2010;53:3927–3936. doi: 10.1021/jm9016366. [DOI] [PMC free article] [PubMed] [Google Scholar]
- 25.Andreu JM, Schaffner-Barbero C, Huecas S, Alonso D, Lopez-Rodriguez ML, Ruiz-Avila LB, Núñez-Ramírez R, Llorca O, Martín-Galiano AJ. The Antibacterial Cell Division Inhibitor PC190723 Is an FtsZ Polymer-Stabilizing Agent That Induces Filament Assembly and Condensation. J Biol Chem. 2010;285:14239–14246. doi: 10.1074/jbc.M109.094722. [DOI] [PMC free article] [PubMed] [Google Scholar]
- 26.Boberek JM, Stach J, Good L. Genetic Evidence for Inhibition of Bacterial Division Protein FtsZ by Berberine. PLoS One. 2010;5:e13745. doi: 10.1371/journal.pone.0013745. [DOI] [PMC free article] [PubMed] [Google Scholar]
- 27.Awasthi D, Kumar K, Ojima I. Therapeutic Potential of FtsZ Inhibition: A Patent Perspective. Expert Opin Ther Pat. 2011;21:657–679. doi: 10.1517/13543776.2011.568483. [DOI] [PubMed] [Google Scholar]
- 28.Huang Q, Tonge PJ, Slayden RA, Kirikae T, Ojima I. tsZ: A Novel Target for Tuberculosis Drug Discovery. Curr Top Med Chem. 2007;7:527–543. doi: 10.2174/156802607780059790. [DOI] [PubMed] [Google Scholar]
- 29.Kumar K, Awasthi D, Berger WT, Tonge PJ, Slayden RA, Ojima I. Discovery of Anti-TB Agents That Target the Cell-Division Protein FtsZ. Future Med Chem. 2010;2:1305–1323. doi: 10.4155/fmc.10.220. [DOI] [PMC free article] [PubMed] [Google Scholar]
- 30.Kumar K, Awasthi D, Lee SY, Zanardi I, Ruzsicska B, Knudson S, Tonge PJ, Slayden RA, Ojima I. Novel Trisubstituted Benzimidazoles, Targeting Mtb FtsZ, as a New Class of Antitubercular Agents. J Med Chem. 2011;54:374–381. doi: 10.1021/jm1012006. [DOI] [PMC free article] [PubMed] [Google Scholar]
- 31.Kapoor S, Panda D. Targeting FtsZ for Antibacterial Therapy: A Promising Avenue. Expert Opin Ther Targets. 2009;13:1037–1051. doi: 10.1517/14728220903173257. [DOI] [PubMed] [Google Scholar]
- 32.Bi EF, Lutkenhaus J. FtsZ Ring Structure Associated with Division in Escherichia coli. Nature. 1991;354:161–164. doi: 10.1038/354161a0. [DOI] [PubMed] [Google Scholar]
- 33.Goehring NW, Beckwith J. Diverse Paths to Midcell: Assembly of the Bacterial Cell Division Machinery. Curr Biol. 2005;15:R514–R526. doi: 10.1016/j.cub.2005.06.038. [DOI] [PubMed] [Google Scholar]
- 34.Errington J, Daniel RA, Scheffers DJ. Cytokinesis in Bacteria. Microbiol Mol Biol Rev. 2003;67:52–65. doi: 10.1128/MMBR.67.1.52-65.2003. [DOI] [PMC free article] [PubMed] [Google Scholar]
- 35.Adams DW, Errington J. Bacterial Cell Division: Assembly, Maintenance and Disassembly of the Z ring. Nat Rev Microbiol. 2009;7:642–653. doi: 10.1038/nrmicro2198. [DOI] [PubMed] [Google Scholar]
- 36.Erickson HP, Anderson DE, Osawa M. FtsZ in Bacterial Cytokinesis: Cytoskeleton and Force Generator All in One. Microbiol Mol Biol Rev. 2010;74:504–528. doi: 10.1128/MMBR.00021-10. [DOI] [PMC free article] [PubMed] [Google Scholar]
- 37.Parhi A, Kelley C, Kaul M, Pilch DS, LaVoie EJ. Antibacterial Activity of Substituted 5-Methylbenzo[c]-phenanthridinium Derivatives. Bioorg Med Chem Lett. 2012 doi: 10.1016/j.bmcl.2012.09.097. in press. [DOI] [PMC free article] [PubMed] [Google Scholar]
- 38.Parhi A, Lu S, Kelley C, Kaul M, Pilch DS, LaVoie EJ. Antibacterial Activity of Substituted Dibenzo[a,g]quinolizin-7-ium Derivatives. Bioorg Med Chem Lett. 2012;22:6962–6966. doi: 10.1016/j.bmcl.2012.08.123. [DOI] [PMC free article] [PubMed] [Google Scholar]
- 39.Chambers HF. Protein Synthesis Inhibitors and Miscellaneous Antibacterial Agents. In: Brunton LL, Lazo JS, Parker KL, editors. Goodman & Gilman’s The Pharmacological Basis of Therapeutics. 11. McGraw-Hill; New York: 2006. pp. 1173–1202. [Google Scholar]
- 40.Petri WA., Jr . Penicillins, Cephalosporins, and Other β-Lactam Antibiotics. In: Brunton LL, Lazo JS, Parker KL, editors. Goodman & Gilman’s The Pharmacological Basis of Therapeutics. 11. McGraw-Hill; New York: 2006. pp. 1127–1154. [Google Scholar]
- 41.Löwe J, Amos LA. Crystal Structure of the Bacterial Cell-Division Protein FtsZ. Nature. 1998;391:203–206. doi: 10.1038/34472. [DOI] [PubMed] [Google Scholar]
- 42.Löwe J, van den Ent F, Amos LA. Molecules of the Bacterial Cytoskeleton. Annu Rev Biophys Biomol Struct. 2004;33:177–198. doi: 10.1146/annurev.biophys.33.110502.132647. [DOI] [PubMed] [Google Scholar]
- 43.Oliva MA, Cordell SC, Löwe J. Structural Insights into FtsZ Protofilament Formation. Nat Struct Mol Biol. 2004;11:1243–1250. doi: 10.1038/nsmb855. [DOI] [PubMed] [Google Scholar]
- 44.Oliva MA, Trambaiolo D, Löwe J. Structural Insights into the Conformational Variability of FtsZ. J Mol Biol. 2007;373:1229–1242. doi: 10.1016/j.jmb.2007.08.056. [DOI] [PubMed] [Google Scholar]
- 45.Cunnion KM, Lee JC, Frank MM. Capsule Production and Growth Phase Influence Binding of Complement to Staphylococcus aureus. Infect Immun. 2001;69:6796–6803. doi: 10.1128/IAI.69.11.6796-6803.2001. [DOI] [PMC free article] [PubMed] [Google Scholar]
- 46.Hiramatsu K, Aritaka N, Hanaki H, Kawasaki S, Hosoda Y, Hori S, Fukuchi Y, Kobayashi I. Dissemination in Japanese Hospitals of Strains of Staphylococcus aureus Heterogeneously Resistant to Vancomycin. Lancet. 1997;350:1670–1673. doi: 10.1016/S0140-6736(97)07324-8. [DOI] [PubMed] [Google Scholar]
- 47.Yang S, Clayton SR, Zechiedrich EL. Relative Contributions of the AcrAB, MdfA and NorE Efflux Pumps to Quinolone Resistance in Escherichia coli. J Antimicrob Chemother. 2003;51:545–556. doi: 10.1093/jac/dkg126. [DOI] [PubMed] [Google Scholar]
- 48.Pagès JM, Masi M, Barbe J. Inhibitors of Efflux Pumps in Gram-Negative Bacteria. Trends Mol Med. 2005;11:382–389. doi: 10.1016/j.molmed.2005.06.006. [DOI] [PubMed] [Google Scholar]
- 49.Nikaido H, Takatsuka Y. Mechanisms of RND Multidrug Efflux Pumps. Biochim Biophys Acta: Proteins Proteomics. 2009;1794:769–781. doi: 10.1016/j.bbapap.2008.10.004. [DOI] [PMC free article] [PubMed] [Google Scholar]
- 50.Chambers HF. Aminoglycosides and Spectinomycin. In: Katzung BG, editor. Basic and Clinical Pharmacology. 9. McGraw-Hill; New York: 2004. pp. 764–772. [Google Scholar]
- 51.CLSI. Methods for Dilution Antimicrobial Sucseptibility Tests for Bacteria That Grow Aerobically. 8. Clinical and Laboratory Standards Institute; Wayne, PA: 2009. [Google Scholar]
- 52.Simon GL, Smith RH, Sande MA. Emergence of Rifampin-Resistant Strains of Staphylococcus aureus during Combination Therapy with Vancomycin and Rifampin: A Report of Two Cases. Clin Infect Dis. 1983;5(Suppl 3):S507–S508. doi: 10.1093/clinids/5.supplement_3.s507. [DOI] [PubMed] [Google Scholar]
- 53.Wichelhaus TA, Boddinghaus B, Besier S, Schafer V, Brade V, Ludwig A. Biological Cost of Rifampin Resistance from the Perspective of Staphylococcus aureus. Antimicrob Agents Chemother. 2002;46:3381–3385. doi: 10.1128/AAC.46.11.3381-3385.2002. [DOI] [PMC free article] [PubMed] [Google Scholar]
- 54.O’Neill AJ, Cove JH, Chopra I. Mutation Frequencies for Resistance to Fusidic Acid and Rifampicin in Staphylococcus aureus. J Antimicrob Chemother. 2001;47:647–650. doi: 10.1093/jac/47.5.647. [DOI] [PubMed] [Google Scholar]
- 55.Erickson HP. FtsZ, a Prokaryotic Homolog of Tubulin? Cell. 1995;80:367–370. doi: 10.1016/0092-8674(95)90486-7. [DOI] [PubMed] [Google Scholar]
- 56.Romberg L, Simon M, Erickson HP. Polymerization of FtsZ, a Bacterial Homolog of Tubulin: Is Assembly Cooperative? J Biol Chem. 2001;276:11743–11753. doi: 10.1074/jbc.M009033200. [DOI] [PubMed] [Google Scholar]
- 57.Carlier MF, Pantaloni D. Taxol Effect on Tubulin Polymerization and Associated Guanosine 5′-Triphosphate Hydrolysis. Biochemistry. 1983;22:4814–4822. doi: 10.1021/bi00289a031. [DOI] [PubMed] [Google Scholar]
- 58.Kumar N. Taxol-Induced Polymerization of Purified Tubulin. Mechanism of Action. J Biol Chem. 1981;256:10435–10441. [PubMed] [Google Scholar]
- 59.Löwe J, Li H, Downing KH, Nogales E. Refined Structure of Alpha Beta-Tubulin at 3.5 Å Resolution. J Mol Biol. 2001;313:1045–1057. doi: 10.1006/jmbi.2001.5077. [DOI] [PubMed] [Google Scholar]
- 60.Lin CM, Hamel E. Effects of Inhibitors of Tubulin Polymerization on GTP Hydrolysis. J Biol Chem. 1981;256:9242–9245. [PubMed] [Google Scholar]
- 61.Marti-Renom MA, Stuart AC, Fiser A, Sanchez R, Melo F, Sali A. Comparative Protein Structure Modeling of Genes and Genomes. Annu Rev Biophys Biomol Struct. 2000;29:291–325. doi: 10.1146/annurev.biophys.29.1.291. [DOI] [PubMed] [Google Scholar]
- 62.Sanchez R, Sali A. Comparative Protein Structure Modeling. Introduction and Practical Examples with Modeller. Methods Mol Biol. 2000;143:97–129. doi: 10.1385/1-59259-368-2:97. [DOI] [PubMed] [Google Scholar]
- 63.Laskowski RA, MacArthur MW, Moss DS, Thornton JM. PROCHECK: A Program to Check the Stereochemical Quality of Protein Structures. J Appl Crystallogr. 1993;26:283–291. [Google Scholar]
- 64.Trott O, Olson AJ. AutoDock Vina: Improving the Speed and Accuracy of Docking with a New Scoring Function, Efficient Optimization, and Multithreading. J Comput Chem. 2010;31:455–461. doi: 10.1002/jcc.21334. [DOI] [PMC free article] [PubMed] [Google Scholar]
- 65.Halgren TA. Merck Molecular Force Field. I. Basis, Form, Scope, Parameterization, and Performance of MMFF94. J Comput Chem. 1996;17:490–519. [Google Scholar]
- 66.Halgren TA, Nachbar RB. Merck Molecular Force Field. IV. Conformational Energies and Geometries for MMFF94. J Comput Chem. 1996;17:587–615. [Google Scholar]
- 67.Morris GM, Huey R, Lindstrom W, Sanner MF, Belew RK, Goodsell DS, Olson AJ. AutoDock4 and AutoDockTools4: Automated Docking with Selective Receptor Flexibility. J Comput Chem. 2009;30:2785–2791. doi: 10.1002/jcc.21256. [DOI] [PMC free article] [PubMed] [Google Scholar]
- 68.Wang R, Lai L, Wang S. Further Development and Validation of Empirical Scoring Functions for Structure-Based Binding Affinity Prediction. J Comput-Aided Mol Des. 2002;16:11–26. doi: 10.1023/a:1016357811882. [DOI] [PubMed] [Google Scholar]