

Abstract
Melatonin is a ubiquitous molecule and exists across kingdoms including plant species. Studies on melatonin in plants have mainly focused on its physiological influence on growth and development, and on its biosynthesis. Much less attention has been drawn to its affect on genome-wide gene expression. To comprehensively investigate the role(s) of melatonin at the genomics level, we utilized mRNA-seq technology to analyze Arabidopsis plants subjected to a 16-hour 100 pM (low) and 1 mM (high) melatonin treatment. The expression profiles were analyzed to identify differentially expressed genes. 100 pM melatonin treatment significantly affected the expression of only 81 genes with 51 down-regulated and 30 up-regulated. However, 1 mM melatonin significantly altered 1308 genes with 566 up-regulated and 742 down-regulated. Not all genes altered by low melatonin were affected by high melatonin, indicating different roles of melatonin in regulation of plant growth and development under low and high concentrations. Furthermore, a large number of genes altered by melatonin were involved in plant stress defense. Transcript levels for many stress receptors, kinases, and stress-associated calcium signals were up-regulated. The majority of transcription factors identified were also involved in plant stress defense. Additionally, most identified genes in ABA, ET, SA and JA pathways were up-regulated, while genes pertaining to auxin responses and signaling, peroxidases, and those associated with cell wall synthesis and modifications were mostly down-regulated. Our results indicate critical roles of melatonin in plant defense against various environmental stresses, and provide a framework for functional analysis of genes in melatonin-mediated signaling pathways.
Introduction
Melatonin (N-acetyl-5-methoxytryptamine) is a versatile molecule that, since its 1958 discovery in bovine pineal glands [1], has been found across kingdom lines including bacteria, fungi, and plants [2]–[5]. Its numerous and diverse functions include regulating circadian rhythms and seasonal reproduction cycles, promoting sleep, preventing diabetes, attenuating cancer cell proliferation, and enhancing immunity [6]–[10]. Melatonin has also been characterized as a potent antioxidant capable of scavenging reactive oxygen species (ROS) and reactive nitrogen species (RNS) [11]–[14].
Since the relatively recent discovery of melatonin in plants, investigations to elucidate its function in plants has been driven by what is known in animals. One such area of focus is the involvement of melatonin in modulating circadian rhythms and photoperiod-dependent processes. While melatonin levels do appear to be affected by light/dark cycles in some plants, the pattern varies among species, tissues, and organs [15]–[21]. The nocturnal peak of melatonin characteristic of humans and animals has been observed in Chenopodium rubrum [16], grape skins [17] and Ulva sp [21]. Conversely, studies conducted in water hyacinth demonstrated a peak in melatonin levels late in the day [19], indicating its biosynthesis in light. Furthermore, melatonin biosynthesis occurred under constant light in senescent rice leaves and was nearly undetectable under constant darkness [22]. Other reports found no significant correlation with melatonin levels and day/night cycles [18]. Interestingly, developing sweet cherries exhibited a dual peak of melatonin levels, one nocturnal and one in late day [20]. Contradicting reports of melatonin levels in ripening fruits add to the variation observed among plant species; melatonin levels decreased in ripening cherries [20], but increased in ripening tomatoes [18]. The possible role of melatonin in regulating flowering has also been investigated [23]–[25]; however an unequivocal role of melatonin in photoperiod-dependent processes in plants has not yet been established
Melatonin has been studied extensively as an antioxidant in mammals. Many studies demonstrate the ability of melatonin to protect against many human diseases, including those linked to oxidative stress [26]–[27]. Melatonin was able to attenuate paraquat-induced lung and liver damage in rats [28]–[29] and Parkinson's disease in mice [30]. Furthermore, exogenously applied melatonin can enhance the production of antioxidative enzymes such as glutathione peroxidase and superoxide dismutase [31]. Melatonin may similarly play a protective role against oxidative stress in plants. Oxidative stress is capable of inducing elevated melatonin levels in various plant species [17], [32]–[34]. Indeed, the daytime peak of melatonin levels found in sweet cherry was associated with high temperature and light intensity, suggesting melatonin was synthesized in response to oxidative stress [17]. Transgenic rice seedlings with elevated levels of melatonin were more resistant to herbicide induced oxidative stress than their wild type counterparts [35]. Furthermore, oxidative stress induced the expression of genes involved in melatonin biosynthesis, leading to increased melatonin production in both wild type and transgenic rice [35]. Melatonin also appears to protect plants against UV and ozone damage [36]–[40], attenuate photo-oxidation of the photosynthetic system, and, at moderate levels, protect chlorophyll during senescence [39]–[42]. In addition, melatonin can promote low temperature and osmotic stress tolerance [43]–[48], alleviate copper damage [49]–[50], and improve salt tolerance [51] and fungal disease resistance [52] in a diversity of plant species.
The structure of melatonin is another feature that has driven investigations into its function in plants. Melatonin is structurally similar to the plant hormone indole-3-acetic acid (IAA) and has many features that make it a candidate for a functional auxin [53]–[54]. In addition, melatonin and auxin biosynthetic pathways share the same precursor, tryptophan [55]. Since auxins play critical roles as growth regulators during plant development such as shoot elongation, lateral root formation, and cell expansion, much work has focused on the effect of melatonin on these processes [42], [48], [56]–[63]. Investigations have shown that melatonin and its precursor serotonin affect root growth in a dose-dependent manner similar to auxin [56]–[60]. At low melatonin levels, lateral root growth is stimulated, while at higher levels, adventitious root formation occurs and lateral root growth is inhibited in a mechanism seemingly independent of auxin [64]. Furthermore, melatonin has been demonstrated to stimulate expansion of etiolated lupin cotyledons [62] and promote hypocotyl growth [61], [63] similar to IAA. It is still unknown whether the auxin-like affects are due to the action of melatonin itself or if melatonin is converted into IAA [64]. Moreover, while mammalian systems have well documented receptor-mediated gene expression, melatonin receptors have not been identified in plants and evidence points to a chemical response rather than a receptor-dependent response [64].
While much of the work conducted on melatonin in plants has focused on its physiological influence on growth and development, and on its biosynthesis, little work has focused on its affect on gene expression. Microarray analysis using endogenous melatonin-rich transgenic rice identified several hundred genes that are up- or down- regulated by elevated melatonin levels [65]. Previously, in an effort to understand mechanisms on how melatonin promotes lateral root formation in cucumber, we conducted mRNA-seq analysis using cucumber root tissues and identified potential clusters of genes that may control melatonin-mediated lateral root formation [66]. In this study, using Arabidopsis as a model, we utilized next generation RNA sequencing technology (RNA-seq) to obtain a comprehensive analysis of genome-wide changes in responses to external application of melatonin. RNA-seq can detect changes in gene expression with more precision than a standard microarray, allowing for the potential to identify novel genes. As a model species, Arabidopsis has many advantages for both basic and applied research, including easy transformation and ample resources of available T-DNA lines. Systemic analysis of the effect melatonin has on genome-wide gene expression in Arabidopsis will provide us basic information to genetically dissect melatonin-mediated signaling pathway(s) in regulating plant growth and development.
Materials and Methods
Plant materials and growth condition
Arabidopsis thaliana ecotype Columbia (Col-0) was used for RNA-seq experiments and oxidative stress experiments. All plants were grown in a growth-chamber under 23°C and 14/10 hours light/dark cycle. Three-week-old seedlings were removed from soil, rinsed, and submerged in100 pM, or 1 mM melatonin for 16 hours with gentle shaking. Mock solution was used as control. All experiments were duplicated for statistical analysis.
RNA extraction, library construction and sequencing
After melatonin treatment, total RNA was extracted using the QIAGEN RNeasy Mini Kit according to the manufacturer's instructions (QIAGEN). Purification of mRNA from total RNA was conducted using an Oligotex mRNA Mini Kit (QIAGEN). The mRNA was then used to construct cDNA libraries using the mRNA-Seq Sample Preparation Kit™ (Illumina) following standard protocols. Briefly, the mRNA was fragmented by exposure to divalent cations at 94°C and the fragmented mRNA was converted into double stranded cDNA. The cDNA ends were polished, the 3′-hydroxls extended with A bases, and ligated to Illumina-specific adapter-primers. The adaptor ligated DNA was amplified by 15 cycles of PCR followed by purification using Qiagen™ PCR purification kit to obtain the final library for sequencing. The DNA yield and fragment insert size distribution of the library were determined on the Agilent Bioanalyzer. Library quantifications were performed by qPCR assays using the KAPA Library Quant Kit™ following the manufacturer's instructions.
All six constructed libraries were loaded on the Illumina flow cell at the appropriate concentration and bridge amplified to create millions of individual clonal clusters. The flow cells were sequenced on the HiSeq2000 sequencing instrument using 50 b single end protocols at the Center for the Study of Biological Complexity of the Virginia Commonwealth University.
Post-sequence analysis
After high throughput sequencing performance, short prematurely terminated sequences and those with low quality, as well as reads with any ambiguous bases were removed from raw sequence reads. Clean reads were aligned to the Arabidopsis genome assembly TAIR10 (as a reference) using TopHat (v1.3.1) BWA software [67]. Alignment results were stored in SAM/BAM file format [68] to permit downstream analysis. Cufflinks (v1.0.3) software [69] was then applied to identify transcripts and their abundance levels in RNA-seq data, as well as to perform differential gene expression analysis among multiple samples. Cufflinks calculates expression levels in fragments per kilobase of sequence per million fragments mapped (FPKM), which were used to perform differential gene expression analysis among treatments [69].
Gene Ontology classification of all genes exhibiting significant changes in transcript levels was conducted using AmiGO online tool [70]. Those with only CUFF numbers assigned during automatic analysis were manually checked against their positions using TAIR resources. Gene IDs and their putative functions were assigned accordingly.
Validation of mRNA-seq data using qRT-PCR
A total of 60 genes were selected for verification of mRNA-seq data using qRT-PCR. Primer pairs for each selected gene were presented in Table S1. One microgram RNase free DNase treated total RNA from seedlings treated or untreated with melatonin was used to synthesize first strand cDNA using Superscript III (Invitrogen). qRT-PCR was performed using SSoAdvanced SYBR Green Supermix (BioRad) with the following parameters: 95°C for 3 minutes followed by 40 cycles of 95°C for 10 seconds and 60°C for 30 seconds. Gene expression was normalized via the Livak method using Arabidopsis Elongation Factor 1 (EF1; AT5G60390) as a reference gene [71].
Paraquat-induced oxidative stress
The ability of melatonin to attenuate paraquat-induced oxidative stress was examined using detached Arabidopsis leaves. Seedlings were grown under short day conditions (10/14 hour light/dark photoperiod) to promote vegetative growth for four weeks. Leaves were then detached and incubated in 0 mM, 10 mM or 50 mM paraquat in the presence or absence of 1 mM melatonin under 16/8 hour light/dark photoperiod. After 48 hours, leaves were analyzed for oxidative stress as visualized by photobleaching.
Results and Discussion
Transcriptome sequencing and identification of up- and down-regulated genes by melatonin
To elucidate the roles of melatonin in regulating genome-wide gene expression, we conducted mRNA-seq analysis using Arabidopsis after 16 hours melatonin treatment. Because melatonin may function as a hormone at low concentration, and an antioxidant at high concentrations [35], [37], [56], we chose 100 pM (low) and 1 mM (high) melatonin to treat Arabidopsis to capture what may be physiological levels in planta and elevated levels. Mock solution was used as control. Biological duplicates for each treatment and control were included. After removing short prematurely terminated sequences, low quality sequences and any ambiguous bases, a total of more than 10 million clean reads with at least 10× transcriptome coverage for each library (controls, 100 pM melatonin and 1 mM melatonin treatments) were generated through RNA-seq sequencing (Table 1). Of these, 87.1% and 88.3% for control, 88.0% and 88.6% for 100 pM treatment, and 87.0% and 87.9% for 1 mM treatment were mapped to the Arabidopsis genome assembly TARI10 using TopHat software [67]. Cufflinks was then used to assemble the aligned reads into transcripts and estimate the abundance of the transcripts to analyze differential expression among treatments [69]. In 100 pM melatonin-treated seedlings, only 81 gene transcript levels changed significantly (p<0.05). Of those genes, 30 were up-regulated, 51 were down-regulated. In addition, 4 genes were completely suppressed and 5 genes were uniquely expressed compared to controls. Of the genes that exhibited a change in transcript levels at least 2-fold, 26 were up-regulated and 38 were down-regulated. However, when treated with 1 mM melatonin, more genes were identified with altered expression. A total of 1308 genes exhibited significant changes (p<0.05) in transcript levels in response to 1 mM melatonin with 566 genes up-regulated, and 742 genes down-regulated. Five genes were identified that were uniquely expressed in melatonin treated seedlings while 11 were completely suppressed by 1 mM melatonin. Nearly 900 genes exhibited changes in gene expression of at least 2-fold in response to 1 mM melatonin (387 up-regulated, 510 down-regulated). The lists of these genes are presented in additional files as Table S2 for low melatonin affected genes and Table S3 for high melatonin affected genes. All these genes with significant changes in expression levels in response to low or high concentrations of melatonin were also identified using TAIR database and classified according to their functions using the Gene Ontology GO slimmer.
Table 1. Total number of clean and mapped reads and bases for each sample following mRNA-seq.
| SAMPLE | CLEAN READS | MAPPED READS | % MAPPED | TOTAL BASES | MAPPED BASES | TRANSCRIPTOME COVERAGE |
| Control 1 | 16777955 | 14617162 | 87.1 | 855675705 | 745475262 | 14.3× |
| 100 pM Mel 1 | 17302219 | 15224369 | 88.0 | 882413169 | 776442819 | 14.7× |
| 1 mM Mel 1 | 12395079 | 10782224 | 87.0 | 632149029 | 549893424 | 10.5× |
| Control 2 | 12383964 | 10938665 | 88.3 | 631582164 | 557871915 | 10.5× |
| 100 pM Mel 2 | 18378365 | 16281804 | 88.6 | 937296615 | 830372004 | 15.6× |
| 1 mM Mel 2 | 17452335 | 15331176 | 87.9 | 890069085 | 781889976 | 14.8× |
Sequences were mapped to the Arabidopsis TAIR10 genome using TopHat.
Reproducibility of RNA-seq profiles
To examine the variability among our RNA-seq experiments, all clean reads from melatonin treated and control sets were plotted for all possible pairs of independent experiments. Scatter plots of these data for control plants, 100 pM and 1 mM melatonin-treated plants are shown in Figure 1 and Figure S1. These scatter plots show that the most genes exhibit less variation in expression between the biological duplicates (Figure 1) when compared to the scatter plots between treatments (Figure S1). To further confirm its reproducibility, a phylogenetic analysis using sequences from all 6 libraries was conducted. Again, the biologically duplicated treatments are more closely related than those of the different treatments (Figure S2). Taken together, these results indicate that our experiments are highly reproducible.
Figure 1. Scatter plots show genomic scale reproducibility.
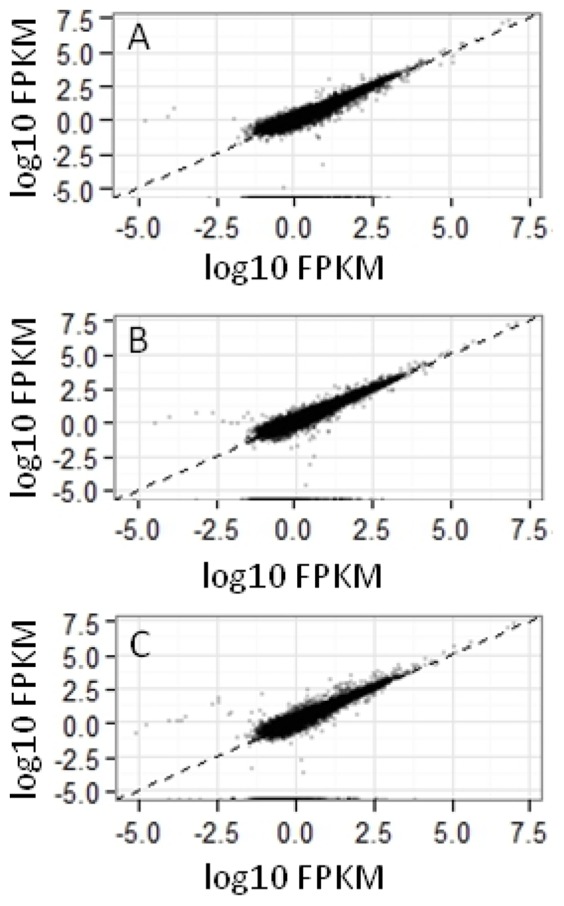
The scatter plots comparing the clean reads of two biological duplicates from control (A), 100 pM melatonin (B) and 1 mM melatonin (C) treatments. Genes are represented by dots. For each gene, the RNA expression level in one rep is given on the x axis and the same gene in the other rep is given on the y axis.
Validation of sequencing data by qRT-PCR
Although the results indicated that our experiments are highly reproducible, we further examined the reliability of the observed changes between treatments. qRT-PCR experiments were performed for a total of 60 genes exhibiting expression changes in response to melatonin treatments in the mRNA-seq analysis. The transcript levels were measured using the same RNAs used for the RNA-seq transcriptome analysis. The full list of 60 genes and their qRT-PCR validation is included in Table S4. Comparisons between mRNA-seq data and qRT-PCR for the top 15 up- and down-regulated genes from the selected group are shown in Figure 2. As shown, most of the selected genes indicated as differentially expressed by RNA-seq transcriptome profiling were confirmed by qRT-PCR. Only 7 of the selected genes were found to not significantly change in response to 1 mM melatonin, although the mRNA-seq data found significant changes in their transcript levels. However, relative fold changes observed in mRNA-seq data are sometimes not comparable to qRT-PCR analysis. This is mainly due to limitations and sensitivity of RNA-seq analysis and global normalization methods. Nevertheless, the qRT-PCR analysis fit well with the mRNA-seq data, indicating the reliability of the RNA-seq data.
Figure 2. qRT-PCR analysis confirming overall results of RNA-seq experiments.

The fold changes in transcript levels identified in RNA-seq experiments for 15 selected genes are graphed in A (up-regulated) and C (down-regulated). qRT-PCR was performed using the same samples for RNA-seq experiments with primers for the selected genes showing up-regulated (B) or down-regulated (D) by 1 mM melatonin. All q-RT-PCR were repeated four times. * p<0.05, ** p<0.01, ***p<0.001.
Annotation and classification of differentially expressed genes into functional categories
The Gene Ontology (GO) classification was conducted for all genes exhibiting a significant change in transcript levels using the AmiGO Slimmer tool and TAIR database. The Slimmer tool assigned general parent (GO slim) terms to the genes according to biological process, cellular component, and molecular function. The most striking difference between up and down regulated genes are those involved in response to stress and responses to endogenous and biotic stimuli. Of the up-regulated genes that were classified to a GO slim term, approximately 42% were involved in response to stress, 25% in response to endogenous stimulus, 24% in response to biotic stimulus, and 22% in response to signal transduction (Table 2). In down-regulated genes, only 17% were involved in response to stress, 9% in response to endogenous stimulus, and 7% in response to both biotic stimulus and signal transduction. Interestingly, this trend was not observed in response to 100 pM melatonin. The proportion of genes involved in response to stress and biotic stimulus following 100 pM melatonin treatment was approximately 30% and 14%, respectively, for both up- and down-regulated genes. The trend was reversed in cell communication and signal transduction as a greater proportion of genes involved in those processes were down regulated in response to 100 pM melatonin. Genes involved in photosynthesis also trended towards down-regulation in response to 1 mM melatonin but trended towards up-regulation in response to 100 pM. Furthermore, genes associated with the cell wall accounted for 7% of down-regulated genes but only 3% of up-regulated genes. 9% of genes down-regulated and 6% of the up-regulated genes with changes of at least 2-fold were associated with redox pathways.
Table 2. Gene ontology classification into biological process of all genes significantly (p<0.05) differentially expressed in response to 1 mM and 100 pM melatonin.
| 1 mM Melatonin | 100 pM Melatonin | ||||
| GO Slim ID | Biological Process | up-regulated | down-regulated | up-regulated | down-regulated |
| GO:0009987 | cellular process | 57.73 | 57.40 | 43.33 | 55.32 |
| GO:0008152 | metabolic process | 50.72 | 51.59 | 50.00 | 53.19 |
| GO:0006950 | response to stress | 42.27 | 16.74 | 30.00 | 29.79 |
| GO:0009058 | biosynthetic process | 28.60 | 35.82 | 23.33 | 31.91 |
| GO:0009719 | response to endogenous stimulus | 25.00 | 9.13 | 23.33 | 12.77 |
| GO:0009607 | response to biotic stimulus | 23.92 | 6.64 | 13.33 | 14.89 |
| GO:0007154 | cell communication | 23.56 | 8.85 | 6.67 | 14.89 |
| GO:0006810 | transport | 23.20 | 14.38 | 10.00 | 12.77 |
| GO:0007165 | signal transduction | 21.94 | 6.50 | 3.33 | 10.64 |
| GO:0009628 | response to abiotic stimulus | 21.76 | 17.43 | 23.33 | 17.02 |
| GO:0008150 | Biological process * | 18.88 | 23.79 | 23.33 | 21.28 |
| GO:0016043 | cellular component organization | 15.65 | 17.15 | 3.33 | 17.02 |
| GO:0019538 | protein metabolic process | 12.59 | 11.62 | 3.33 | 19.15 |
| GO:0009056 | catabolic process | 12.05 | 10.79 | 20.00 | 6.38 |
| GO:0007275 | multicellular organismal development | 11.87 | 17.29 | 10.00 | 12.77 |
| GO:0008219 | cell death | 10.61 | 1.94 | 3.33 | 8.51 |
| GO:0019748 | secondary metabolic process | 8.99 | 7.61 | 10.00 | 4.26 |
| GO:0006139 | nucleobase-containing compound metabolic process | 8.45 | 22.13 | 13.33 | 14.89 |
| GO:0006464 | cellular protein modification process | 7.37 | 7.05 | 0 | 10.64 |
| GO:0009605 | response to external stimulus | 6.83 | 4.01 | 3.33 | 6.38 |
| GO:0006629 | lipid metabolic process | 5.58 | 9.68 | 13.33 | 8.51 |
| GO:0000003 | reproduction | 4.86 | 5.39 | 0 | 4.26 |
| GO:0009791 | post-embryonic development | 4.86 | 9.68 | 3.33 | 4.26 |
| GO:0005975 | carbohydrate metabolic process | 4.32 | 13.69 | 3.33 | 4.26 |
| GO:0009653 | anatomical structure morphogenesis | 4.14 | 10.93 | 3.33 | 4.26 |
| GO:0009991 | response to extracellular stimulus | 3.60 | 1.94 | 3.33 | 6.38 |
| GO:0040007 | growth | 3.60 | 5.81 | 0 | 4.26 |
| GO:0016049 | cell growth | 2.70 | 3.46 | 0 | 2.13 |
| GO:0030154 | cell differentiation | 2.34 | 5.39 | 3.33 | 2.13 |
| GO:0019725 | cellular homeostasis | 1.98 | 2.49 | 3.33 | 0 |
| GO:0006091 | generation of precursor metabolites and energy | 1.62 | 8.16 | 3.33 | 0 |
| GO:0009908 | flower development | 1.62 | 3.04 | 0.00 | 4.26 |
| GO:0009790 | embryo development | 1.26 | 1.52 | 0.00 | 2.13 |
| GO:0015979 | photosynthesis | 1.26 | 9.68 | 6.67 | 2.13 |
| GO:0007049 | cell cycle | 1.08 | 1.80 | 0 | 2.13 |
| GO:0006259 | DNA metabolic process | 0.90 | 2.21 | 0 | 0 |
| GO:0009838 | abscission | 0.54 | 0.14 | 0 | 2.13 |
| GO:0009856 | pollination | 0.54 | 0.41 | 0 | 0 |
| GO:0040029 | regulation of gene expression, epigenetic | 0.36 | 1.11 | 0 | 2.13 |
| GO:0006412 | translation | 0.18 | 1.80 | 0 | 4.26 |
| GO:0009606 | tropism | 0.18 | 0.69 | 0 | 0 |
| GO:0007267 | cell-cell signaling | 0 | 0.28 | 0 | 0 |
| GO:0009875 | pollen-pistil interaction | 0 | 0.14 | 0 | 0 |
Genes were classified using AmiGO GO slimmer. The proportion of genes assigned to each category was calculated by dividing the number of genes assigned to a category by the total number of differentially expressed genes for each treatment. Genes may be classified into one or more GO Slim Term.
*Indicates biological process is unknown.
The biological processes that trended towards down-regulation in response to 1 mM melatonin included biosynthetic processes, metabolism of carbohydrates and nucleobase-containing compounds, development, cellular organization, morphogenesis, photosynthesis, and generation of precursor metabolites and energy.
The cellular components associated with genes down-regulated in response to 1 mM melatonin included cytoplasm, extracellular region, and, consistent with the down-regulation of photosynthesis associated genes, the thylakoid and plastids (Table 3). The cellular components assigned to genes that trended towards up-regulation in response to 1 mM melatonin were the nucleus, plasma membrane, and the Golgi apparatus. The molecular functions associated with genes up-regulated in response to 1 mM melatonin included transferase activity, protein binding, and kinase activity, consistent with the general trend of signaling (Table 4). The molecular functions that trended towards down-regulation in response to 1 mM melatonin were hydrolase activity, nucleic acid (both DNA and RNA) binding, lipid binding, and structural molecule activity.
Table 3. Gene ontology classification into cellular component of all genes significantly (p<0.05) differentially expressed in response to 1 mM and 100 pM Melatonin.
| 1 mM Melatonin | 100 pM Melatonin | ||||
| GO Slim ID | Cellular Component | up-regulated | down regulated | up-regulated | down regulated |
| GO:0005623 | cell | 80.04 | 77.04 | 80.00 | 63.83 |
| GO:0005622 | intracellular | 66.19 | 67.77 | 73.33 | 53.19 |
| GO:0005737 | cytoplasm | 44.78 | 51.87 | 60.00 | 34.04 |
| GO:0005634 | nucleus | 27.16 | 20.89 | 16.67 | 17.02 |
| GO:0016020 | membrane | 25.36 | 26.83 | 20.00 | 12.77 |
| GO:0005886 | plasma membrane | 20.32 | 11.34 | 3.33 | 10.64 |
| GO:0005576 | extracellular region | 13.67 | 20.19 | 10.00 | 23.40 |
| GO:0009536 | plastid | 12.77 | 30.71 | 43.33 | 17.02 |
| GO:0005739 | mitochondrion | 10.07 | 8.44 | 6.67 | 6.38 |
| GO:0005575 | Cellular component * | 8.63 | 9.54 | 13.33 | 2.13 |
| GO:0005829 | cytosol | 6.65 | 5.26 | 3.33 | 4.26 |
| GO:0005794 | Golgi apparatus | 6.12 | 2.07 | 3.33 | 4.26 |
| GO:0005618 | cell wall | 5.94 | 5.39 | 3.33 | 6.38 |
| GO:0030312 | external encapsulating structure | 5.94 | 5.39 | 3.33 | 6.38 |
| GO:0005773 | vacuole | 5.04 | 4.56 | 20.00 | 4.26 |
| GO:0005783 | endoplasmic reticulum | 2.52 | 2.21 | 3.33 | 0 |
| GO:0005768 | endosome | 0.72 | 0.55 | 0 | 0 |
| GO:0005730 | nucleolus | 0.54 | 0.69 | 3.33 | 2.13 |
| GO:0005777 | peroxisome | 0.54 | 0.83 | 0 | 0 |
| GO:0009579 | thylakoid | 0.54 | 11.48 | 10.00 | 0 |
| GO:0005654 | nucleoplasm | 0.36 | 0.00 | 0 | 2.13 |
| GO:0005635 | nuclear envelope | 0.18 | 0.28 | 0 | 0 |
| GO:0005615 | extracellular space | 0 | 0.14 | 0 | 0 |
| GO:0005764 | lysosome | 0 | 0 | 0 | 0 |
| GO:0005840 | ribosome | 0 | 1.38 | 3.33 | 0 |
| GO:0005856 | cytoskeleton | 0 | 0.41 | 0.00 | 0 |
The proportion of genes in each category were calculated by dividing the number of genes assigned to a category by the total number of genes that were classified in a treatment by the AmiGO GO slimmer.
*Indicates cellular component is unknown.
Table 4. Gene Ontology classification into molecular function of all genes significantly (p<0.05) differentially expressed in response to 1 mM and 100 pM melatonin.
| 1 mM Melatonin | 100 pM Melatonin | ||||
| GO Slim ID | Molecular Function | up-regulated | down regulated | up-regulated | down regulated |
| GO:0003824 | catalytic activity | 37.41 | 32.23 | 43.33 | 46.81 |
| GO:0005488 | binding | 25.72 | 21.85 | 23.33 | 25.53 |
| GO:0003674 | Molecular function * | 21.04 | 24.76 | 30.00 | 21.28 |
| GO:0016740 | transferase activity | 16.73 | 9.82 | 13.33 | 21.28 |
| GO:0016787 | hydrolase activity | 12.05 | 10.93 | 23.33 | 10.64 |
| GO:0005515 | protein binding | 11.33 | 7.05 | 13.33 | 8.51 |
| GO:0016301 | kinase activity | 7.73 | 3.18 | 0 | 6.38 |
| GO:0003700 | sequence-specific DNA binding transcription factor activity | 6.83 | 5.39 | 0 | 2.13 |
| GO:0005215 | transporter activity | 5.94 | 4.56 | 3.33 | 2.13 |
| GO:0003676 | nucleic acid binding | 4.32 | 7.33 | 0 | 8.51 |
| GO:0000166 | nucleotide binding | 3.96 | 2.21 | 0 | 8.51 |
| GO:0003677 | DNA binding | 3.24 | 5.39 | 0 | 4.26 |
| GO:0008289 | lipid binding | 1.44 | 1.80 | 0 | 0 |
| GO:0019825 | oxygen binding | 1.26 | 0.97 | 0 | 2.13 |
| GO:0030234 | enzyme regulator activity | 1.26 | 1.24 | 3.33 | 4.26 |
| GO:0004871 | signal transducer activity | 0.72 | 1.11 | 0 | 0 |
| GO:0030246 | carbohydrate binding | 0.72 | 0.55 | 0 | 0 |
| GO:0004872 | receptor activity | 0.54 | 0 | 0 | 0 |
| GO:0003723 | RNA binding | 0.36 | 1.52 | 0 | 2.13 |
| GO:0004518 | nuclease activity | 0.36 | 0.41 | 3.33 | 0 |
| GO:0005102 | receptor binding | 0.36 | 0.14 | 0 | 0 |
| GO:0003682 | chromatin binding | 0 | 0 | 0 | 0 |
| GO:0003774 | motor activity | 0 | 0.83 | 0 | 0 |
| GO:0005198 | structural molecule activity | 0 | 1.80 | 0 | 0 |
| GO:0008135 | translation factor activity, nucleic acid binding | 0 | 0.14 | 0 | 0 |
Genes were classified into at least one category using AmiGO GO slimmer. The proportion of genes that fall into each category were calculated by dividing the number of genes assigned to a category by the total number of genes that could be classified for each treatment.
*Indicates Molecular function is unknown.
Interestingly, expression of chlorophyllase (CLH1), a light regulated enzyme involved in chlorophyll degradation [72], was significantly down-regulated in response to 1 mM melatonin (Gene ID: AT1G19670 in Table S3). This is consistent with a study conducted on senescing apple leaves where exogenous melatonin inhibited transcript levels of pheide a oxygnease (PAO), another key enzyme involved in chlorophyll degradation [41]. These findings can thus explain the means by which melatonin preserves chlorophyll content in leaves [39]–[42], delays senescence [39]–[41], and enhances photosynthetic rates [41]. Indeed, this may provide another mechanism by which melatonin preserves chlorophyll content during senescence in addition to attenuating ROS.
Due to the classic function of melatonin as a “clock” hormone in animals, one might infer that it would play a central role in timing of events in plants, such as flowering. However, since less than 1% of the genes affected by melatonin were involved in flowering, but nearly 40% were involved in stress responses and signaling, it is tempting to deduce that the central role of melatonin in plants is more likely as an antioxidant involved in stress response and as a photo-protectant. However, since the melatonin treatment was a one-time event and flowering is a complex programmed event that is promoted over several days, we cannot completely rule out that fluctuations in melatonin levels over time may signal day length and promote flowering.
Much fewer genes were affected by low level (100 pM) of melatonin treatment with only 81 genes significantly altered their expression. In view of the biological processes, most of the identified genes involved in cellular process, cell communication, response to stress, transporters and signal transductions are down-regulated. Cell death associated genes identified were also mostly down-regulated by 100 pM melatonin.
Comparative analysis was conducted on genes affected by 100 pM melatonin and those by 1 mM melatonin. Results showed that not all genes down-regulated by low (100 pM) melatonin were down regulated by high (1 mM) melatonin. In fact, out of 51 of 100 pM down-regulated genes, only 18 genes were down regulated by 1 mM melatonin treatment, and 13 genes were up-regulated by 1 mM melatonin treatment. Similarly, out of 30 genes up-regulated by 100 pM melatonin, only 5 were also up-regulated by 1 mM melatonin and 8 were down regulated by 1 mM melatonin. Seventeen genes were uniquely up-regulated and 20 were uniquely down-regulated by low (100 pM) melatonin treatment (Figure 3). These results suggest that melatonin may play significantly different roles in control of plant growth and development under low and high concentrations. Overall, the results indicate that melatonin plays important physiological roles in many biological processes during plant growth and development such as stress defense, photosynthesis, cell wall modification and redox homeostasis.
Figure 3. Venn Diagram representing the overlap of the molecular responses to low (100 pM) and high (1 mM) melatonin treatments.
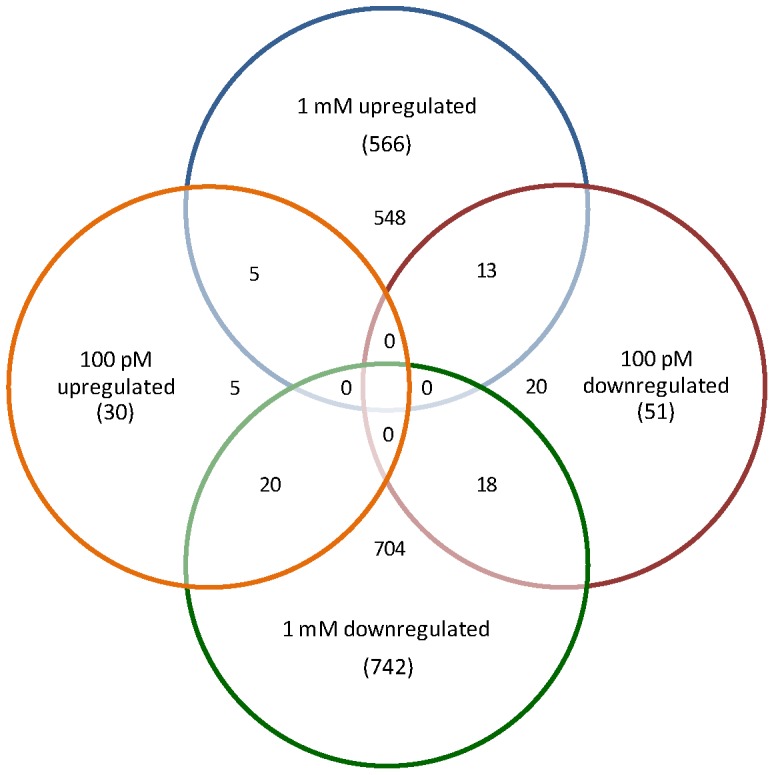
The number in the parenthesis indicates the number of genes altered by melatonin for each treatment.
Identification of novel transcriptionally active regions affected by melatonin
One of the advantages of mRNA-seq technique over microarray is that it can discover novel genes that were not previously annotated [73], [74]. By mapping RNA-seq reads (contigs) against TAIR, we identified 13 contigs that were located in regions of the Arabidopsis genome where there were not predicted genes. Most of these contigs very strong FPKM signals, indicating they are legitimate transcripts. Three genes at positions 2:11563932–11571856, 1:13838585–13839136, and 2:12241769–12242729 were up-regulated by melatonin. Seven at positions 4:2716534–2717374, 5:10330615–10331733, 5:14550372–14550814, 5:18701853–18702020, 5:18891010–18891182, 5:19624545–19624871, and 5:22455105–22455271 were significantly down regulated by melatonin. In addition, 3 regions at positions 11670600–11670738 and 11672189–11672349 on chromosome 1, and 12241769–12242729 on chromosome 2 were completely suppressed by 1 mM melatonin treatment. Further detailed studies are requisite to determine whether these transcriptionally active regions are protein-encoding genes or noncoding RNAs, and to elucidate their roles in regulating melatonin-mediated plant physiological responses.
Melatonin altered many genes involved in plant defense
Given that a large group of genes altered by melatonin are involved in plant stress tolerance, we further categorized these genes according to their specific roles in plant defense. A schematic of the plants response to biotic and abiotic stresses to include key events and players involved in perception, signaling, and counter-attack that were affected by melatonin is depicted in Figure 4. During biotic and abiotic stresses, stress perception involves transmembrane receptors which initiate a signal transduction cascade involving MAP Kinases mediated by transcription factors. A closer examination of stress-responsive genes indicates that melatonin altered the expression of stress-response genes involved in all the steps along the way: from receptors through transcription factors. In addition, hormonal signaling was also examined and included in the schematic (Figure 4) due to the structural similarity between melatonin and IAA and the cross-talk among hormonal pathways and their involvement in signaling during stress events.
Figure 4. Schematic overview of genes exhibiting a change of 2-fold or more in response to melatonin associated with stress response and signaling.

Fold change in transcript levels is represented by the color scale with darkest blue indicating genes with the greatest increase in transcript levels (4-fold or greater) and darkest red indicating genes with the greatest decrease in transcript levels (at least 4-fold). Each gene involved in stress responses is represented once.
Melatonin-altered receptors, kinases, and calcium signaling genes pertaining to stress defense
When facing environmental stresses, plants first perceive stress signal and initiate a signal transduction cascade to defend against the pronounced stresses [75]–[77]. In order to understand the role of melatonin in plant stress defense, we identified all possible genes encoding receptors and kinases, and genes involved in calcium signaling with at least 2 fold changes in RNA-seq data. As shown in Table 5, all but 6 stress receptors identified exhibiting a change in transcript levels of at least 2 fold in response to melatonin were up-regulated. The plant immune response continued to trend towards up-regulation downstream of the receptors. The majority of kinases identified, including two MAPK and MAPKKK, were also up-regulated.
Table 5. Receptors, kinases, and genes involved in calcium signaling whose expression levels were affected by 1 mM melatonin by at least 2 fold.
| Accession | Gene | Description | Fold Change |
| Receptors | |||
| AT4G01870 | AT4G01870 | TolB related protein | 3.18457 |
| AT1G66090 | AT1G66090 | Disease resistance protein (TIR-NBS class) | 3.16883 |
| AT1G57630 | AT1G57630 | Toll-Interleukin-Resistance domain family protein | 2.6298 |
| AT4G14370 | AT4G14370 | TIR-NBS-LRR class disease resistance protein | 2.42877 |
| AT2G32660 | RLP22 | Receptor like protein 22 | 2.23431 |
| AT2G31880 | SOBIR1 | Leucine rich repeat transmembrane protein | 2.00079 |
| Kinases | |||
| AT1G66830 | AT1G66830 | Leucine-rich repeat receptor-like protein kinase | 3.02283 |
| AT1G51830 | AT1G51830 | Leucine-rich repeat protein kinase | 2.84031 |
| AT5G67080 | MAPKKK19 | Mitogen-activated protein kinase kinase kinase 19 | 2.67063 |
| AT5G25930 | AT5G25930 | Leucine-rich repeat receptor-like protein kinase | 2.53548 |
| AT4G11890 | ARCK1 | Osmotic-stress-inducible receptor-like cytosolic kinase 1 | 2.50129 |
| AT2G05940 | RIPK | RPM1-induced protein kinase | 2.40356 |
| AT1G01560 | MPK11 | MAP Kinase 11 | 2.30442 |
| AT4G04490 | CRK36 | Cysteine-rich receptor-like protein kinase | 2.1158 |
| AT1G21250 | WAK1 | Cell wall-associated kinase 1 | 2.05986 |
| AT3G09010 | AT3G09010 | Protein kinase superfamily protein | 2.02544 |
| AT2G41820 | AT2G41820 | Leucine-rich repeat protein kinase family protein | −2.06899 |
| AT5G04190 | PKS4 | Phytochrome kinase substrate 4 | −2.76656 |
| AT4G10390 | AT4G10390 | Receptor-like protein kinase | −3.10278 |
| AT5G58300 | MCK7 | Leucine-rich repeat protein kinase family protein | Suppressed |
| Genes involved in calcium signaling | |||
| AT2G25090 | CIPK16 | CBL-INTERACTING PROTEIN KINASE 16 | 4.56701 |
| AT1G21550 | AT1G21550 | Calcium-binding EF-hand family protein | 3.97178 |
| AT1G74010 | AT1G74010 | Calcium-dependent phosphotriesterase superfamily | 3.74794 |
| AT3G22910 | AT3G22910 | calcium-transporting ATPase 13 | 3.34891 |
| AT1G66400 | CML23 | Calmodulin-like protein 23 | 3.34393 |
| AT5G26920 | CBP60G | Calmodulin binding protein 60-like G | 3.26761 |
| AT1G76650 | CML38 | Calmodulin-like 38 | 3.18083 |
| AT3G50360 | CEN2 | Centrin2; Involved in calcium ion binding | 2.56703 |
| AT3G47480 | AT3G47480 | Calcium-binding EF-hand family protein | 2.29581 |
| AT2G33380 | RD20 | Encodes a calcium binding protein | 2.28141 |
| AT5G63970 | AT5G63970 | Calcium-dependent phospholipid-binding protein | 2.25577 |
| AT3G22930 | CML11 | CALMODULIN-LIKE 11 | 2.08638 |
| AT5G45820 | CIPK20 | CBL-interacting protein kinase 20 | −3.86907 |
| AT1G02900 | RALF1 | Similar to tobacco Rapid Alkalinization Factor (RALF) | −2.7376 |
Calcium signals are also a core regulator for plant cellular responses to environmental stimuli [78]–[80]. Interestingly, all but two of the 14 genes identified involving calcium-dependent signaling in our RNA-seq data were up-regulated in response to melatonin. These genes encode calcium binding protein, calmodulin like protein, CBL-interacting protein kinases and calcium dependent phosphotriesterase. The involvement of calcium signaling in melatonin-mediated pathways is extensively documented in mammalian system [81]–[83]. The discovery of similar components of this pathway in plants indicates that melatonin may use similar signaling to implement its critical role(s) in both plants and mammals.
Transcription factors affected by melatonin
A total of 53 transcription factors were identified with at least 2 fold changes by melatonin treatment (Table 6). Interestingly, all but one of the 29 transcription factors identified as up-regulated genes are stress related transcription factors. These genes include 8 WRKY transcription factors, 5 NAC domain containing proteins and 5 zinc finger related transcription factors. The ERF transcription factor, CEJ1, is also up-regulated. CEJ1 mediates immune responses in Arabidopsis by repressing DREB [84]. In the melatonin down-regulated transcription factor group, 16 of the 24 genes are related to stress responses including 5 ERF (ethylene response factor) transcription factors. Two bZIP transcription factors are also partially suppressed by melatonin.
Table 6. Transcription factors with changes in gene expression levels of at least 2 fold following 1 mM Melatonin treatment.
| Accession # | Gene | Description | Fold change | stress |
| AT4G22070 | WRKY31 | WRKY DNA-binding protein 31 | 4.04382 | + |
| AT1G02450 | NIMIN1 | NIM1-Interacting 1 | 4.01997 | + |
| AT5G64810 | WRKY51 | WRKY DNA-binding protein 51 | 3.89444 | + |
| AT5G26170 | WRKY50 | WRKY DNA-binding protein 50 | 3.60762 | + |
| AT5G26920 | CBP60G | Calmodulin binding protein 60-like.g | 3.51898 | + |
| AT3G46080 | AT3G46080 | C2H2-type zinc finger family protein | 3.443 | + |
| AT3G46090 | ZAT7 | Zinc finger protein | 3.36216 | + |
| AT1G02580 | MEA | Maternal embryogenesis control protein | 3.23147 | |
| AT1G01720 | NAC002 | NAC domain containing protein 2 | 3.07132 | + |
| AT1G01010 | NAC001 | NAC domain containing protein 1 | 3.03835 | + |
| AT3G56400 | WRKY70 | WRKY DNA-binding protein 70 | 2.74608 | + |
| AT4G01250 | WRKY22 | WRKY DNA-binding protein 22 | 2.73313 | + |
| AT2G38250 | AT2G38250 | Homeodomain-like superfamily protein | 2.6849 | + |
| AT5G63790 | NAC102 | NAC domain containing protein 102 | 2.60489 | + |
| AT3G50260 | CEJ1 | Cooperatively regulated by ethylene and jasmonate 1 | 2.57229 | + |
| AT5G13080 | WRKY75 | WRKY DNA-binding protein 75 | 2.53783 | + |
| AT1G73805 | SARD1 | SAR Deficient 1 | 2.41244 | + |
| AT5G59820 | RHL41 | Zinc finger protein | 2.39584 | + |
| AT1G62300 | WRKY6 | WRKY DNA-binding protein 6 | 2.37767 | + |
| AT5G01380 | AT5G01380 | Homeodomain-like superfamily protein | 2.28926 | + |
| AT2G16720 | MYB7 | MYB domain protein 7 | 2.26732 | + |
| AT3G19580 | AZF2 | Zinc finger protein 2 | 2.20418 | + |
| AT5G49450 | bZIP1 | Basic leucine zipper 1 | 2.1947 | + |
| AT1G52890 | NAC019 | NAC domain-containing protein 19 | 2.19063 | + |
| AT5G62020 | HSFB2A | Heat shock transcription factor B2A | 2.10743 | + |
| AT3G04070 | NAC047 | NAC domain containing protein 47 | 2.06633 | + |
| AT1G27730 | STZ | Salt tolerance zinc finger | 2.05565 | + |
| AT2G40750 | WRKY54 | WRKY DNA-binding protein 54 | 2.05047 | + |
| AT3G24500 | MBF1C | Multiprotein bridging factor 1C | 2.04727 | + |
| AT5G20240 | PI | Floral homeotic protein PISTILLATA | −2.00396 | |
| AT3G02380 | COL2 | Zinc finger protein CONSTANS-LIKE 2 | −2.16211 | + |
| AT3G58120 | BZIP61 | Basic-leucine zipper transcription factor family protein | −2.18023 | + |
| AT1G76880 | AT1G76880 | Duplicated homeodomain-like superfamily protein | −2.24420 | + |
| AT1G35560 | TCP23 | TCP domain protein 23 | −2.26984 | + |
| AT3G10040 | AT3G10040 | Sequence-specific DNA binding transcription factor | −2.41108 | + |
| AT1G75240 | HB33 | Homeobox protein 33 | −2.51608 | + |
| AT5G05790 | AT5G05790 | Homeodomain-like superfamily protein | −2.57254 | |
| AT1G14600 | AT1G14600 | Homeodomain-like superfamily protein | −2.60754 | |
| AT1G09530 | PAP3 | Phytochrome-associated protein 3 | −2.67198 | + |
| AT4G32800 | AT4G32800 | Ethylene-responsive transcription factor ERF043 | −2.85108 | + |
| AT5G60890 | MYB34 | Myb-like transcription factor | −2.9674 | + |
| AT2G44940 | AT2G44940 | Ethylene-responsive transcription factor ERF034 | −3.01312 | + |
| AT4G17810 | AT4G17810 | C2H2 and C2HC zinc finger-containing protein | −3.05949 | + |
| AT2G42380 | BZIP34 | BZIP family of transcription factors | −3.10503 | + |
| AT1G19510 | ATRL5 | RAD-like 5 | −3.32387 | |
| AT1G04250 | AXR3 | Auxin resistant 3 | −3.49394 | + |
| AT5G25190 | ESE3 | Ethylene-responsive transcription factor ERF003 | −3.49854 | + |
| AT5G56840 | AT5G56840 | myb-like transcription factor family protein | −3.52364 | |
| AT1G04240 | SHY2 | Short hypocotyl 2 | −3.70592 | |
| AT2G39250 | SNZ | AP2-like ethylene-responsive transcription factor | −4.03198 | + |
| AT5G61890 | AT5G61890 | Ethylene-responsive transcription factor ERF114 | −4.23551 | + |
| AT1G32360 | AT1G32360 | CCCH-type Zinc finger family protein | −4.39267 | |
| AT2G18328 | RL4 | RAD-like 4 | −4.82888 |
Melatonin altered gene expression along stress-induced hormone signaling pathways
Plant hormones and their cross-talk play important roles in both biotic and abiotic stress defense. Of these, abscisic acid (ABA) and ethylene (ET) are known for their abiotic stress defense functions [85]–[87], while salicylic acid (SA) and jasmonic acid (JA) are critical for plant biotic stress defense [88]–[90]. In addition, indole acetic acid (IAA) or auxin, also functions in plant stress defense systems [91]–[92]. In light of these stress-induced hormone signals, we identified 183 genes involved in hormone signaling exhibiting at least a 2-fold change in transcript levels in response to melatonin (Table S5). Of these, 52 genes pertaining to auxin responses and signaling were altered by melatonin with 29 down-regulated and 23 up-regulated. Most of the auxin responsive genes that were down-regulated in response to melatonin are involved in Auxin transport and homeostasis. Furthermore, one of the up-regulated genes encodes a GH3 protein, an IAA-amino synthase which conjugates amino acids to IAA, thus inactivating it [93]. These results may suggest that the Arabidopsis seedlings were responding to high levels of melatonin as they would respond to excess auxin.
Two ACC synthases were also up-regulated in response to melatonin, suggesting that melatonin may induce ethylene biosynthesis. One of the ACC synthases identified is ACS8, an auxin inducible ACC synthase. Indeed, this response is similar to what was induced by 2,4-D [94] and consistent with defense responses in plants. However, none of the known genes on auxin biosynthesis pathways [95] were significantly altered in their expression in response to melatonin (Table S3). This result is in agreement with findings that auxin inducible DR5:GUS reporter gene cannot be induced by melatonin and the function of melatonin is independent of auxin [60].
While the majority of auxin-responsive genes were down-regulated in response to 1 mM melatonin, most genes on ABA, SA, JA and ET pathways were up-regulated (Table S5). On the ABA pathway, 36 out of 50 genes were up-regulated, 70 out of 92 were up-regulated on the SA pathway, 53 out of 67 were up-regulated on the JA pathway, and 32 out of 42 were up-regulated on the ET pathway. As expected, some of these genes are induced by multi-hormone signals confirming important roles of crosstalk among hormones in plant defense systems. Many of the SA, JA, ABA and ET responsive genes induced by melatonin are also induced in response to biotic and abiotic stresses. Consistent with the changes in upstream gene expression levels, many downstream stress-associated genes were also affected, as shown in Table S6. These results further confirm the critical roles of melatonin in defense against both biotic and abiotic stresses in plants.
Most cell wall associated genes were down-regulated by melatonin
Genes with functions involving the cell wall, including modification and growth, were largely affected by melatonin. Of the 60 genes associated with the cell wall, 45 were down-regulated and 14 were up-regulated at least 2-fold, and one gene was completely suppressed (Table 7). The down-regulated genes include 8 expansions and 4 pectin lyases or pectin methyltransferases. Two xyloglucan endotransglucosylases (XTH) were identified among up-regulated genes.
Table 7. Cell wall related genes with at least a 2 fold change in expression levels in response to 1 mM Melatonin.
| Accession # | Gene | Description | Fold Change |
| AT4G25810 | XTR6 | Xyloglucan endotransglycosylase 6 | 4.46599 |
| AT5G57550 | XTH25 | Xyloglucan endotransglucosylase/hydrolase 25 | 4.05392 |
| AT3G60140 | SRG2 | Beta-glucosidase 30 | 3.32985 |
| AT2G45220 | AT2G45220 | Plant invertase/pectin methylesterase inhibitor superfamily | 2.85982 |
| AT1G76470 | AT1G76470 | NAD(P)-binding Rossmann-fold superfamily protein | 2.75965 |
| AT5G57560 | TCH4 | Xyloglucan endotransglucosylase/hydrolase 22 | 2.67655 |
| AT4G30280 | XTH18 | Xyloglucan endotransglucosylase/hydrolase 18 | 2.57069 |
| AT1G21670 | AT1G21670 | uncharacterized protein | 2.46195 |
| AT4G01430 | UMAMIT29 | Nodulin MtN21-like transporter family protein | 2.42787 |
| AT1G78770 | APC6 | Anaphase promoting complex 6 | 2.35509 |
| AT3G45970 | ATEXPL1 | Expansin-like A1 | 2.12646 |
| AT4G26470 | CML21 | Calmodulin-like protein 21 | 2.10667 |
| AT1G05560 | UGT75B1 | UDP-glucosyltransferase 75B1 | 2.08708 |
| AT2G43570 | CHI | Putative chitinase | 2.04539 |
| AT2G37040 | PAL1 | Phenylalanine ammonia-lyase 1 | −2.04568 |
| AT4G08685 | SAH7 | Allergen-like protein | −2.07476 |
| AT2G39700 | EXPA4 | Alpha-Expansin 4 | −2.09564 |
| AT5G14610 | AT5G14610 | DEAD box RNA helicase family protein | −2.10274 |
| AT3G19450 | ATCAD4 | Cinnamyl alcohol dehydrogenase 4 | −2.11144 |
| AT1G70370 | PG2 | Polygalacturonase 2 | −2.11182 |
| AT4G33220 | PME44 | Pectin methylesterase 44 | −2.13826 |
| AT2G33330 | PDLP3 | Plasmodesmata-located protein 3 | −2.15409 |
| AT2G36870 | XTH32 | Xyloglucan endotransglucosylase/hydrolase 32 | −2.22347 |
| AT3G26520 | SITIP | Gamma-tonoplast intrinsic protein 2 | −2.22602 |
| AT1G03630 | PORC | Protochlorophyllide oxidoreductase C | −2.23808 |
| AT2G45470 | FLA8 | Fasciclin-like arabinogalactan protein 8 | −2.26278 |
| AT4G36360 | BGAL3 | Beta-galactosidase 3 | −2.27535 |
| AT1G24100 | UGT74B1 | UDP-glucosyl transferase 74B1 | −2.28945 |
| AT1G69530 | EXPA1 | Alpha-Expansin 11 | −2.31131 |
| AT5G20540 | BRXL4 | Brevis radix-like 4 | −2.32922 |
| AT5G47500 | PME5 | Pectin methylesterase 5 | −2.38968 |
| AT4G12880 | ENODL19 | Early nodulin-like protein 19 | −2.40384 |
| AT5G04360 | PU1 | Pullulanase 1 | −2.41719 |
| AT1G05850 | ELP | Endo chitinase-like protein | −2.43396 |
| AT3G44990 | XTH31 | Xyloglucan endo-transglycosylase | −2.44701 |
| AT5G53090 | AT5G53090 | NAD(P)-binding Rossmann-fold superfamily protein | −2.68485 |
| AT1G04680 | AT1G04680 | Pectin lyase-like superfamily protein | −2.68802 |
| AT5G48900 | AT5G48900 | Pectin lyase-like superfamily protein | −2.69330 |
| AT3G05900 | AT3G05900 | Neurofilament protein-related | −2.78189 |
| AT2G28950 | EXPA6 | Alpha-Expansin 6 | −2.78667 |
| AT3G16370 | AT3G16370 | GDSL-like Lipase/Acylhydrolase superfamily protein | −2.83692 |
| AT5G03760 | ATCSLA09 | Cellulose synthase like A9 | −2.88537 |
| AT4G39330 | CAD9 | Cinnamyl alcohol dehydrogenase 9 | −2.991 |
| AT2G19590 | ACO1 | 1-aminocyclopropane-1-carboxylate oxidase 1 | −3.13848 |
| AT2G34410 | RWA3 | Reduced wall acetylation 3 | −3.20576 |
| AT3G29030 | EXPA5 | Alpha-Expansin 5 | −3.25293 |
| AT1G04040 | AT1G04040 | HAD superfamily, subfamily IIIB acid phosphatase | −3.32924 |
| AT2G37640 | EXP3 | Alpha-Expansin 3 | −3.40584 |
| AT1G20190 | EXPA11 | Alpha-Expansin 11 | −3.47301 |
| AT5G19730 | AT5G19730 | Pectin lyase-like superfamily protein | −3.62317 |
| AT1G43800 | FTM1 | Floral transition at the meristem 1 | −3.98758 |
| AT4G22610 | AT4G22610 | Protease inhibitor/seed storage/lipid transfer family protein | −4.01733 |
| AT4G28250 | EXPB3 | Beta-expansin/allergen protein. | −4.03468 |
| AT3G10340 | PAL4 | Phenylalanine ammonia-lyase | −4.14771 |
| AT2G38120 | AUX1 | Auxin influx transporter | −4.28187 |
| AT3G23090 | WDL3 | Targeting protein for Xklp2 protein family | −4.66044 |
| AT2G40610 | EXPA8 | Alpha-Expansin Gene Family | −4.89447 |
| AT4G02290 | GH9B13 | Glycosyl hydrolase 9B13 | −5.14512 |
| AT1G26250 | AT1G26250 | Proline-rich extensin-like family protein | −7.28679 |
| AT4G31850 | PGR3 | Pentatricopeptide repeat-containing protein | suppressed |
The results in the current study are significantly different from our previous study in cucumber roots showing that many of cell wall related genes, particularly pectinesterase genes, were up-regulated by melatonin [66]. These discrepancies could be explained by different species and tissues being used or the dissimilar methods of melatonin treatment between the two studies. Therefore, it is necessary to further examine the role(s) of these cell wall related genes in melatonin-mediated signaling pathway. In general, cell wall modification and strengthening is the first line of defense plants have against pathogens [96]–[97]. Plant growth involving cell wall expansion would make cells more vulnerable to pathogen attack. Furthermore, XTHs are involved in strengthening the cell wall [98]. Thus, in the event of biotic stress, it is beneficial for plants to suppress cell wall expansion while strengthening the cell wall via XTHs. As a result, the cell wall will be more difficult for pathogens to breach. These discoveries are consistent with the studies reporting the role of melatonin in plant disease resistance [52].
Melatonin alters expression of redox associated genes
Genes and their protein products involved in various redox pathways are also used to protect cells from oxidative damage [99]–[100]. Many genes related to redox homeostasis were identified among the transcripts that were significantly differentially expressed when treated with melatonin (Table 8). In total, we identified 59 genes involved in redox homeostasis with significant changes in expression. Of these, 36 were down-regulated, and 23 were up-regulated by melatonin treatment. Most genes (53 of 59) identified were related to biotic and/or abiotic stress responses. Several members of the same families were differently affected by melatonin. For example, 7 of the 10 cytochromes, 6 of the 9 reductases, 4 of the 5 oxygenases, and 3 of the 5 oxidases were down-regulated by melatonin.
Table 8. Redox-related genes and peroxidases affected by 1 mM melatonin.
| Accession # | Gene | Description | Fold change | Stress response |
| Redox-Related Genes | ||||
| AT2G26400 | ATARD3 | Acireductone dioxygenase 3 | 4.84062 | + |
| AT5G56970 | CKX3 | Cytokinin oxidase 3 | 4.47185 | + |
| AT3G04000 | AT3G04000 | Aldehyde reductase | 4.39375 | + |
| AT2G37770 | ChlAKR | Chloroplastic aldo-keto reductase | 4.27787 | + |
| AT5G48450 | SKS2 | SKU5 Similar | 4.01997 | |
| AT3G21460 | AT3G21460 | Glutaredoxin family protein | 3.82732 | |
| AT1G04580 | AAO4 | Aldehyde oxidase 4 | 3.27115 | + |
| AT2G34500 | CYP710A1 | Cytochrome P450 710A1 | 3.09868 | + |
| AT5G07440 | GDH2 | Glutamate dehydrogenase 2 | 2.99839 | + |
| AT1G76470 | AT1G76470 | NAD(P)-binding Rossmann-fold superfamily protein | 2.75965 | + |
| AT1G30700 | AT1G30700 | FAD-binding Berberine family protein | 2.73673 | + |
| AT2G47130 | SDR3 | short-chain dehydrogenase/reductase 2 | 2.6147 | + |
| AT4G34120 | CDCP1 | Cystathione [Beta]-synthase domain-containing protein 1 | 2.52354 | + |
| AT1G54100 | ALDH7B4 | aldehyde dehydrogenase 7B4 | 2.42985 | + |
| AT4G20830 | AT4G20830 | FAD-binding Berberine family protein | 2.42483 | + |
| AT1G26390 | AT1G26390 | FAD-binding Berberine family protein | 2.40531 | + |
| AT4G20860 | AT4G20860 | FAD-binding Berberine family protein | 2.31804 | + |
| AT3G14620 | CYP72A8 | Cytochrome P450 72A8 | 2.24781 | + |
| AT4G37990 | ATCAD8 | Arabidopsis thaliana cinnamyl-alcohol dehydrogenase 8 | 2.23169 | + |
| AT1G09500 | AT1G09500 | Alcohol dehydrogenase-like protein | 2.1254 | + |
| AT1G30730 | AT1G30730 | FAD-binding Berberine family protein | 2.0479 | + |
| AT5G24530 | DMR6 | Downy mildew resistant 6 | 2.01769 | + |
| AT3G26210 | CYP71B23 | Cytochrome P45071B23 | 2.01045 | + |
| AT2G32720 | CB5-B | Cytochromes B5 | −2.11096 | + |
| AT3G19450 | ATCAD4 | Cinnamyl alcohol dehydrogenase 4 | −2.11144 | + |
| AT4G00360 | CYP86A2 | Cytochrome P450 86A2 | −2.16096 | + |
| AT1G14345 | AT1G14345 | NAD(P)-linked oxidoreductase superfamily protein | −2.16512 | + |
| AT2G46750 | GulLO2 | L -gulono-1,4-lactone oxidase 2 | −2.16775 | + |
| AT1G03630 | PORC | Protochlorophyllide oxidoreductase C | −2.23808 | + |
| AT5G43750 | NDH18 | NAD(P)H dehydrogenase 18 | −2.26847 | + |
| AT5G49730 | ATFRO6 | Ferric reduction oxidase 6 | −2.35762 | + |
| AT5G07460 | ATMSRA2 | Methionine sulfoxide reductase 2 | −2.38061 | + |
| AT1G14150 | PnsL2 | Photosynthetic NDH subcomplex L 2 | −2.39048 | + |
| AT1G17650 | GLYR2 | Glyoxylate reductase 2 | −2.46655 | + |
| AT1G07440 | AT1G07440 | NAD(P)-binding Rossmann-fold superfamily protein | −2.56359 | + |
| AT5G14200 | ATIMD1 | Arabidopsis isopropylmalate dehydrogenase 1 | −2.62532 | + |
| AT1G62540 | FMO GS-OX2 | Flavin-monooxygenase glucosinolate S-oxygenase 2 | −2.65092 | + |
| AT2G39470 | PPL2 | Photosynthetic NDH subcomplex L 1 | −2.6738 | + |
| AT5G53090 | AT5G53090 | NAD(P)-binding Rossmann-fold superfamily protein | −2.68485 | |
| AT5G44410 | AT5G44410 | FAD-binding Berberine family protein | −2.79494 | + |
| AT4G25100 | FSD1 | FE-superoxide dismutase 1 | −2.79727 | + |
| AT4G39330 | CAD9 | Cinnamyl alcohol dehydrogenase 9 | −2.991 | + |
| AT5G58260 | NDHN | NADH Dehydrogenase-like complex N | −2.99281 | + |
| AT4G25600 | AT4G25600 | Oxoglutarate/iron-dependent oxygenase | −3.07505 | |
| AT2G19590 | ACO1 | 1-aminocyclopropane-1-carboxylate oxidase 1 | −3.13848 | + |
| AT4G39510 | CYP96A12 | Cytochrome P450 96A12 | −3.2424 | + |
| AT1G65860 | FMO GS-OX1 | Flavin-monooxygenase glucosinolate S-oxygenase 1 | −3.3226 | + |
| AT1G06350 | ADS4 | Fatty acid desaturase family protein | −3.33981 | + |
| AT3G01440 | PnsL3 | Photosynthetic NDH subcomplex L 3 | −3.34393 | + |
| AT4G13770 | CYP83A1 | Cytochrome P450 83A1 | −3.3894 | + |
| AT4G25310 | AT4G25310 | 2-oxoglutarate and Fe(II)-dependent oxygenase | −3.84556 | + |
| AT4G19380 | AT4G19380 | Long-chain fatty alcohol dehydrogenase family protein | −3.84622 | |
| AT1G43800 | FTM1 | Stearoyl-acyl-carrier-protein desaturase family protein | −3.98758 | + |
| AT1G16400 | CYP79F2 | Cytochrome P450 79F2 | −4.03821 | + |
| AT5G42800 | DFR | Dihydroflavonol 4-reductase | −4.19704 | + |
| AT4G12320 | CYP706A6 | Cytochrome P450 706A6 | −4.31681 | + |
| AT1G16410 | CYP79F1 | Cytochrome P450 79F1 | −4.38148 | + |
| AT1G30760 | AT1G30760 | FAD-binding Berberine family protein | −4.5319 | + |
| AT2G18030 | MSRA5 | Methionine sulfoxide reductase A5 | −5.04612 | |
| Peroxidase Genes | ||||
| AT5G39580 | AT5G39580 | Peroxidase superfamily protein | 3.33272 | + |
| AT1G14550 | AT1G14550 | Peroxidase superfamily protein | 2.66383 | + |
| AT1G14540 | PER4 | Peroxidase 4 | 2.46391 | + |
| AT3G49120 | PRXCB | Peroxidase CB | 2.45042 | + |
| AT4G33420 | AT4G33420 | Peroxidase superfamily protein | 2.2565 | + |
| AT3G21770 | AT3G21770 | Peroxidase superfamily protein | −2.21265 | + |
| AT4G08770 | AT4G08770 | Encodes a putative apoplastic peroxidase Prx37 | −2.21812 | + |
| AT3G26060 | PRXQ | Peroxiredoxin Q | −2.31392 | + |
| AT4G08780 | AT4G08780 | Peroxidase superfamily protein | −2.99013 | + |
| AT1G49570 | AT1G49570 | Peroxidase superfamily protein | −3.03705 | + |
| AT4G30170 | AT4G30170 | Peroxidase family protein | −3.79494 | + |
| AT1G05260 | RCI3 | Cold-inducible cationic peroxidase | −4.07505 | + |
| AT4G11290 | AT4G11290 | Peroxidase superfamily protein | −4.97627 | + |
Peroxidases comprise another group of genes related to oxidative stress and are used as biochemical markers for plant resistance to bacterial and fungal diseases [101]–[103]. Thirteen genes encoding peroxidases were identified with significantly different expression levels following melatonin treatment (Table 8). Eight of these genes were down-regulated by melatonin and five were up-regulated. All identified peroxidase genes were reported to be associated with plant stress defense. Of these, 8 (At1g05260, At1g14540, At3g21770, At3g49120, At4g08770, At4g08780, At4g12290, and At5g39580) were linked with plant biotic stress defense [104]–[106] and 5 (At1g05260, At1g14550, At1g49570, At4g30170, and At4g33420) were involved in plant abiotic stress defense [107]–[108]. The trend towards down-regulation of peroxidase genes in the current study is also contradictory to our previous study using cucumber roots [66] where most peroxidase genes were up-regulated by melatonin. Comparative analysis between these two studies indicates that most peroxidase genes identified in these studies belong to different members of the same gene family, with only two genes [At1G49570 (PER10), and At4G11290 (PER39)] mutual to both studies. Peroxidases belong to a large gene family with more than 70 members in plant species [109]. Their expression levels and patterns in different tissues vary among tissues [109] indicating they play important roles in a diversity of developmental processes [110]–[111].
Melatonin alleviates paraquat-induced photobleaching
Since the majority of genes with altered expression levels are involved in plant stress defense and melatonin is a potent antioxidant, we further examined the potential of melatonin to alleviate paraquat induced oxidative stress. Four-week old detached Arabidopsis leaves were incubated in 0 mM, 10 mM or 50 mM paraquat in the presence or absence of 1 mM melatonin. Leaves treated with paraquat in the absence of melatonin were completely photobleached after 48 hours under 16/8 hour light/dark photoperiod (Figure 5). Leaves treated with 1 mM melatonin remained green, similar to leaves in the absence of paraquat. This result clearly demonstrated that melatonin can play critical roles in attenuating oxidative stress in plants. Since melatonin is able to alleviate paraquat-induced disease in mammals [28]–[30], a similar role(s) of melatonin in defense against oxidative stresses may exist in both animals and plants. We can further utilize Arabidopsis as a model to elucidate the mode of action melatonin employs to protect against oxidative stress-induced diseases in humans and to further our understanding of its unique role(s) in plant species.
Figure 5. Effect of melatonin on paraquat-induced oxidative stress.
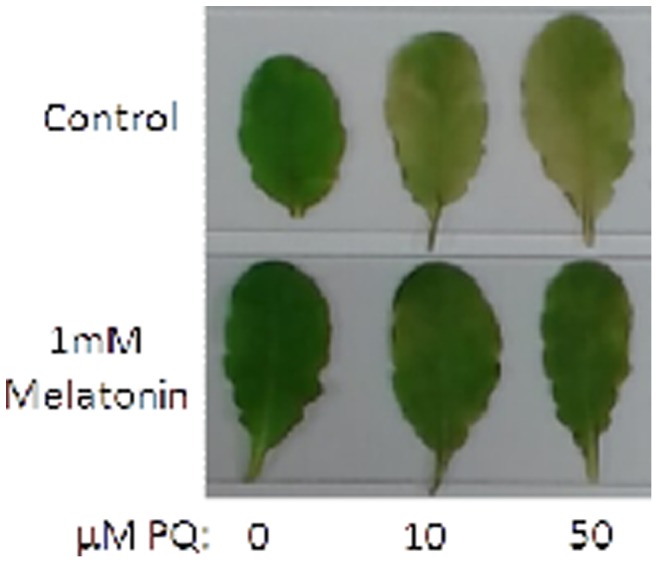
Arabidopsis leaves were detached and floated in solution containing 0, 10(top row) or presence (bottom row) of 1 mM melatonin. After 48 hours, leaves exposed to paraquat in the absence of melatonin were photobleached while leaves incubated with melatonin during exposure to paraquat remained green.
Conclusion
In conclusion, we report here the first comprehensive analysis of the effect of melatonin on genome-wide gene expression in Arabidopsis seedlings using RNA-seq technology. Given that Arabidopsis is an established plant model species and forward and reverse genetics methodologies are readily available, these datasets will provide fundamental information and serve as new tools to genetically dissect melatonin-mediated pathway(s) either common to both plants and animals, or unique to plants. Our transcriptome analysis reveals broader roles of melatonin in regulating plant growth and development. However, more importantly, melatonin may play critical role(s) in plant defense systems. Out of nearly 900 genes that were significantly up- or down- regulated by melatonin with at least 2 fold changes, almost 40% of the genes were related to plant stress defense, including many stress receptors, kinases, and transcription factors, as well as downstream genes encoding end products that were directly used for stress defense. Furthermore, the expression of many genes involved in different hormone signaling pathways such as auxin, ABA, SA, ET and JA, and linked to plant stress defense, was also altered in response to melatonin treatment. Concurrently, expression of many cell wall associated genes, and genes involved in redox pathways, particularly peroxidases were significantly changed by melatonin treatments. Taken together, our results suggest that melatonin plays a critical role in plant defense against environmental stresses, including both biotic and abiotic stresses. Further dissection of the melatonin mediated pathway may lead to the development of novel strategies for crop improvement in the face of ubiquitous environmental stresses.
Supporting Information
Scatter plots between treatments.
(TIF)
Phylogenetic analysis of all clean RNA-seq data from six constructed cDNA libraries.
(TIF)
List of genes and their primer pairs used for qRT-PCR validation.
(DOCX)
List of genes that are significantly affected by 100 pM melatonin.
(DOCX)
List of genes that are significantly affected by 1 mM melatonin.
(DOCX)
qRT-PCR validation of RNA-seq data.
(DOCX)
Genes with changes in expression levels of at least 2 fold in response to 1 mM Melatonin involved in one or more hormone signaling pathways.
(DOCX)
Downstream genes in plant stress defense that are affected by melatonin and their fold changes.
(DOCX)
Acknowledgments
The Sequencing and analysis was performed in the Nucleic Acids Research Facilities and the Bioinformatics Computational Core Laboratories at Virginia Commonwealth University. The authors would also like to thank Myrna Serrano, Nihar U Sheth and Steven Bradley at the Virginia Commonwealth University for their excellent technical assistance in conducting mRNA-seq analysis. This article is a contribution of the Virginia State University, Agricultural Research Station (Journal series No. 315).
Funding Statement
This work is partially supported by USDA Evans Allen Fund. No additional external funding received for this study. The funders had no role in study design, data collection and analysis, decision to publish, or preparation of the manuscript.
References
- 1. Lerner AB, Case JD, Takahashi Y (1985) Isolation of melatonin, a pineal factor that lightens melanocytes. J Am Chem Soc 80: 2587. [Google Scholar]
- 2. Manchester LC, Poeggeler B, Alvares Ogden GB, Reiter RJ (1995) Melatonin immunoreactivity in the photosynthetic prokaryote Rhodospirillum rubrum: implications for an ancient antioxidant system. Cell Mol Biol Res 41: 391–395. [PubMed] [Google Scholar]
- 3. Hardeland R (1999) Melatonin and 5-methoxytryptamine in non-metazoans. Reprod Nutr Dev 39: 399–408. [DOI] [PubMed] [Google Scholar]
- 4. Dubbels R, Reiter RJ, Klenke E, Goebel A, Schnakenberg E, et al. (1995) Melatonin in edible plants identified by radioimmunoassay and by high performance liquid chromatography-mass spectrometry. J Pineal Res 18: 28–31. [DOI] [PubMed] [Google Scholar]
- 5. Hattori A, Migitaka H, Iigo M, Itoh M, Yamamoto K, et al. (1995) Identification of melatonin in plants and its effects on plasma melatonin levels and binding to melatonin receptors in vertebrates. Biochem Mol Biol Int 35: 627–634. [PubMed] [Google Scholar]
- 6. Reiter RJ (1993) The melatonin rhythm: both a clock and a calendar. Experientia 49: 654–664. [DOI] [PubMed] [Google Scholar]
- 7. Carrillo-Vico A, Guerrero JM, Lardone PJ, Reiter RJ (2005) A review of the multiple actions of melatonin on the immune system. Endocrine 27: 189–200. [DOI] [PubMed] [Google Scholar]
- 8. Nishida S Metabolic Effects of Melatonin on Oxidative Stress and Diabetes Mellitus. Endocrine 27: 131–135. [DOI] [PubMed] [Google Scholar]
- 9. McMullan CJ, Schernhammer ES, Rimm EB, Hu FB, Forman JP (2013) Melatonin secretion and the incidence of type 2 diabetes. JAMA 309: 1388–1396. [DOI] [PMC free article] [PubMed] [Google Scholar]
- 10. Rodriguez C, Martín V, Herrera F, Garcia-Santos G, Rodriguez-Blanco J, et al. (2013) Mechanisms Involved in the Pro-Apoptotic Effect of Melatonin in Cancer Cells. Int J Mol Sci 14: 6597–6613. [DOI] [PMC free article] [PubMed] [Google Scholar]
- 11. Tan D, Chen L, Poeggeler B, Manchester L, Reiter R (1993) Melatonin: a potent, endogenous hydroxyl radical scavenger. Endocr J 1: 57–60. [Google Scholar]
- 12. Reiter R, Tan D, Manchester L, Qi W (2001) Biochemical reactivity of melatonin with reactive oxygen and nitrogen species. A review of the evidence. Cell Biochem Biophys 34: 237–256. [DOI] [PubMed] [Google Scholar]
- 13. Tan D, Manchester L, Terron M, Flores L, Reiter R (2007) One molecule, many derivates: A never-ending interaction of melatonin with reactive oxygen and nitrogen species? J Pineal Res 42: 28–42. [DOI] [PubMed] [Google Scholar]
- 14. Galano A, Tan D, Reiter R (2011) Melatonin as a natural ally against oxidative stress: a physicochemical examination. J Pineal Res 51: 1–16. [DOI] [PubMed] [Google Scholar]
- 15. Hernández-Ruiz J, Arnao MB (2008) Distribution of melatonin in different zones of lupin and barley plants at different ages in the presence and absence of light. J Agric Food Chem 56: 10567–10573. [DOI] [PubMed] [Google Scholar]
- 16. Kolář J, Macháčková I, Eder J, Prinsen E, VanDongen W, et al. (1997) Melatonin: occurrence and daily rhythm in Chenopodium rubrum . Phytochemistry 44: 1407–1413. [Google Scholar]
- 17. Boccalandro HE, Gonzalez CV, Wunderlin DA, Silva MF (2011) Melatonin levels, determined by LC-ESI-MS/MS, fluctuate during the day/night cycle in Vitis vinifera cv Malbec: evidence of its antioxidant role in fruits. J Pineal Res 51: 226–232. [DOI] [PubMed] [Google Scholar]
- 18. Van Tassel DL, Roberts N, Lewy A, O'Neill SD (2001) Melatonin in plant organs. J Pineal Res 31: 8–15. [DOI] [PubMed] [Google Scholar]
- 19. Tan DX, Manchester LC, Di Mascio P, Martinez GR, Prado FM, et al. (2007) Novel rhythms of N-1-acetyl-N-2-formyl-5-methoxykynuramine and its precursor melatonin in water hyacinth: importance for phytoremediation. FASEB J 21: 1724–1729. [DOI] [PubMed] [Google Scholar]
- 20. Zhao Y, Tan DX, Lei Q, Chen H, Wang L, et al. (2012) Melatonin and its potential biological functions in the fruits of sweet cherry. J Pineal Res 55: 79–88. [DOI] [PubMed] [Google Scholar]
- 21. Tal O, Haim A, Harel O, Gerchman Y (2011) Melatonin as an antioxidant and its semi-lunar rhythm in green macroalga Ulva sp. J Exp Bot 62: 1903–1910. [DOI] [PMC free article] [PubMed] [Google Scholar]
- 22. Byeon Y, Park S, Kim YS, Park DH, Lee S, et al. (2012) Light-regulated melatonin biosynthesis in rice during the senescence process in detached leaves. J Pineal Res 53: 107–111. [DOI] [PubMed] [Google Scholar]
- 23. Murch S, Saxena P (2002) Mammalian neurohormones: potential significance in reproductive physiology of St. John's wort (Hypericum perforatum L.)? Naturwissenschaften 89: 555–560. [DOI] [PubMed] [Google Scholar]
- 24. Kolář J, Johnson CH, Macháčková I (2003) Exogenously applied melatonin affects flowering of the short-day plant Chenopodium rubrum . J Pineal Res 118: 605–612. [Google Scholar]
- 25. Park S, Le TNN, Byeon Y, Kim YS, Back K (2013) Transient induction of melatonin biosynthesis in rice (Oryza sativa L.) during the reproductive stage. J Pineal Res 55: 40–45. [DOI] [PubMed] [Google Scholar]
- 26. Kenziora-Kornatowska K, Szewczyk-Golec K, Czuczejko J, de Lumen KV, Pawluk H, et al. (2007) Effect of melatonin on the oxidative stress in erythrocytes of healthy young and elderly subjects. J Pineal Res 42: 153–158. [DOI] [PubMed] [Google Scholar]
- 27. Nickkholgh A, Schneider H, Sobirey M, Venetz WP, Hinz U, et al. (2011) The use of high-dose melatonin in liver resection is safe: first clinical experience. J Pineal Res 50: 381–388. [DOI] [PubMed] [Google Scholar]
- 28. Melchiorri D, Reiter RJ, Attia AM, Hara M, Burgos A, et al. (1994) Potent protective effect of melatonin on in-vivo paraquat-induced oxidative damage in rats. Life Sci 56: 83–89. [DOI] [PubMed] [Google Scholar]
- 29. Melchiorri D, Reiter RJ, Sewerynek E, Hara M, Chen LD (1996) Paraquat toxicity and oxidative damage. Reduction by melatonin. Biochem Pharmacol 51: 1095–1099. [DOI] [PubMed] [Google Scholar]
- 30. Singhal NK, Srivastava G, Patel DK, Jain SK, Singh MP (2011) Melatonin or silymarin reduces maneb- and paraquat-induced Parkinson's disease phenotype in the mouse. J Pineal Res 50: 97–109. [DOI] [PubMed] [Google Scholar]
- 31. Rodriguez C, Mayo JC, Sainz RM, Antolin I, Herrera F, et al. (2004) Regulation of antioxidant enzymes: a significant role for melatonin. J Pineal Res 36: 1–9. [DOI] [PubMed] [Google Scholar]
- 32. M Arnao MB, Hernández-Ruiz J (2009) Chemical stress by different agents affects the melatonin content of barley roots. J Pineal Res 46: 295–299. [DOI] [PubMed] [Google Scholar]
- 33. Arnao MB, Hernández-Ruiz J (2013) Growth conditions influence the melatonin content of tomato plants. Food Chem 138: 1212–1214. [DOI] [PubMed] [Google Scholar]
- 34. Arnao MB, Hernández-Ruiz J (2013) Growth conditions determine different melatonin levels in Lupinus albus L. J Pineal Res 55: 149–155. [DOI] [PubMed] [Google Scholar]
- 35. Park S, Lee DE, Jang H, Byeon Y, Kim YS, et al. (2013) Melatonin-rich transgenic rice plants exhibit resistance to herbicide-induced oxidative stress. J Pineal Res 54: 258–263. [DOI] [PubMed] [Google Scholar]
- 36. Tettamanti C, Cerabolini B, Gerola P, Conti A (2000) Melatonin identification in medicinal plants. Acta Phytotherapeutica 3: 137–144. [Google Scholar]
- 37. Tan DX, Reiter RJ, Manchester LC, Yan MT, El-Sawi M, et al. (2002) Chemical and physical properties and potential mechanisms: melatonin as a broad spectrum antioxidant and free radical scavenger. Curr Top Med Chem 2: 181–197. [DOI] [PubMed] [Google Scholar]
- 38. Paredes SD, Korkmaz A, Manchester LC, Tan DX, Reiter RJ (2009) Phytomelatonin: a review. J Exp Bot 60: 57–69. [DOI] [PubMed] [Google Scholar]
- 39. Arnao MB, Hernández-Ruiz J (2009) Protective effect of melatonin against chlorophyll degradation during the senescence of barley leaves. J Pineal Res 46: 58–63. [DOI] [PubMed] [Google Scholar]
- 40. Wang P, Sun X, Li C, Wei ZW, Liang D, et al. (2013) Long-term exogenous application of melatonin delays drought-induced leaf senescence in apple. J of Pineal Res 54: 292–302. [DOI] [PubMed] [Google Scholar]
- 41. Wang P, Yin L, Liang D, Li C, Ma FW, et al. (2012) Delayed senescence of apple leaves by exogenous melatonin treatment: toward regulating the ascorbate-glutathione cycle. J Pineal Res 53: 11–20. [DOI] [PubMed] [Google Scholar]
- 42. Sarropoulou V, Dimassi-Theriou K, Therios I, Koukourikou-Petridou M (2012) Melatonin enhances root regeneration, photosynthetic pigments, biomass, total carbohydrates and proline content in the cherry rootstock PHL-C (Prunus avium x Prunus cerasus). Plant Physiol Biochem 61: 162–168. [DOI] [PubMed] [Google Scholar]
- 43. Lei XY, Zhu RY, Zhang GY, Dai YR (2004) Attenuation of cold-induced apoptosis by exogenous melatonin in carrot suspension cells: the possible involvement of polyamines. J Pineal Res 36: 126–131. [DOI] [PubMed] [Google Scholar]
- 44. Kang K, Lee K, Park S, Kim YS, Back K (2010) Enhanced production of melatonin by ectopic overexpression of human serotonin N-acetyltransferase plays a role in cold resistance in transgenic rice seedlings. J Pineal Res 49: 176–182. [DOI] [PubMed] [Google Scholar]
- 45. Zhang L, Jia J, Xu Y, Wang Y, Hao J, et al. (2012) Production of transgenic Nicotiana sylvestris plants expressing melatonin synthetase genes and their effect on UV-B-induced DNA damage. In vitro cellular & developmental biology. Plant 48: 275–282. [Google Scholar]
- 46. Afreen F, Zobayed SMA, Kozai T (2006) Melatonin in Glycyrrhiza uralensis: response of plant roots to spectral quality of light and UV-B radiation. J Pineal Res 41: 108–115. [DOI] [PubMed] [Google Scholar]
- 47. Posmyk MM, Bałabusta M, Wieczorek M, Sliwinska E, Janas KM (2009) Melatonin applied to cucumber (Cucumis sativus L.) seeds improves germination during chilling stress. J Pineal Res 46: 214–223. [DOI] [PubMed] [Google Scholar]
- 48. Zhang N, Zhao B, Zhang HJ, Weeda S, Yang C, et al. (2013) Melatonin promotes water-stress tolerance, lateral root formation, and seed germination in cucumber (Cucumis sativus L.). J Pineal Res 54: 15–23. [DOI] [PubMed] [Google Scholar]
- 49. Tan DX, Manchester LC, Helton P, Reiter RJ (2007) Phytoremediative capacity of plants enriched with melatonin. Plant Signaling and Behavior 2: 514–516. [DOI] [PMC free article] [PubMed] [Google Scholar]
- 50. Posmyk MM, Kuran H, Marciniak K, Janas KM (2008) Presowing seed treatment with melatonin protects red cabbage seedlings against toxic copper ion concentrations. J Pineal Res 45: 24–31. [DOI] [PubMed] [Google Scholar]
- 51. Li C, Wang P, Wei Z, Liang D, Liu C, et al. (2012) The mitigation effects of exogenous melatonin on salinity-induced stress in Malus hupehensis . J Pineal Res 53: 298–306. [DOI] [PubMed] [Google Scholar]
- 52. Yin L, Wang P, Li M, Ke XW, Li CY, et al. (2013) Exogenous melatonin improves Malus resistance to Marssonina apple blotch. J Pineal Res 54: 426–434. [DOI] [PubMed] [Google Scholar]
- 53. Edgerton MD, Tropsha A, Jones AM (1994) Modeling the auxin-binding site of auxin binding protein-1 of maize. Phytochemistry 35: 1111–1123. [Google Scholar]
- 54. Arnao MB, Hernández-Ruiz J (2006) The physiological function of melatonin in plants. Plant Signal Behav 1: 89–95. [DOI] [PMC free article] [PubMed] [Google Scholar]
- 55. Murch SJ, Krishna Raj S, Saxena PK (2000) Tryptophan is a precursor for melatonin and serotonin biosynthesis in in vitro regenerated St John's wort (Hypericum perforatum L. cv. Anthos) plants. Plant Cell Rep 19: 698–704. [DOI] [PubMed] [Google Scholar]
- 56. Tan TX, Hardeland R, Manchester LC, Korkmaz A, Ma S, et al. (2012) Functional roles of melatonin in plants, and perspectives in nutritional and agricultural science. J Exp Bot 63: 577–597. [DOI] [PubMed] [Google Scholar]
- 57. Arnao MB, Hernandez-Ruiz J (2007) Melatonin promotes adventitious- and lateral root regeneration in etiolated hypocotyls of Lupinus albus L. J Pineal Research 42: 147–152. [DOI] [PubMed] [Google Scholar]
- 58. Chen Q, Qi W, Reiter R, Wei W, Wang B (2009) Exogenously applied melatonin stimulates root growth and raises endogenous IAA in roots of etiolated seedling of Brassica juncea . J Plant Physiol 166: 324–328. [DOI] [PubMed] [Google Scholar]
- 59. Park S, Back K (2012) Melatonin promotes seminal root elongation and root growth in transgenic rice after germination. J Pineal Res 53: 385–389. [DOI] [PubMed] [Google Scholar]
- 60. Pelagio-Flores R, Muñoz-Parra E, Ortiz-Castro R, Lόpez-Bucio J (2012) Melatonin regulates Arabidopsis root system architecture likely acting independently of auxin signaling. J Pineal Res 53: 279–288. [DOI] [PubMed] [Google Scholar]
- 61. Hernández-Ruiz J, Arnao MB, Cano A (2004) Melatonin: growth-stimulating compound present in lupin tissues. Planta 220: 140–144. [DOI] [PubMed] [Google Scholar]
- 62. Hernández-Ruiz J, Arnao MB (2008) Melatonin stimulates the expansion of etiolated lupin cotyledons. Plant Growth Regul 55: 29–34. [Google Scholar]
- 63. Hernández-Ruiz J, Cano A, Arnao MB (2005) Melatonin acts as a growth-stimulating compound in some monocot species. J Pineal Res 39: 137–142. [DOI] [PubMed] [Google Scholar]
- 64. Park WJ (2011) Melatonin as an endogenous plant regulatory signal: debates and perspectives. J of Plant Biol 54: 143–149. [Google Scholar]
- 65. Byeon Y, Park S, Kim YS, Back K (2013) Microarray analysis of genes differentially expressed in melatonin-rich transgenic rice expressing a sheep serotonin N-acetyltransferase. J Pineal Res 55: 357–363. [DOI] [PubMed] [Google Scholar]
- 66. Zhang N, Zhang HJ, Zhao B, Sun QQ, Cao YY, et al. (2014) The RNA-seq approach to discriminate gene expression profiles in response to melatonin on cucumber lateral root formation. J Pineal Res 56: 39–50. [DOI] [PubMed] [Google Scholar]
- 67. Trapnell C, Pachter L, Salzberg SL (2009) TopHat: discovering splice junctions with RNA-Seq. Bioinformatics 25: 1105–1111. [DOI] [PMC free article] [PubMed] [Google Scholar]
- 68. Li H, Handsaker B, Wysoker A, Fennell T, Ruan J, et al. (2009) The Sequence alignment/map (SAM) format and SAMtools. Bioinformatics 25: 2078–2079. [DOI] [PMC free article] [PubMed] [Google Scholar]
- 69. Trapnell C, Williams BA, Pertea G, Mortazavi A, Kwan G, et al. (2010) Transcript assembly and quantification by rna-seq reveals unannotated transcripts and isoform switching during cell differentiation. Nat Biotechnol 28: 511–515. [DOI] [PMC free article] [PubMed] [Google Scholar]
- 70. Carbon S, Ireland A, Mungall CJ, Shu S, Marshall B, et al. (2009) AmiGO: online access to ontology and annotation data. Bioinformatics 25: 288–289. [DOI] [PMC free article] [PubMed] [Google Scholar]
- 71. Livak KJ, Schmittgen TD (2001) Analysis of Relative Gene Expression Data Using Real-Time Quantitative PCR and the 2−ΔΔCT Method. Methods 25: 402–408. [DOI] [PubMed] [Google Scholar]
- 72. Banaś AK, Łabuz J, Sztatelman O, Gabryś H, Fiedor L (2011) Expression of Enzymes Involved in Chlorophyll Catabolism in Arabidopsis Is Light Controlled. Plant Physiol 157: 1497–1504. [DOI] [PMC free article] [PubMed] [Google Scholar]
- 73. Brunskill EW, Potter SS (2012) RNA-Seq defines novel genes, RNA processing patterns and enhancer maps for the early stages of nephrogenesis: Hox supergenes. Dev Biol 368: 4–17. [DOI] [PMC free article] [PubMed] [Google Scholar]
- 74. Zhang L, Cheranova D, Gibson M, Ding S, Heruth DP, et al. (2012) RNA-seq Reveals Novel Transcriptome of Genes and Their Isoforms in Human Pulmonary Microvascular Endothelial Cells Treated with Thrombin. PloS One DOI: 10.1371/journal.pone.0031229 [DOI] [PMC free article] [PubMed] [Google Scholar]
- 75. Tena G, Asai T, Chiu W, Sheen J (2001) Plant mitogen-activated protein kinase signaling cascades. Curr Opin Plant Biol 4: 392–400. [DOI] [PubMed] [Google Scholar]
- 76. Meng X, Zhang S (2013) Cascades in Plant Disease Resistance Signaling. Annu Rev Phytopathol 51: 245–266. [DOI] [PubMed] [Google Scholar]
- 77. Yoo S, Sheen J (2008) Signaling in plant hormone ethylene signal transduction. Plant Signal Behav 3: 848–849. [DOI] [PMC free article] [PubMed] [Google Scholar]
- 78. Tuteja N, Mahajan S (2007) Calcium Signaling Network in Plants. Plant Signal Behav 2: 79–85. [DOI] [PMC free article] [PubMed] [Google Scholar]
- 79. Reddy A, Ali G, Celesnik H, Day IS (2011) Coping with Stresses: Roles of Calcium- and Calcium/Calmodulin-Regulated Gene Expression. Plant Cell 23: 2010–2032. [DOI] [PMC free article] [PubMed] [Google Scholar]
- 80. Vadassery J, Reichelt M, Hause B, Gershenzon J, Boland W, et al. (2012) CML42-mediated calcium signaling coordinates responses to Spodoptera herbivory and abiotic stresses in Arabidopsis. Plant Physiol 159: 1159–1175. [DOI] [PMC free article] [PubMed] [Google Scholar]
- 81. Peters J, Earnest B, Tjalkens R, Cassone VM, Zoran MJ (2005) Modulation of intercellular calcium signaling by melatonin in avian and mammalian astrocytes is brain region-specific. J Comp Neurol 493: 370–380. [DOI] [PMC free article] [PubMed] [Google Scholar]
- 82. Markus S, Bengt S, Gunnar F (2003) Melatonin-induced calcium signaling in clusters of human and rat duodenal enterocytes. Am J Physiol Gastrointest Liver Physiol 284: G1034–G1044. [DOI] [PubMed] [Google Scholar]
- 83. Espino J, Bejarano I, Redondo PC, Rosado JA, Barriga C, et al. (2010) Melatonin reduces apoptosis induced by calcium signaling in human leukocytes: Evidence for the involvement of mitochondria and Bax activation. J Membr Biol 233: 105–118. [DOI] [PubMed] [Google Scholar]
- 84. Tsutsui T, Kato W, Asada Y, Sako K, Sato T, et al. (2009) DEAR1, a transcriptional repressor of DREB protein that mediates plant defense and freezing stress responses in Arabidopsis. J Plant Res 122: 633–643. [DOI] [PubMed] [Google Scholar]
- 85. Ecker JR (1995) The ethylene signal transduction pathway in plants. Science 268: 667–675. [DOI] [PubMed] [Google Scholar]
- 86. Zhang J, Jia W, Yang J, Ismail AM (2006) Role of ABA in integrating plant responses to drought and salt stresses. Field Crops Res 97: 111–119. [Google Scholar]
- 87. Danquah A, Zelicourt A, Colcombet J, Hirt H (2014) The role of ABA and MAPK signaling pathways in plant abiotic stress responses. Biotechnol Adv 32: 40–52. [DOI] [PubMed] [Google Scholar]
- 88. Wasternack C (2007) Jasmonates: An update on biosynthesis, signal transduction and action in plant stress response, growth and development. Ann Bot 100: 681–697. [DOI] [PMC free article] [PubMed] [Google Scholar]
- 89. Catinot J, Buchala A, Abou-Mansour E, Métraux JP (2008) Salicylic acid production in response to biotic and abiotic stress depends on isochorismate in Nicotiana benthamiana . FEBS Lett 582: 473–478. [DOI] [PubMed] [Google Scholar]
- 90. Ren S, Weeda S, Zhu-Salzman K, Ferrell T (2012) Novel Arabidopsis jasmonate-responsive mutants have variations in bacterial disease resistance. J Biotech Res 4: 80–91. [Google Scholar]
- 91. Iglesias MJ, Terrile MC, Casalongué CA (2011) Auxin and salicylic acid signalings counteract the regulation of adaptive responses to stress. Plant Signal Behav 6: 452–454. [DOI] [PMC free article] [PubMed] [Google Scholar]
- 92. Jung JH, Park CM (2011) Auxin modulation of salt stress signaling in Arabidopsis seed germination. Plant Signal Behav 6: 1198–1200. [DOI] [PMC free article] [PubMed] [Google Scholar]
- 93. Ludwig-Müller J (2011) Auxin conjugates: their role for plant development and in the evolution of land plants. J Exp Bot 62: 1757–1773. [DOI] [PubMed] [Google Scholar]
- 94. Raghavan C, Ong EK, Dalling MJ, Stevenson TW (2006) Regulation of genes associated with auxin, ethylene and ABA pathways by 2,4-dichlorophenoxyacetic acid in Arabidopsis. Funct Integr Genomics 6: 60–70. [DOI] [PubMed] [Google Scholar]
- 95. Mano Y, Nemoto K (2012) The pathway of auxin biosynthesis in plants. Journal J Exp Bot 63: 2853–2872. [DOI] [PubMed] [Google Scholar]
- 96. Ellis C, Karafyllidis I, Wasternack C, Turner JG (2002) The Arabidopsis Mutant cev1 Links Cell Wall Signaling to Jasmonate and Ethylene Responses. Plant Cell 14: 1557–1566. [DOI] [PMC free article] [PubMed] [Google Scholar]
- 97. Hamann T (2012) Plant cell wall integrity maintenance as an essential component of biotic stress response mechanisms. Front Plant Sci 23: 77. [DOI] [PMC free article] [PubMed] [Google Scholar]
- 98. Sasidharan R, Voesenek LACJ, Pierik R (2011) Cell Wall Modifying Proteins Mediate Plant Acclimatization to Biotic and Abiotic Stresses. CRC Crit Rev Plant Sci 30: 548–562. [Google Scholar]
- 99. Cuypers A, Vangronsveld J, Clijsters H (2001) The redox status of plant cells (AsA and GSH) is sensitive to zinc imposed oxidative stress in roots and primary leaves of Phaseolus vulgaris. Plant Physiol Biochem 39: 657–664. [Google Scholar]
- 100. Pérez-Ruiz J, Spínola M, Kirchsteiger K, Moreno J, Sahrawy M, et al. (2006) Rice NTRC is a high-efficiency redox system for chloroplast protection against oxidative damage. Plant Cell 18: 2356–2368. [DOI] [PMC free article] [PubMed] [Google Scholar]
- 101. Reuveni R, Ferrira JF (1985) The relationship between peroxidase activity and the resistance of tomatoes to Verticillium dahlia. Phytopathol Z 112: 193–197. [Google Scholar]
- 102. Reuveni R, Bothma GC (1985) The relationship between peroxidase activity and resistance of Spaerotheca fuliginea in melons. Phytopathol Z 114: 260–267. [Google Scholar]
- 103. Reuveni R, Shimoni M, Karchi Z, Kuć J (1992) Peroxidase activity as a biochemical marker for resistance of muskmelon to Pseudoperonospora cubensis . Phytopathol 82: 749–753. [Google Scholar]
- 104. Ascencio-Ibáñez JT, Sozzani R, Lee TJ, Chu TM, Wolfinger RD, et al. (2008) Global analysis of Arabidopsis gene expression uncovers a complex array of changes impacting pathogen response and cell cycle during geminivirus infection. Plant Physiol 148: 436–454. [DOI] [PMC free article] [PubMed] [Google Scholar]
- 105. Thilmony R, Underwood W, He SY (2006) Genome-wide transcriptional analysis of the Arabidopsis thaliana interaction with the plant pathogen Pseudomonas syringae pv. tomato DC3000 and the human pathogen Escherichia coli O157:H7. Plant J 46: 34–53. [DOI] [PubMed] [Google Scholar]
- 106. Cartieaux F, Contesto C, Gallou A, Desbrosses G, Kopka J, et al. (2008) Simultaneous interaction of Arabidopsis thaliana with Bradyrhizobium Sp. strain ORS278 and Pseudomonas syringae pv. tomato DC3000 leads to complex transcriptome changes. Mol Plant Microbe Interact 21: 244–259. [DOI] [PubMed] [Google Scholar]
- 107. Ma S, Gong Q, Bohnert HJ (2006) Dissecting salt stress pathways. J Exp Bot 57: 1097–1107. [DOI] [PubMed] [Google Scholar]
- 108. Kreps JA, Wu Y, Chang HS, Zhu T, Wang X, et al. (2002) Transcriptome changes for Arabidopsis in response to salt, osmotic, and cold stress. Plant Physiol 130: 2129–2141. [DOI] [PMC free article] [PubMed] [Google Scholar]
- 109. Valerio L, Meyer MD, Penel C, Dunand C (2004) Expression analysis of the Arabidopsis peroxidase multigenic family. Phytochemistry 65: 1331–1342. [DOI] [PubMed] [Google Scholar]
- 110. Gapper C, Dolan L (2006) Control of plant development by reactive oxygen species. Plant Physiol 141: 341–345. [DOI] [PMC free article] [PubMed] [Google Scholar]
- 111. Kwak JM, Nguyen V, Schropfer P (2006) The role of reactive oxygen species in hormonal responses. Plant Physiol 141: 323–329. [DOI] [PMC free article] [PubMed] [Google Scholar]
Associated Data
This section collects any data citations, data availability statements, or supplementary materials included in this article.
Supplementary Materials
Scatter plots between treatments.
(TIF)
Phylogenetic analysis of all clean RNA-seq data from six constructed cDNA libraries.
(TIF)
List of genes and their primer pairs used for qRT-PCR validation.
(DOCX)
List of genes that are significantly affected by 100 pM melatonin.
(DOCX)
List of genes that are significantly affected by 1 mM melatonin.
(DOCX)
qRT-PCR validation of RNA-seq data.
(DOCX)
Genes with changes in expression levels of at least 2 fold in response to 1 mM Melatonin involved in one or more hormone signaling pathways.
(DOCX)
Downstream genes in plant stress defense that are affected by melatonin and their fold changes.
(DOCX)