Abstract
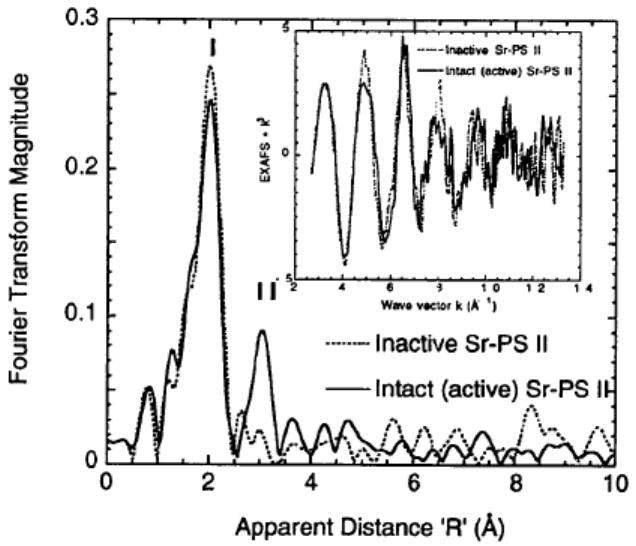
Working on Photosystem II membranes from spinach, we substituted strontium for calcium and probed using Sr EXAFS for any nearby Mn. Sr EXAFS results indicate major differences between the functional (intact) and inactive (hydroxylamine-treated) samples. In intact samples, the Fourier transform of the Sr EXAFS shows a major peak that is missing in inactive samples. This interaction is best simulated by two Mn neighbors at a distance of ~3.5 Å.
Keywords: manganese, EXAFS, calcium, strontium, oxygen evolution, Photosystem II
1. Introduction
The oxygen-evolving complex of Photosystem II (PS II) in green plants and algae contains a cluster of four manganese atoms in the active site (Yachandra et al., 1993), which catalyzes the photosynthetic oxidation of water to dioxygen. Along with manganese (Yachandra et al., 1996) and chloride, Ca is an essential cofactor in oxygen evolution (Debus, 1992). Depleting this cofactor suppresses the activity of the oxygen evolving complex (OEC), which can be restored by replenishing with Ca2+. Partial reactivation (up to 40%) results from addition of strontium to Ca-depleted PS II membranes (Boussac & Rutherford, 1988).
There is some debate about the environment of the Ca cofactor binding site and its function (MacLachlan et al., 1992; Latimer et al., 1995; Booth et al., 1996; Riggs-Gelasco et al., 1996). Given this uncertain situation and to further test whether a Ca binding site is close to the Mn cluster, we decided to embark on a different approach: to use Sr EXAFS methods to probe from the Sr cofactor point-of-view for nearby Mn within 4 Å. This is the reverse of the previously described Mn EXAFS studies that concentrated on the Mn cluster (Latimer et al., 1995; Riggs-Gelasco et al., 1996), and probed for nearby Ca or Sr neighbors. This study then constitutes, to our knowledge, the first application of Sr EXAFS methods to biological systems.
2. Experimental Section
Starting from PS II-enriched membranes from spinach, Sr2+- reactivated samples were prepared as described previously (Latimer et al., 1995). To remove the excess, weakly bound Sr or Ca, we used the direct Chelex treatment of PS II. The Chelex-treated pellets, designated intact Sr-PS II were transferred to Mylar-backed Lucite sample holders designed to fit in EPR and XAS cryostats. The inactive Sr-PS II was prepared by adding 30 μL of a stock solution (100 mM) of NH2OH to the intact Sr-PS II pellet. Sr K-edge EXAFS experiments resembled those previously described for Mn (Latimer et al., 1995). They were conducted at the Stanford Synchrotron Radiation Laboratory on Beamline VII-3 and IV-3 in unfocused mode using a Si(220) double crystal monochromator, and a Canberra Instruments 13-element energy-resolving Ge detector. To analyze Sr EXAFS data, we followed a procedure similar to that used for Mn data (Latimer et al., 1995). We isolated the important long-range interactions around ‘R’ = 3 Å, with a Hanning window. The back-transformed, Fourier-isolated (ΔR= 1.0 Å) data in k-space were then subjected to curve fitting, using ab initio phase and amplitude functions calculated using the program FEFF 5.05 (Rehr et al., 1991; Rehr et al., 1992). By using a simple structural model (Schmidbaur et al., 1990) of oxygen-ligated Sr with Mn (or other atoms, C, O, S, P) located at different distances (3.0 - 4.0 Å) from the central Sr atom, the program generated a range of possible Sr-X interactions, depending on which was needed for curve fitting.
3. Results and Discussion
After the initial characterizations (EPR, oxygen activity, and metals quantitation) were completed, EXAFS measurements were made on the two types of (Chelex-treated) Sr-PS II: intact, and inactive samples. The intact Sr-PS II has reduced amplitude at k ~ 8 Å-1 indicating more than one frequency component, whereas the inactive Sr-PS II seems to possess only one component (Fig. 1 inset). The two samples also have different amplitude envelopes, beat patterns and phases, especially beyond k ~ 9 Å-1. The Fourier transforms of the Sr EXAFS from intact Sr-PS II samples show an interaction (Peak II, Fig. 1) that is best simulated by two Mn at ~ 3.5 Å distance (Table 1). This vector is not present in the inactive, NH2OH-treated set, although both types share similar first coordination shells of oxygen (Peak I, Fig. 1). Attempting to model Peak II with C (the most likely low-Z candidate, from carboxylate ligands) or other low-Z atoms (O, P, S) results in comparatively poor fits as shown in Table 1. By extensive fitting trials we have excluded light atoms as major contributors to Fourier Peak II and thus present Mn as the chemically reasonable alternative.
Figure 1.

Fourier transforms of Sr EXAFS for intact and inactive Sr-substituted PS II samples (Chelex-treated). The spectra are not phase-corrected, and inset shows the k3-weighted EXAFS (k = 2.7 - 13.0 Å-1).
Table 1.
Sr EXAFS Fitting Results for Peak II•
| Scatterer | R (Å) | N | σ2 (Å2) | ΔE0(eV) | Φ • 103 |
|---|---|---|---|---|---|
| Mn | 3.54 | 2.0 | 0.0076 | 0.53 | 0.444 |
| C | 3.58 | 6.0 | 0.0052 | 0.28 | 1.371 |
| O | 3.54 | 4.0 | 0.0041 | 5.50 | 0.454 |
| P | 3.67 | 4.0 | 0.0079 | -6.60 | 0.813 |
| S | 3.66 | 4.0 | 0.0085 | -3.80 | 0.718 |
Φ is the normalized error sum (Latimer et al., 1995) and N was fixed to best-fit integer values.
The absence of Peak II in the inactive samples is consistent with this interpretation. NH2OH treatment disrupts the Mn cluster and could remove the Mn from its native 3.5 Å configuration. This harsh modification in any case may abolish the Sr (Ca) binding site, release the cofactor and ensure that no Mn is nearby (within 4 Å).
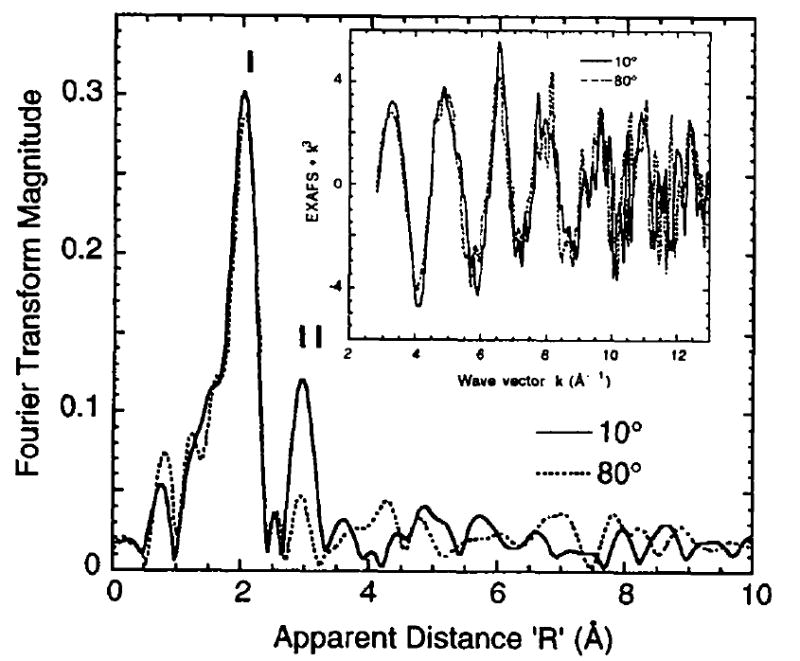
The Sr EXAFS results, translated back to the original cofactor, support the earlier finding that Ca (Sr) is near the Mn cluster (Latimer et al., 1995) at a distance of ~ 3.5 Å. Such a distance indicates the presence of single-atom bridging, likely by oxygen. This bridge may be derived from carboxylate ligands (aspartate or glutamate protein residues), protein backbone carboxyl, water or hydroxide. Further studies to place constraints on the geometry and relative orientation of the Mn–Ca (Sr) vectors will rely on X-ray absorption linear dichroism to target the observed Fourier Peak II (George et al., 1993; Mukerji et al., 1994; Dau et al., 1995). Polarized Sr EXAFS experiments on oriented Sr-PS II multilayers are in progress and preliminary results (Fig. 2) already indicate dichroism in Peak II depending on the alignment of the membrane normal and x-ray electric field vector: maximum amplitude at 10° and suppression at 80°. This dichroism also argues against the large N values (≥ 3) for low-Z atoms (Table 1) and tend to support the smaller N for Mn. It would be difficult to arrange three or more vectors of low-Z neighbors to produce the observed dichroism in Fig. 2, whereas a smaller N would be more consistent. Continued pursuit of these studies should yield the average angle of the Sr–Mn vector relative to the membrane normal, and the average number of backscatterers. By acquiring these parameters, we would further refine the model of the active site.
Figure 2.

Polarized Sr EXAFS from oriented, Sr-substituted PS II at two extreme detection angles (10° and 80°) between the membrane normal and e vector of the x-ray beam. Fourier Peak II is emphasized in the 10° data relative to 80°, where the second peak is reduced to near the noise level. Inset shows the k3-weighted EXAFS in the range k = 2.7 - 13.0 Å-1.
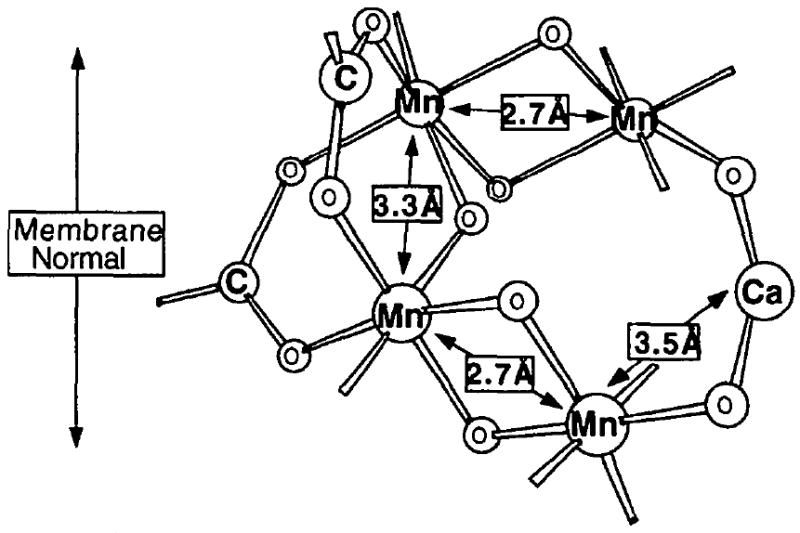
We have used the Sr EXAFS and FT, the curve fitting to Peak II, and the dichroism in Peak II to confirm the proximity of Ca (Sr) to the Mn cluster, at ~ 3.5 Å, distance. The intimate link between Ca and Mn that had been suggested in previous studies has led to the description of the catalytic center of the OEC as a “tetra-Mn/Ca cluster”. A proposed model to explain the Sr EXAFS results is shown in Fig. 3.
Figure 3.

Proposed model for the active site of the oxygen-evolving complex (OEC) in PS II. The current model incorporates the finding for the Sr-substituted PS II studies: Sr (and therefore Ca) is intimately linked to the Mn cluster at ~ 3.5 Å. Modified from Yachandra et al., 1993.
Acknowledgments
This research was supported by the Director, Office of Basic Energy Sciences, Division of Energy Biosciences of the U.S. Department of Energy (DOE), under Contract DE-AC03-76SF00098, and the National Institutes of Health (GM55302 to VKY). EXAFS facilities were provided by the SSRL which is operated by the Department of Energy, Office of Basic Energy Sciences. The SSRL Biotechnology Program is supported by the National Institutes of Health, National Center of Research Resources, Biomedical Technology Program, and by the Department of Energy, Office of Health and Environmental Research.
References
- Booth PJ, Rutherford AW, Boussac A. Biochim Biophys Acta. 1996;1277:127–134. [PubMed] [Google Scholar]
- Boussac A, Rutherford AW. Biochemistry. 1988;27:3476–3483. [Google Scholar]
- Dau H, Andrews JC, Roelofs TA, Latimer MJ, Liang W, Yachandra VK, Sauer K, Klein MP. Biochemistry. 1995;34:5274–5287. doi: 10.1021/bi00015a043. [DOI] [PubMed] [Google Scholar]
- Debus RJ. Biochim Biophys Acta. 1992;1102:269–352. doi: 10.1016/0005-2728(92)90133-m. [DOI] [PubMed] [Google Scholar]
- George GN, Cramer SP, Frey TG, Prince RC. Biochim Biophys Acta. 1993;1142:240–252. doi: 10.1016/0005-2728(93)90152-6. [DOI] [PubMed] [Google Scholar]
- Latimer MJ, DeRose VJ, Mukerji I, Yachandra VK, Sauer K, Klein MP. Biochemistry. 1995;34:10898–10909. doi: 10.1021/bi00034a024. [DOI] [PubMed] [Google Scholar]
- MacLachlan DJ, Hallahan BJ, Ruffle SV, Nugent JHA, Evans MCW, Strange RW, Hasnain SS. Biochem J. 1992;285:569–576. doi: 10.1042/bj2850569. [DOI] [PMC free article] [PubMed] [Google Scholar]
- Mukerji I, Andrews JC, DeRose VJ, Latimer MJ, Yachandra VK, Sauer K, Klein MP. Biochemistry. 1994;33:9712–9721. doi: 10.1021/bi00198a042. [DOI] [PubMed] [Google Scholar]
- Rehr JJ, Albers RC, Zabinsky SI. Phys Rev Lett. 1992;69:3397–3400. doi: 10.1103/PhysRevLett.69.3397. [DOI] [PubMed] [Google Scholar]
- Rehr JJ, Mustre de Leon J, Zabinsky SI, Albers RC. J Am Chem Soc. 1991;113:5135–5140. [Google Scholar]
- Riggs-Gelasco PJ, Mei R, Ghanotakis DF, Yocum CF, Penner-Hahn JE. J Am Chem Soc. 1996;118:2400–2410. [Google Scholar]
- Schmidbaur H, Mikulcik P, Müller G. Chem Ber. 1990;123:1599–1602. [Google Scholar]
- Yachandra VK, DeRose VJ, Latimer MJ, Mukerji I, Sauer K, Klein MP. Science. 1993;260:675–679. doi: 10.1126/science.8480177. [DOI] [PubMed] [Google Scholar]
- Yachandra VK, Sauer K, Klein MP. Chem Rev. 1996;96:2927–2950. doi: 10.1021/cr950052k. [DOI] [PubMed] [Google Scholar]


