

Abstract
Advances in breast cancer (BC) treatments have resulted in significantly improved survival rates. However, BC chemotherapy is often associated with several side effects including cognitive dysfunction. We applied multivariate pattern analysis (MVPA) to functional magnetic resonance imaging (fMRI) to find a brain connectivity pattern that accurately and automatically distinguishes chemotherapy-treated (C+) from non-chemotherapy treated (C−) BC females and healthy female controls (HC). Twenty-seven C+, 29 C−, and 30 HC underwent fMRI during an executive-prefrontal task (Go/Nogo). The pattern of functional connectivity associated with this task discriminated with significant accuracy between C+ and HC groups (72%, p = .006) and between C+ and C− groups (71%, p = .012). However, the accuracy of discrimination between C− and HC was not significant (51%, p = .46). Compared with HC, behavioral performance of the C+ and C− groups during the task was intact. However, the C+ group demonstrated altered functional connectivity in the right frontoparietal and left supplementary motor area networks compared to HC, and in the right middle frontal and left superior frontal gyri networks, compared to C−. Our results provide further evidence that executive function performance may be preserved in some chemotherapy-treated BC survivors through recruitment of additional neural connections.
Keywords: Machine learning, Response inhibition, fMRI, Functional connectivity, Breast cancer, Executive function
INTRODUCTION
Cognitive dysfunction is increasingly recognized as a common side effect of breast cancer (BC) chemotherapy (Ahles, 2012; Janelsins et al., 2011; Rodin & Ahles, 2012; Wefel, Saleeba, Buzdar, & Meyers, 2010; Wefel & Schagen, 2012). Neuroimaging studies of BC chemotherapy have significantly increased our understanding regarding these cognitive difficulties by indicating alterations of prefrontal cortex and hippocampus as well as distributed functional and structural networks (de Ruiter et al., 2012; Deprez, QJ; Billiet, Sunaert, & Leemans, 2013; Ferguson, McDonald, Saykin, & Ahles, 2007; Hosseini, Koovakkattu, & Kesler, 2012; Kesler, Janelsins, et al., 2013; Kesler, Bennett, Mahaffey, & Spiegel, 2009; Kesler, Kent, & O’Hara, 2011; McDonald, Conroy, Ahles, West, & Saykin, 2010; McDonald, Conroy, Ahles, West, & Saykin, 2012; Silverman et al., 2007) [see (Reuter-Lorenz & Cimprich, 2013) for a review of functional studies].
A majority of previous neuroimaging studies used mass univariate analyses. We aimed to extend and advance this literature by using multivariate pattern analysis (MVPA). MVPA more closely matches the covarying nature of neural systems providing greater power for separating groups than univariate or behavioral methods (Hoeft et al., 2011). This increased power stems from MVPA’s ability to use subtle signals across voxels that tend to be undetectable by univariate analyses (Kamitani & Tong, 2005). This increased sensitivity is especially important for the study of chemotherapy-related cognitive dysfunction, which tends to be subtle or difficult to detect with objective measures (Vardy, 2009).
MVPA applies machine learning algorithms to identify patterns in data that accurately differentiate between groups or conditions (Haynes & Rees, 2006; O’Toole et al., 2007; Orru, Pettersson-Yeo, Marquand, Sartori, & Mechelli, 2012; Pereira, Mitchell, & Botvinick, 2009). MVPA is increasingly used to classify individuals to develop diagnostic and prognostic models based on neuroimaging biomarkers. For example, neuroimaging MVPA has been shown to accurately distinguish mild cognitive impairment from healthy aging and dementia (Aksu, Miller, Kesidis, Bigler, & Yang, 2011; O’Dwyer, Lamberton, Bokde, et al., 2012; Zhang & Shen, 2012; Zhang, Wang, Zhou, Yuan, & Shen, 2011), young APOE4 carriers from non-carriers (O’Dwyer, Lamberton, Matura, et al., 2012), and depressed from non-depressed subjects (Craddock, Holtzheimer, Hu, & Mayberg, 2009; Zeng et al., 2012), among others [see (Orru et al., 2012) for a review].
In our recent study, we showed that MVPA of default mode network connectivity accurately distinguishes chemotherapy-treated (C+) from non-chemotherapy treated (C−) BC survivors and healthy controls with 90–91% accuracy (Kesler, Wefel, et al., 2013). Given that this previous study was the first to apply MVPA to chemotherapy-related cognitive dysfunction, it is useful to evaluate alternate potential classifiers. Therefore, in the present study, we applied MVPA to functional magnetic resonance imaging (fMRI) of prefrontal-executive connectivity. We used a common fMRI paradigm, the Go/Nogo task to measure prefrontal-executive neurocircuit function (Menon, Adleman, White, Glover, & Reiss, 2001; Simmonds, Pekar, & Mostofsky, 2008).
We focused on evaluation of prefrontal-executive neurocircuitry for several reasons. First, prefrontal dysfunction is thus far the most consistent finding among previous neuroimaging studies irrespective of imaging modality and even when whole-brain methods are used (Bruno, Hosseini, & Kesler, 2012; de Ruiter et al., 2011, 2012; Ferguson et al., 2007; Kesler et al., 2009, 2011; McDonald et al., 2010, 2012; Silverman et al., 2007). Second, executive function and memory deficits are the most common cognitive impairments in BC chemotherapy (Vardy, 2009; Wefel & Schagen, 2012) and these skills rely on distributed prefrontal cortex networks (Eichenbaum, 2000; Leh, Petrides, & Strafella, 2010).
Third, the Go/Nogo task has been previously used in BC patients to evaluate pre-treatment neurobiologic status (Scherling, Collins, Mackenzie, Bielajew, & Smith, 2012). Specifically, Scherling and colleagues demonstrated reduced activation in several prefrontal-executive network regions before adjuvant chemotherapy in patients compared to controls (Scherling et al., 2012). Our study expands upon that of Scherling et al. by distinguishing between BC women with and without history of chemotherapy treatment and examining long-term survivors, thus emphasizing potential persistent cognitive dysfunction. We also focused on connectivity in prefrontal circuits rather than activation.
Fourth, prefrontal cortex abnormalities have been associated with self-report of executive function impairments (Kesler et al., 2011; McDonald et al., 2012). These findings suggest that prefrontal status may be a sensitive biomarker for patients’ cognitive complaints. Finally, executive-prefrontal deficit is the best predictor of medication adherence in BC patients (Stilley, Bender, Dunbar-Jacob, Sereika, & Ryan, 2010) and thus may be indirectly associated with health status. Therefore, we expected that a MVPA algorithm could be reliably trained to distinguish C+ from C− and healthy female controls (HC) based on connectivity within prefrontal-executive neurocircuitry. We hypothesized that the algorithm would have significant accuracy as defined by the proportion of correct classifications (positive and negative) as well as significant specificity (true negatives) and sensitivity (true positives).
MATERIALS AND METHODS
Participants
We enrolled 56 primary (stages I–IIIA) female BC survivors in this study, 27 C+ and 29 C−, as well as 30 HC (see Table 1). This sample was included in previous studies by our group (Bruno et al., 2012; Hosseini et al., 2012; Kesler, Janelsins, et al., 2013; Kesler et al., 2011; Kesler, Wefel, et al., 2013). BC survivors were recruited via the Army of Women (http://www.armyofwomen.org/), community-based BC support groups and local media advertisements. Healthy controls were recruited via the Army of Women and local media advertisements.
Table 1.
Demographic data for the C+, C−, and HC groups
| C+ (N = 27) | C− (N = 29) | HC (N = 30) | |
|---|---|---|---|
| Age (years) | 55.7 (7.2) | 58.2 (7.5) | 56.4 (8.9) |
| Education (years) | 15.9 (2.7) | 16.7 (2.3) | 16.9 (2.0) |
| Minority status | 7.4% | 3.4% | 3.3% |
| Post menopause | 90.9%HC | 75.0% | 61.5% |
| Tamoxifen | 44.4% | 48.3% | NA |
| Radiation | 70.4% | 55.2% | NA |
| Disease stage 1, 2, 3 | 20%, 68%, 12%C* | 75%, 25%, 0% | NA |
| Time off-therapy (years)* | 5.4 (5.6) | 6.3 (6.6) | NA |
Note. Data are shown as mean (standard deviation) except where noted.
C+ = chemotherapy-treated; C− = non-chemotherapy treated; HC = healthy control.
Significantly different from HC group (p < 0.05).
− Significantly different from C− group (p < 0.01).
Time off-therapy refers to chemotherapy and/or radiation.
There were no significant differences between the groups in age (F = 0.74; p = .48), education (F = 1.43; p = .24) or minority status (χ2 p > .23). The C− and C+ groups did not differ in postmenopausal status (p = .27), time off-therapy (p = .6), radiation (p = .40), or tamoxifen (p = .79). There were significantly more women in the C+ group who were postmenopausal compared to the HC group, which was expected given that chemotherapy can induce early menopause (Mar Fan et al., 2010). The number of postmenopausal women in the C− compared with HC group was non-significantly larger (p = .22). As expected, the disease stage at the time of diagnosis was significantly higher in the C+ group compared with C−.
BC survivors were excluded for history of relapse or prior chemotherapy treatment. Individual chemotherapy regimens included adriamycin/cytoxan/taxol or taxotere = 21, cytoxan/methotrexate/5-fluorouracil = 4 and adriamycin/cytoxan+cytoxan/methotrexate/5-fluorouracil = 2. Additionally, 26 women were treated with tamoxifen and 35 received radiation therapy. Four participants in the C+ group and six in the C− group were still taking tamoxifen at the time of assessment. No patients had received other anti-estrogen treatments. All participants were excluded for diagnosed psychiatric, neurologic or comorbid medical conditions that are known to affect cognitive function as well as MRI contraindications or major sensory deficits (e.g., blindness). This research was completed in accordance with the Helsinki Declaration. The study was approved by the Stanford University Institutional Review Board and all participants provided informed consent.
Go/Nogo Paradigm
The details of the Go/Nogo experiment are described in a previous study (Menon et al., 2001). Briefly, the task consisted of a 30-s rest block, alternating 26-s blocks of Go and Nogo conditions, followed by another 30-s rest block. During the Go/Nogo blocks, participants viewed a series of letters once every 2 s (stimulus presentation: 500 ms, inter-stimulus interval: 1500 ms). In the Go blocks, participants were asked to respond to every stimulus by pressing a button. The Go condition measures sustained attention (Menon et al., 2001). In the Nogo blocks, participants were asked to press the button for all the letters except for the letter X. The letter X was not part of the presented stimuli during the Go blocks. The Nogo condition measures both sustained attention and response inhibition (Menon et al., 2001).
fMRI Data Acquisition
MRI scanning was performed on a GE Discovery MR750 3.0 Tesla whole body scanner (GE Medical Systems, Milwaukee, WI). fMRI scans were acquired while participants were lying supine in the scanner. Stimuli were presented using E-Prime software (Psychology Software Tools). Behavioral responses (accuracy, reaction time) were recorded using a four-button fiber optic finger switch system.
fMRI data were acquired using a T2* weighted gradient echo spiral pulse sequence (repetition time = 2000 ms; echo time = 30 ms, flip angle = 80° and 1 interleave; field of view = 200 × 200 mm2, matrix size = 64 × 64, in-plane spatial resolution = 3.125). Thirty-two axial slices (3-mm thick, 1 mm skip) covering the whole brain were acquired. Number of data frames collected was 160, thus the total scan time was 5:20. An automated high-order shimming method based on spiral acquisitions was used to reduce field heterogeneity (Glover & Lai, 1998). To coregister and normalize functional images with a standardized template, a high-resolution T1-weighted fast spoiled gradient echo anatomical scan was acquired for each individual (relaxation time: minimum, echo time: minimum, flip: 11 degrees, inversion time: 300 ms, bandwidth: ±31.25 kHz, field of view: 24 cm, phase field of view: 0.75, slice thickness: 1.5 mm, 125 slices, 256 × 256 at 1 excitation, scan time: 4:26 min).
Two other task-based fMRI scans, a resting state fMRI scan and a diffusion-weighted scan were also acquired for some participants during the MRI session (total duration = 1 h). Participants were also administered a battery of neuropsychological measures (approximately 1.5 h) on the day of the MRI as described in our previous studies (Bruno et al., 2012; Hosseini et al., 2012; Kesler, Janelsins, et al., 2013; Kesler et al., 2011). These data are not reported here.
fMRI Data Analyses
Image preprocessing was performed using Statistical Parametric Mapping 8 (SPM8; Wellcome Department of Cognitive Neurology, London, UK; http://www.fil.ion.ucl.ac.uk/spm/), as described in our previous publications (Kesler et al., 2009, 2011). First, effects of small head movements were corrected by realigning functional volumes using least square minimization. Realigned functional volumes were then coregistered to individuals’ anatomical images. Anatomical volumes were then segmented and normalized to a standard MNI template and the transformation parameters were applied to the functional volumes. To reduce the effect of noise, the normalized functional volumes were spatially smoothed with an 8-mm full-width at half-maximum (FWHM) Gaussian filter. Images were visually assessed for correct spatial normalization.
Accuracy (percent correct) and response time in milliseconds were collected during the Go/Nogo task. To determine the effects of group and task condition on performance, we conducted a two-way analysis of variance (Nogo vs. Go × C+ vs. C− vs. HC) in SPSS 19.0 (www.spss.com). The threshold for statistical significance was set at p < .05.
MVPA Feature Selection and Extraction
We used 12 cortical regions of interest (ROIs) from the Automated Anatomical Labeling (AAL) atlas using the WFU PickAtlas Toolbox (Tzourio-Mazoyer et al., 2002). ROIs included the bilateral inferior frontal (triangular part) (IFTr), middle frontal (MFG), superior frontal (SFG), medial frontal (MedSF), inferior parietal (IPL), and supplementary motor area (SMA). These regions were consistently reported in previous neuroimaging studies of the Go/Nogo task (Mostofsky et al., 2003; Simmonds et al., 2008), including one study of women with BC (Scherling et al., 2012). These regions also are known to subserve executive function (Leh et al., 2010). The ROIs were resliced to the same dimension as that of the functional images.
Functional connectivity data were extracted using the Functional Connectivity Toolbox (http://www.nitrc.org/projects/conn) (Whitfield-Gabrieli & Nieto-Castanon, 2012) with CompCor noise correction (Behzadi, Restom, Liau, & Liu, 2007). The individual motion parameters were also used as covariates. Finally, ROI to ROI temporal correlations based on corrected BOLD (blood oxygen level dependent) signal were computed for the Nogo blocks resulting in a 12× 12 correlation matrix, containing normalized Z-scores, for each individual. We analyzed only the Nogo blocks to include all cognitive aspects of this task (response inhibition, sustained attention). We did not compare the Nogo blocks with rest since this was a condition-dependent functional connectivity analysis (Whitfield-Gabrieli & Nieto-Castanon, 2012). Subtracting the Go images from Nogo images would eliminate group differences in sustained attention, which is an important component of executive functions.
MVPA Training and Testing
A linear support vector machine (SVM), as implemented by our in-house MVPA Toolbox (Hoeft et al., 2011; Kesler, Wefel, et al., 2013; Marzelli, Hoeft, Hong, & Reiss, 2011) (http://ncnl.stanford.edu/tools), was used for pattern classification. The unique characteristic of linear SVM, compared with other linear classifiers, is that it attempts to maximize the distance between the data points that are closest to the boundary (support vectors) between classes (groups). This characteristic makes the classifier work quite efficiently when the number of samples (and, therefore, the training set) is small (Noble, 2006; Orru et al., 2012).
Separate binary linear SVM classifiers were built for discriminating C+ and HC, C+ and C−, and C− and HC individuals using the pattern of connectivity in the Nogo blocks. For C+ versus C− or HC, a class vector was constructed comprising either “+1”s (C+) or “−1”s (C− or HC) depending on which group the participant belonged to. For HC versus C− classification, a class vector was constructed comprising “+1”s for HC and “−1”s for C−. Next, the connectivity matrices for each individual were converted to a feature vector containing 66 unique ROI to ROI connection strengths (12 × 11/2). The SVM uses the training data that have been previously categorized into groups (i.e., C+, C−, and HC) to build a model (classifier) that optimally separates the groups. In this way, the SVM learns by example how to classify the individual subjects. This process involves finding a weight vector (assigning a weight to each connection) that maximizes the margin of separation between groups (Orru et al., 2012). Connections with high weights are considered important contributors to classification. The farther the participant’s data are from the separation margin (hyperplane), the more different the participant’s functional connectivity pattern is from that of the comparison group.
The validity of the model (classifier) was tested using leave-one out cross-validation to avoid overfitting and allow generalization of the model (Hoeft et al., 2011; Pereira et al., 2009). In each repetition, one subject’s data were left out as a test case, and the remaining subjects’ data were used to train the classifier. This procedure was repeated such that each subject was left out once and the accuracy of the model was then estimated as the proportion of correct predictions. This process allows the training and test cases to remain independent (Orru et al., 2012). Finally, permutation analysis (5000 times) was performed to empirically determine whether the obtained classification accuracy was significantly greater than chance (Marzelli et al., 2011). We adjusted the alpha level for the permutation analysis to p < .017 (Bonferroni corrected) to account for multiple comparisons.
Connectivity maps were constructed using the mean absolute weights of each feature in the classifier. The connections were thresholded for visualization purposes to indicate the connections that carried the greatest weight (> 1 SD) in the classifier (Hoeft et al., 2011). These connections are referred to as “connections with high classification weights”, hereafter. As noted above, the SVM weights indicate the contribution of each connection in discriminating between groups. However, they do not indicate whether the corresponding functional connectivity is decreased or increased. Thus, for connections with high discriminative weights, we also quantified their difference in functional connectivity strength between groups using the ROI-to-ROI normalized Z scores (Greicius et al., 2007).
Effect size of the classifier was quantified using area under the receiver operating characteristic (ROC) curve, which examines the relationship between true positives and false positives (Rice & Harris, 2005). Brain maps were created using BrainNet Viewer software (http://www.nitrc.org/projects/bnv).
Finally, for connections with high classification weight, we performed an exploratory correlation analysis to identify the association between their connectivity strengths and behavioral performance in the Nogo task within each group, separately. In addition, we explored the relationship between clinical and treatment factors in the C+ group with task performance and distance from the hyperplane.
RESULTS
Behavioral Results
Mean Go/Nogo task accuracy and response time for each group are shown in Figure 1. There was a significant effect of condition (F1,166 = 5.4; p < .05). However, the main effect of group (F1,166 = 0.19; p = .83) and group by condition interaction (F1,166 = 0.24; p = .79) were not significant. The response time data also showed a significant effect of condition (F1,166 = 82.9; p < .001) but no significant effect of group (F1,166 = 0.06; p = .97) or group by condition interaction (F1,166 = 0.11; p = .89).
Fig. 1.
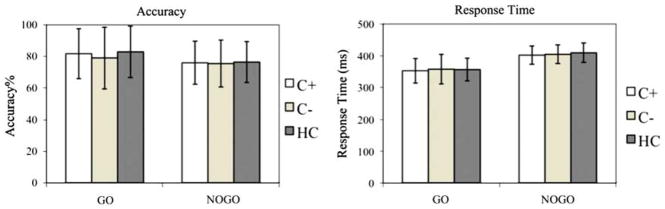
Behavioral results. Mean accuracy (percent correct) and response time in Go and Nogo blocks for C+, C−, and HC groups. For accuracy data, there was a significant main effect of condition (p < .05) but no significant main effect of group (p = .83) and group by condition interaction (p = .79). For response time data, there was a significant main effect of condition (p < .001) but no significant main effect of group (p = .97) and group by condition interaction (p = .89). The error bars indicate the standard deviation from the mean.
MVPA Results
For C+ versus HC classification, the SVM classifier achieved significant classification accuracy (72.0%; p = .006), sensitivity (70.0%; p = .007), and specificity (73.0%; p = .007). The area under the ROC curve was 0.72. Similarly, for C+ versus C− classification, the SVM classifier achieved significant classification accuracy (71.4%; p = .012), sensitivity (70.4%; p = .013), and specificity (72.4%; p = .017). The area under the ROC curve was 0.71. The classification accuracy for C− versus HC did not reach significance (50.9%; p = .46). The area under the ROC curve was 0.51.
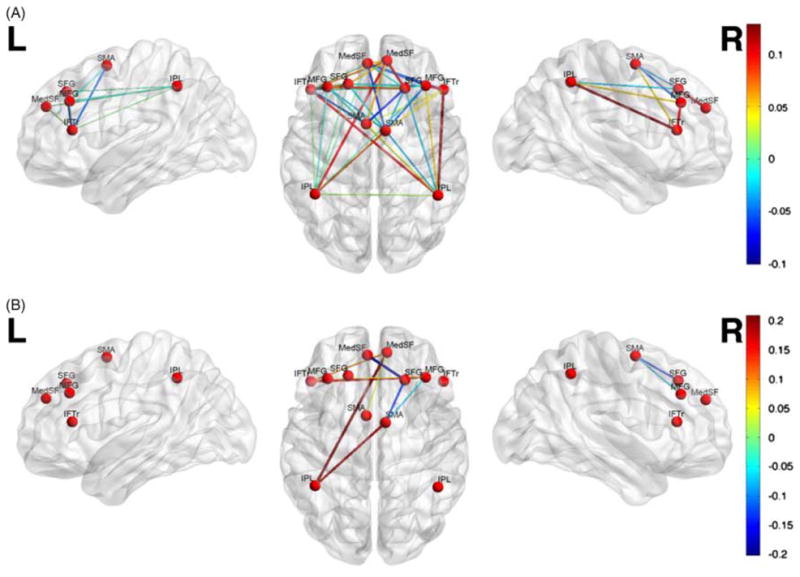
The contribution of each functional connection (absolute SVM weights) to the classifier is shown in Figure 2, Table 2, and Table 3. Connections involving right middle frontal gyrus, right supplementary motor area, and right inferior parietal lobule had the greatest weights (> 1 SD) for discriminating C+ and HC, and those involving right middle frontal gyrus and left superior frontal gyrus had the greatest weight for discriminating C+ and C− groups.
Fig. 2.

Multivariate pattern classification of Nogo functional connectivity in (A) C+ compared to HC, and (B) C+ versus C−. For visualization purposes, only the connections with high classification weights (> 1 SD) are shown. Connectivity pattern in the right middle frontal gyrus, right supplementary motor area and right inferior parietal lobule showed the highest overall contribution to C+ versus HC classification, and connectivity pattern in the right middle frontal and left superior frontal gyri showed the highest overall contribution to C+ versus C− classification. The colorbar represents the absolute weight of each connection in classification.
Table 2.
Overall contribution of each ROI in discrimination of C+ and HC, aggregating the weights of connections involving each ROI
| Region | Overall SVM weight |
|---|---|
| R Middle frontal gyrus* | 5.99 |
| R Supplementary motor area* | 5.87 |
| R Inferior parietal lobule* | 5.13 |
| L Inferior parietal Lobule | 4.84 |
| L Inferior frontal gyrus | 3.83 |
| L Middle frontal gyrus | 3.47 |
| L Medial frontal gyrus | 3.40 |
| R Medial frontal gyrus | 3.2 |
| L Superior frontal gyrus | 3.20 |
| L Supplementary motor area | 3.02 |
| L Superior frontal gyrus | 2.26 |
| R Inferior frontal gyrus | 1.67 |
Indicates regions with overall contribution of 1 SD greater than mean.
ROI = region of interest; C+ = chemotherapy-treated; treated; HC = healthy control SVM, support vector machine.
Table 3.
Overall contribution of each ROI in discrimination of C+ and C−, aggregating the weights of connections involving each ROI
| Region | Overall SVM weight |
|---|---|
| R Middle frontal gyrus* | 8.33 |
| L Superior frontal gyrus* | 7.18 |
| L Inferior frontal gyrus | 6.82 |
| L Medial frontal gyrus | 6.00 |
| R Medial frontal gyrus | 5.84 |
| R Supplementary motor area | 5.75 |
| L Supplementary motor area | 5.60 |
| R Inferior frontal gyrus | 5.01 |
| L Inferior parietal lobule | 5.00 |
| L Middle frontal gyrus | 4.88 |
| R Inferior parietal lobule | 4.55 |
| L Superior frontal gyrus | 3.89 |
Indicates regions with overall contribution of 1 SD greater than mean.
ROI = region of interest; C+ = chemotherapy-treated; C−= non-chemotherapy treated; SVM = support vector machine.
The between group differences (C+ vs. HC and C+ vs. C−) in functional connectivity strengths for regions with high SVM weights are shown in Figure 3. Of 45 connections with high classification weights, 23 connections showed decreased (cool colors) and 22 connections showed increased connectivity (warm colors) in C+ versus HC comparison. For C+ versus C− classification, six of nine connections showed increased connectivity.
Fig. 3.
Difference in functional connectivity between (A) C+ and HC and (B) C+ and C− for connections with high discriminant weights. Positive (negative) values indicate connections that are higher (lower) in C+ than in HC (or C−).
Exploratory Correlation Results
Within each group, an exploratory correlation analysis was performed to identify the relationship between participant’s behavioral performance in the Nogo task and the strength of connections with high classification weights.
C+ versus HC Classification
In the C+ group, Nogo accuracy was significantly correlated with the connectivity strength between right middle frontal gyrus and right inferior parietal lobule (r = 0.43; p < .05) (Figure 4A). The corresponding connectivity strength for these regions was higher in the C+ than in HC group as noted in Figure 3A. No significant correlations were observed in the HC group. Specifically, the correlation between connectivity strength of right middle frontal gyrus and right inferior parietal lobule and accuracy in the Nogo task was not significant within the HC group (r = 0.27; p = .14). The difference in correlations was also not significant between groups (z = 0.65; p = .26).
Fig. 4.

Correlation between performance and functional connectivity. (A) C+ participants with higher Nogo accuracy showed higher connectivity between right middle frontal gyrus and right inferior parietal lobule (r = 0.43; p < .05). (B) C+ participants with higher response time in Nogo task showed higher connectivity between right middle frontal gyrus and left inferior frontal gyrus (r = 0.39; p < .05). (C) C+ participants with lower Nogo accuracy showed higher connectivity between right middle frontal gyrus and left inferior frontal gyrus (r = −0.42; p < .05).
C+ versus C− Classification
Within the C+ group, the strength of connectivity between right middle frontal gyrus and left inferior frontal gyrus was significantly correlated with Nogo response time (r = 0.39; p < .05) and significantly negatively correlated with Nogo accuracy (r = −0.42; p < .05) (Figures 4B and 4C). The corresponding connectivity strength for these regions was higher in the C+ than in C− group as noted in Figure 3B. The correlation between connectivity strength of right middle frontal gyrus and left inferior frontal gyrus and Nogo response time and accuracy was not significant within the C− group (r = −0.04; p = .84 for response time; r = 0.15; p = .44 for accuracy). The between-group differences in correlations were significant for accuracy (z = 1.99; p < .05).
We did not find any significant correlation between C+ clinical/treatment status and their performance in the task. However, a significant correlation was found between C+’s distance from the hyperplane and their cancer stage (Spearman’s r = 0.4; p < .05).
DISCUSSION
We investigated whether the multivariate pattern of neural connectivity during an executive function task (Go/Nogo) could distinguish chemotherapy-treated from non-chemotherapy treated BC survivors and healthy women. While task performance of the C+ group was comparable to that of C− and HC, the SVM classifier achieved significant accuracy, sensitivity, and specificity in discriminating C+ from C− and HC groups. Classification performance resulted in ROCs of 0.71–0.72, which are considered large effects (Rice & Harris, 2005). These findings suggest that altered functional connectivity during an executive function task may represent a sensitive indicator of cognitive dysfunction in C+. In prospective studies, MVPA classifiers could be used to predict individuals who will have persistent cognitive impairment using baseline neuroimaging data. This method has been used successfully in other conditions, such as the prediction of conversion from mild cognitive impairment to dementia (Aksu et al., 2011).
The Nogo condition was more difficult than the Go condition for both groups, as expected. However, no significant between-group differences were observed in accuracy or response time. However, the absence of group difference in task performance or neuropsychological tests does not necessarily suggest that the underlying neurocircuitry is normal (Reuter-Lorenz & Cimprich, 2013). Neuroimaging evidence suggests that performance may be preserved in some women with BC through compensatory neural processes (Cimprich et al., 2010; Ferguson et al., 2007; Kesler et al., 2009) that cannot be detected by behavioral measures (McDonald et al., 2012; Reuter-Lorenz & Cimprich, 2013).
Despite the absence of group difference in task performance, the MVPA classifier could accurately differentiate between C+ and C− or HC groups based on the pattern of prefrontal-executive network connectivity. The regions that showed the highest contribution to the C+ versus HC classification were the right middle frontal gyrus, right supplementary motor area and right inferior parietal lobule, and those that highly contributed to distinguishing C+ and C− groups were the right middle frontal gyrus and the left superior frontal gyrus. Multimodal neuroimaging evidence suggests that the supplementary motor area plays a role in conflict detection/resolution within the response generation network (Aron, Behrens, Smith, Frank, & Poldrack, 2007). Patients with lesions to the superior frontal regions showed increased incorrect responses to the Nogo stimulus (Picton et al., 2007). The frontoparietal network is critical for executive function and attention orientation as well as manipulating and monitoring information in working memory (Leh et al., 2010). Alterations in frontal and parietal structural connectivity have been reported for C+ in previous studies (Deprez et al., 2011, 2012). Additionally, our previous data showed changes in topological properties of prefrontal regions in both resting-state functional and structural association networks in C+ (Bruno et al., 2012; Hosseini et al., 2012).
Examination of functional connectivity strengths revealed a profile of both hypo- and hyper-connectivity in the C+ group compared to HC and C−. Increased connectivity between the middle frontal gyrus and inferior parietal lobule was significantly associated with increased Nogo performance in the C+ group. This observation suggests a potential compensatory mechanism that helps C+ survivors preserve their performance during certain tasks. Consistent with these findings, previous fMRI studies reported hyper-activation during executive task performance in C+ survivors (Ferguson et al., 2007; McDonald et al., 2012). For example, Ferguson and colleagues (2007) compared twins with and without BC during an n-back working memory performance. Compared with the healthy twin, the C+ twin recruited much broader brain regions during task performance, even at very low load conditions (Ferguson et al., 2007).
However, studies have also shown hypo-activation during other executive tasks (de Ruiter et al., 2011; Kesler et al., 2011). These differences in findings could reflect several factors including the nature and difficulty level of the task and/or specific sample characteristics. A recent review of fMRI studies in BC demonstrated a pattern of hyper-activation, or recruitment of additional neural resources, at low task difficulty (Reuter-Lorenz & Cimprich, 2013). As task difficulty increases, women with BC may be unable to maintain this compensatory response (Reuter-Lorenz & Cimprich, 2013), resulting in decreased activation or connectivity. The authors also suggest that neural compensation may mask behavioral performance effects (Reuter-Lorenz & Cimprich, 2013), which is consistent with our findings.
It should also be noted that studies showing hypo-activation tend to involve very long-term survivors (5 or more years off-therapy) (de Ruiter et al., 2011; Kesler et al., 2011). However, progressive decline is supported by neuropsychological data (Wefel et al., 2010) and is observed in other conditions that affect cognitive function. For example, increased functional connectivity is demonstrated during early phases of amnestic mild cognitive impairment followed by decreased connectivity later on (Bai et al., 2011; Jones et al., 2011). Our previous studies of network topology in long-term C+ survivors demonstrate decreased brain network efficiency, which may reduce the ability to coordinate neural responses to cognitive demands and compensate for neurologic dysfunction (Bruno et al., 2012; Hosseini et al., 2012). Longitudinal studies of BC that include long-term follow up assessments are necessary to examine changes in neurocircuitry response over time and how these changes may impact cognitive status.
Among features that distinguished between C+ and C−, the connectivity strength between right middle frontal gyrus and left inferior frontal gyrus showed a positive correlation with Nogo response time and a negative correlation with accuracy in the C+ group. Multiple studies have shown the involvement of inferior frontal cortex in response inhibition (Aron et al., 2007; Picton et al., 2007; Swick, Ashley, & Turken, 2008). This observation may reflect over-inhibition of responding in chemotherapy-treated BC survivors during tasks with low difficulty that results in higher response time and lower accuracy in Nogo blocks.
Within the C+ group only, we found a positive correlation between distance from the hyperplane and cancer stage. Data that are more distant from the hyperplane are those that are more distinguishable from the comparison group. Therefore, the results suggest an association between disease severity and alterations in connectivity pattern in C+. Consistently, our previous data showed a significant correlation between disease severity and hypo-activation in the left prefrontal regions in C+ but not C− (Kesler et al., 2011). Disease severity tends to be highly interrelated with treatment intensity; patients with high stage at diagnosis are more likely to receive chemotherapy (Du & Goodwin, 2001).
We did not find a pattern of prefrontal connectivity that could distinguish between C− and HC despite previous research suggesting that cancer pathology as well as other adjuvant treatments (radiation, tamoxifen) may contribute to cognitive changes in BC independently from chemotherapy (Eberling, Wu, Tong-Turnbeaugh, & Jagust, 2004; Kesler et al., 2011; McDonald et al., 2012; Phillips et al., 2012; Scherling, Collins, Mackenzie, Bielajew, & Smith, 2011; Scherling et al., 2012). Compared to previous studies, the present findings were based on examination of functional connectivity rather than functional activation. Our results could suggest that cancer pathology, radiation, and/or hormonal blockade treatments may affect regional activation but are not sufficient to impact the connectivity of larger-scale brain networks. Additionally, MVPA involves a different inferential question compared to univariate methods. MVPA is concerned with the reliability of the difference between two groups whereas univariate analysis is concerned with whether or not there is a between-group difference (O’Toole et al., 2007). The Go/Nogo task may not be the best for distinguishing C− from HC. Studies demonstrating differences between C− and HC with respect to prefrontal function used tasks measuring other executive functions (working memory, cognitive flexibility) (Kesler et al., 2011; McDonald et al., 2012). Further research is required to identify the different profiles of brain changes that may be associated with individual and combined candidate mechanisms of cognitive difficulties in BC.
While our current results were associated with strong effect sizes, our previous MVPA results suggest that default mode network (DMN) connectivity may provide a better classifier of chemotherapy-related cognitive difficulty. DMN connectivity distinguished C+ from both C− survivors and HC with 90–91% accuracy with ROCs of 0.97–0.98 (Kesler, Wefel, et al., 2013). This is consistent with previous research suggesting that resting state DMN connectivity is highly sensitive to disease states (Sheline et al., 2010). In future studies, evaluation of various neuroimaging classifiers against other models (e.g., neuropsychological or treatment variables) and combined models (neuroimaging + neuropsychological variables) could reveal the most precise classifiers.
Our study is limited by its cross-sectional design. Prospective, longitudinal designs are required to determine individual differences in neural connectivity that may contribute to individual cognitive outcome. Our subject recruitment materials specifically mentioned cognitive dysfunction and therefore the sample may have been biased toward survivors who were concerned about their cognitive function. The Go/Nogo task is a well-established, commonly used fMRI paradigm that is brief and easy to implement. However, other fMRI paradigms may yield alternate results. Our MVPA feature selection was based on previous studies of the Go/Nogo task as well as literature regarding prefrontal-executive neurocircuitry but alternate features might provide alternate results.
In summary, our findings demonstrate that MVPA is a very promising tool for examining BC chemotherapy-related cognitive dysfunction. Methods like MVPA with increased sensitivity are especially important for this field given that cognitive deficits may be difficult to detect and/or masked by compensatory responses. If used in prospective studies, MVPA could potentially identify individuals at the highest risk for persistent cognitive dysfunction. These patients could then be prioritized for regular neuropsychological surveillance and possible early or preventative intervention. Our results also increase our understanding of the neurobiologic mechanisms underlying cognitive impairment in C+. Specifically, we demonstrated an altered pattern of functional connectivity during an executive function task. Consistent with previous studies, our findings suggest that performance during certain tasks may be preserved in some C+ survivors via recruitment of additional frontoparietal neurocircuitry. The identification of demographic, neurobiologic, medical, and/or other factors that enhance or maintain this compensation will be essential for the development of interventions.
Acknowledgments
This work was supported by the National Institutes of Health Director’s New Innovator Award (DP2 OD004445-01 to SK).
Footnotes
The authors report no conflict of interest.
References
- Ahles TA. Brain vulnerability to chemotherapy toxicities. Psychooncology. 2012 doi: 10.1002/pon.3196. [DOI] [PMC free article] [PubMed] [Google Scholar]
- Aksu Y, Miller DJ, Kesidis G, Bigler DC, Yang QX. An MRI-derived definition of MCI-to-AD conversion for long-term, automatic prognosis of MCI patients. PLoS One. 2011;6(10):e25074. doi: 10.1371/journal.pone.0025074. [DOI] [PMC free article] [PubMed] [Google Scholar]
- Aron AR, Behrens TE, Smith S, Frank MJ, Poldrack RA. Triangulating a cognitive control network using diffusion-weighted magnetic resonance imaging (MRI) and functional MRI. Journal of Neuroscience. 2007;27(14):3743–3752. doi: 10.1523/JNEUROSCI.0519-07.2007. 27/14/3743 [pii] [DOI] [PMC free article] [PubMed] [Google Scholar]
- Bai F, Watson DR, Shi Y, Wang Y, Yue C, Yuhuan Teng, Zhang Z. Specifically progressive deficits of brain functional marker in amnestic type mild cognitive impairment. PLoS One. 2011;6(9):e24271. doi: 10.1371/journal.pone.0024271. [DOI] [PMC free article] [PubMed] [Google Scholar]
- Behzadi Y, Restom K, Liau J, Liu TT. A component based noise correction method (CompCor) for BOLD and perfusion based fMRI. Neuroimage. 2007;37(1):90–101. doi: 10.1016/j.neuroimage.2007.04.042. [DOI] [PMC free article] [PubMed] [Google Scholar]
- Bruno J, Hosseini SM, Kesler S. Altered resting state functional brain network topology in chemotherapy-treated breast cancer survivors. Neurobiolology of Disease. 2012;48(3):329–338. doi: 10.1016/j.nbd.2012.07.009. [DOI] [PMC free article] [PubMed] [Google Scholar]
- Cimprich B, Reuter-Lorenz P, Nelson J, Clark PM, Therrien B, Normolle D, Welsh RC. Prechemotherapy alterations in brain function in women with breast cancer. Journal of Clinical and Experimental Neuropsychology. 2010;32(3):324–331. doi: 10.1080/13803390903032537. 913518343 [pii] [DOI] [PubMed] [Google Scholar]
- Craddock RC, Holtzheimer PE, III, Hu XP, Mayberg HS. Disease state prediction from resting state functional connectivity. Magnetic Resonance in Medicine. 2009;62(6):1619–1628. doi: 10.1002/mrm.22159. [DOI] [PMC free article] [PubMed] [Google Scholar]
- de Ruiter MB, Reneman L, Boogerd W, Veltman DJ, Caan M, Douaud G, Schagen SB. Late effects of high-dose adjuvant chemotherapy on white and gray matter in breast cancer survivors: Converging results from multimodal magnetic resonance imaging. Human Brain Mapping. 2012;33(12):2971–2983. doi: 10.1002/hbm.21422. [DOI] [PMC free article] [PubMed] [Google Scholar]
- de Ruiter MB, Reneman L, Boogerd W, Veltman DJ, van Dam FS, Nederveen AJ, Schagen SB. Cerebral hyporesponsiveness and cognitive impairment 10 years after chemotherapy for breast cancer. Human Brain Mapping. 2011;32(8):1206–1219. doi: 10.1002/hbm.21102. [DOI] [PMC free article] [PubMed] [Google Scholar]
- Deprez S, Amant F, Smeets A, Peeters R, Leemans A, Van Hecke W, Sunaert S. Longitudinal assessment of chemotherapy-induced structural changes in cerebral white matter and its correlation with impaired cognitive functioning. Journal of Clinical Oncology. 2012;30(3):274–281. doi: 10.1200/JCO.2011.36.8571. [DOI] [PubMed] [Google Scholar]
- Deprez S, Amant F, Yigit R, Porke K, Verhoeven J, Van den Stock J, Sunaert S. Chemotherapy-induced structural changes in cerebral white matter and its correlation with impaired cognitive functioning in breast cancer patients. Human Brain Mapping. 2011;32(3):480–493. doi: 10.1002/hbm.21033. [DOI] [PMC free article] [PubMed] [Google Scholar]
- Deprez S, Billiet T, Sunaert S, Leemans A. Diffusion tensor MRI of chemotherapy-induced cognitive impairment in non-CNS cancer patients: A review. Brain Imaging and Behavior. 2013 doi: 10.1007/s11682-012-9220-1. [DOI] [PubMed] [Google Scholar]
- Du X, Goodwin JS. Patterns of use of chemotherapy for breast cancer in older women: Findings from Medicare claims data. Journal of Clinical Oncology. 2001;19(5):1455–1461. doi: 10.1200/JCO.2001.19.5.1455. [DOI] [PubMed] [Google Scholar]
- Eberling JL, Wu C, Tong-Turnbeaugh R, Jagust WJ. Estrogen- and tamoxifen-associated effects on brain structure and function. Neuroimage. 2004;21(1):364–371. doi: 10.1016/j.neuroimage.2003.08.037. S1053811903005457 [pii] [DOI] [PubMed] [Google Scholar]
- Eichenbaum H. A cortical-hippocampal system for declarative memory. Nature Reviews Neuroscience. 2000;1(1):41–50. doi: 10.1038/35036213. [DOI] [PubMed] [Google Scholar]
- Ferguson RJ, McDonald BC, Saykin AJ, Ahles TA. Brain structure and function differences in monozygotic twins: Possible effects of breast cancer chemotherapy. Journal of Clinical Oncology. 2007;25(25):3866–3870. doi: 10.1200/JCO.2007.10.8639. 25/25/3866 [pii] [DOI] [PMC free article] [PubMed] [Google Scholar]
- Glover GH, Lai S. Self-navigated spiral fMRI: Interleaved versus single-shot. Magnetic Resonance Medicine. 1998;39(3):361–368. doi: 10.1002/mrm.1910390305. [DOI] [PubMed] [Google Scholar]
- Greicius MD, Flores BH, Menon V, Glover GH, Solvason HB, Reiss AL, Schatzberg AF. Resting-state functional connectivity in major depression: Abnormally increased contributions from subgenual cingulate cortex and thalamus. Biological Psychiatry. 2007;62(5):429–437. doi: 10.1016/j.biopsych.2006.09.020. [DOI] [PMC free article] [PubMed] [Google Scholar]
- Haynes JD, Rees G. Decoding mental states from brain activity in humans. Nature Reviews Neuroscience. 2006;7(7):523–534. doi: 10.1038/nrn1931. [DOI] [PubMed] [Google Scholar]
- Hoeft F, McCandliss BD, Black JM, Gantman A, Zakerani N, Hulme C, Gabrieli JD. Neural systems predicting long-term outcome in dyslexia. Proceedings of the National Academy of Sciences of the United States of America. 2011;108(1):361–366. doi: 10.1073/pnas.1008950108. [DOI] [PMC free article] [PubMed] [Google Scholar]
- Hosseini SM, Koovakkattu D, Kesler SR. Altered small-world properties of gray matter networks in breast cancer. BMC Neurology. 2012;12(1):28. doi: 10.1186/1471-2377-12-28. [DOI] [PMC free article] [PubMed] [Google Scholar]
- Janelsins MC, Kohli S, Mohile SG, Usuki K, Ahles TA, Morrow GR. An update on cancer-and chemotherapy-related cognitive dysfunction: Current status. Seminars in Oncology. 2011;38(3):431–438. doi: 10.1053/j.seminoncol.2011.03.014. 10.1053/j.seminoncol. 2011.03.014. [DOI] [PMC free article] [PubMed] [Google Scholar]
- Jones DT, Machulda MM, Vemuri P, McDade EM, Zeng G, Senjem ML, Jack CR., Jr Age-related changes in the default mode network are more advanced in Alzheimer disease. Neurology. 2011;77(16):1524–1531. doi: 10.1212/WNL.0b013e318233b33d. [DOI] [PMC free article] [PubMed] [Google Scholar]
- Kamitani Y, Tong F. Decoding the visual and subjective contents of the human brain. Nature Neuroscience. 2005;8(5):679–685. doi: 10.1038/nn1444. [DOI] [PMC free article] [PubMed] [Google Scholar]
- Kesler S, Janelsins M, Koovakkattu D, Palesh O, Mustian K, Morrow G, Dhabhar FS. Reduced hippocampal volume and verbal memory performance associated with interleukin-6 and tumor necrosis factor-alpha levels in chemotherapy-treated breast cancer survivors. Brain Behavior and Immunity. 2013;30(Suppl):S109–S116. doi: 10.1016/j.bbi.2012.05.017. [DOI] [PMC free article] [PubMed] [Google Scholar]
- Kesler SR, Bennett FC, Mahaffey ML, Spiegel D. Regional brain activation during verbal declarative memory in metastatic breast cancer. Clinical Cancer Research. 2009;15(21):6665–6673. doi: 10.1158/1078-0432.CCR-09-1227. [DOI] [PMC free article] [PubMed] [Google Scholar]
- Kesler SR, Kent JS, O’Hara R. Prefrontal cortex and executive function impairments in primary breast cancer. Journal of the American Medical Association - Neurology. 2011;68(11):1447–1453. doi: 10.1001/archneurol.2011.245. [DOI] [PMC free article] [PubMed] [Google Scholar]
- Kesler SR, Wefel JS, Hosseini SM, Cheung M, Watson CL, Hoeft F. Default mode network connectivity distinguishes chemotherapy-treated breast cancer survivors from controls. Proceedings of the National Academy of Sciences of the United States of America. 2013;110(28):11600–11605. doi: 10.1073/pnas.1214551110. [DOI] [PMC free article] [PubMed] [Google Scholar]
- Leh SE, Petrides M, Strafella AP. The neural circuitry of executive functions in healthy subjects and Parkinson’s disease. Neuropsychopharmacology. 2010;35(1):70–85. doi: 10.1038/npp.2009.88. [DOI] [PMC free article] [PubMed] [Google Scholar]
- Mar Fan H, Houédé-Tchen N, Chemerynsky I, Yi QL, Xu W, Harvey B. Menopausal symptoms in women undergoing chemotherapy-induced and natural menopause: A prospective controlled study. Annals of Oncology. 2010;21(5):983–987. doi: 10.1093/annonc/mdp394. [DOI] [PubMed] [Google Scholar]
- Marzelli MJ, Hoeft F, Hong DS, Reiss AL. Neuroanatomical spatial patterns in Turner syndrome. Neuroimage. 2011;55(2):439–447. doi: 10.1016/j.neuroimage.2010.12.054. [DOI] [PMC free article] [PubMed] [Google Scholar]
- McDonald BC, Conroy SK, Ahles TA, West JD, Saykin AJ. Gray matter reduction associated with systemic chemotherapy for breast cancer: A prospective MRI study. Breast Cancer Research and Treatment. 2010;123(3):819–828. doi: 10.1007/s10549-010-1088-4. [DOI] [PMC free article] [PubMed] [Google Scholar]
- McDonald BC, Conroy SK, Ahles TA, West JD, Saykin AJ. Alterations in brain activation during working memory processing associated with breast cancer and treatment: A prospective functional magnetic resonance imaging study. Journal of Clinical Oncology. 2012;30(20):2500–2508. doi: 10.1200/JCO.2011.38.5674. [DOI] [PMC free article] [PubMed] [Google Scholar]
- Menon V, Adleman NE, White CD, Glover GH, Reiss AL. Error-related brain activation during a Go/NoGo response inhibition task. Human Brain Mapping. 2001;12(3):131–143. doi: 10.1002/1097-0193(200103)12:3<131::AID-HBM1010>3.0.CO;2-C. [pii] [DOI] [PMC free article] [PubMed] [Google Scholar]
- Mostofsky SH, Schafer JG, Abrams MT, Goldberg MC, Flower AA, Boyce A, Pekar JJ. fMRI evidence that the neural basis of response inhibition is task-dependent. Brain Research. 2003;17(2):419–430. doi: 10.1016/s0926-6410(03)00144-7. [DOI] [PubMed] [Google Scholar]
- Noble WS. What is a support vector machine? Nature Biotechnology. 2006;24(12):1565–1567. doi: 10.1038/nbt1206-1565. [DOI] [PubMed] [Google Scholar]
- O’Dwyer L, Lamberton F, Bokde AL, Ewers M, Faluyi YO, Tanner C, Hampel H. Using support vector machines with multiple indices of diffusion for automated classification of mild cognitive impairment. PLoS One. 2012;7(2):e32441. doi: 10.1371/journal.pone.0032441. [DOI] [PMC free article] [PubMed] [Google Scholar]
- O’Dwyer L, Lamberton F, Matura S, Scheibe M, Miller J, Rujescu D, Hampel H. White matter differences between healthy young ApoE4 carriers and non-carriers identified with tractography and support vector machines. PLoS One. 2012;7(4):e36024. doi: 10.1371/journal.pone.0036024. [DOI] [PMC free article] [PubMed] [Google Scholar]
- O’Toole AJ, Jiang F, Abdi H, Penard N, Dunlop JP, Parent MA. Theoretical, statistical, and practical perspectives on pattern-based classification approaches to the analysis of functional neuroimaging data. Journal of Cognitive Neuroscience. 2007;19(11):1735–1752. doi: 10.1162/jocn.2007.19.11.1735. [DOI] [PubMed] [Google Scholar]
- Orru G, Pettersson-Yeo W, Marquand AF, Sartori G, Mechelli A. Using support vector machine to identify imaging biomarkers of neurological and psychiatric disease: A critical review. Neuroscience Biobehavioral Reviews. 2012;36(4):1140–1152. doi: 10.1016/j.neubiorev.2012.01.004. [DOI] [PubMed] [Google Scholar]
- Pereira F, Mitchell T, Botvinick M. Machine learning classifiers and fMRI: A tutorial overview. Neuroimage. 2009;45(1 Suppl):S199–S209. doi: 10.1016/j.neuroimage.2008.11.007. [DOI] [PMC free article] [PubMed] [Google Scholar]
- Phillips KM, Jim HS, Small BJ, Laronga C, Andrykowski MA, Jacobsen PB. Cognitive functioning after cancer treatment: A 3-year longitudinal comparison of breast cancer survivors treated with chemotherapy or radiation and noncancer controls. Cancer. 2012;118(7):1925–1932. doi: 10.1002/cncr.26432. [DOI] [PMC free article] [PubMed] [Google Scholar]
- Picton TW, Stuss DT, Alexander MP, Shallice T, Binns MA, Gillingham S. Effects of focal frontal lesions on response inhibition. Cerebral Cortex. 2007;17(4):826–838. doi: 10.1093/cercor/bhk031. bhk031 [pii] [DOI] [PubMed] [Google Scholar]
- Reuter-Lorenz PA, Cimprich B. Cognitive function and breast cancer: Promise and potential insights from functional brain imaging. Breast Cancer Research and Treatment. 2013;137(1):33–43. doi: 10.1007/s10549-012-2266-3. [DOI] [PubMed] [Google Scholar]
- Rice ME, Harris GT. Comparing effect sizes in follow-up studies: ROC Area, Cohen’s d, and r. Law and Human Behavior. 2005;29(5):615–620. doi: 10.1007/s10979-005-6832-7. [DOI] [PubMed] [Google Scholar]
- Rodin G, Ahles TA. Accumulating evidence for the effect of chemotherapy on cognition. Journal of Clinical Oncology. 2012;30(29):3568–3569. doi: 10.1200/JCO.2012.43.5776. [DOI] [PubMed] [Google Scholar]
- Scherling C, Collins B, Mackenzie J, Bielajew C, Smith A. Pre-chemotherapy differences in visuospatial working memory in breast cancer patients compared to controls: An FMRI study. Frontiers in Human Neuroscience. 2011;5:122. doi: 10.3389/fnhum.2011.00122. [DOI] [PMC free article] [PubMed] [Google Scholar]
- Scherling C, Collins B, Mackenzie J, Bielajew C, Smith A. Prechemotherapy differences in response inhibition in breast cancer patients compared to controls: A functional magnetic resonance imaging study. Journal of Clinical and Experimental Neuropsychology. 2012;34(5):543–560. doi: 10.1080/13803395.2012.666227. [DOI] [PubMed] [Google Scholar]
- Sheline YI, Raichle ME, Snyder AZ, Morris JC, Head D, Wang S, Mintun MA. Amyloid plaques disrupt resting state default mode network connectivity in cognitively normal elderly. Biological Psychiatry. 2010;67(6):584–587. doi: 10.1016/j.biopsych.2009.08.024. [DOI] [PMC free article] [PubMed] [Google Scholar]
- Silverman DH, Dy CJ, Castellon SA, Lai J, Pio BS, Abraham L, Ganz PA. Altered frontocortical, cerebellar, and basal ganglia activity in adjuvant-treated breast cancer survivors 5–10 years after chemotherapy. Breast Cancer Research and Treatment. 2007;103(3):303–311. doi: 10.1007/s10549-006-9380-z. [DOI] [PubMed] [Google Scholar]
- Simmonds DJ, Pekar JJ, Mostofsky SH. Meta-analysis of Go/No-go tasks demonstrating that fMRI activation associated with response inhibition is task-dependent. Neuropsychologia. 2008;46(1):224–232. doi: 10.1016/j.neuropsychologia.2007.07.015. S0028-3932(07)00268-0 [pii] [DOI] [PMC free article] [PubMed] [Google Scholar]
- Stilley CS, Bender CM, Dunbar-Jacob J, Sereika S, Ryan CM. The impact of cognitive function on medication management: Three studies. Health Psychology. 2010;29(1):50–55. doi: 10.1037/a0016940. [DOI] [PMC free article] [PubMed] [Google Scholar]
- Swick D, Ashley V, Turken AU. Left inferior frontal gyrus is critical for response inhibition. BMC Neuroscience. 2008;9:102. doi: 10.1186/1471-2202-9-102. [DOI] [PMC free article] [PubMed] [Google Scholar]
- Tzourio-Mazoyer N, Landeau B, Papathanassiou D, Crivello F, Etard O, Delcroix N, Joliot M. Automated anatomical labeling of activations in SPM using a macroscopic anatomical parcellation of the MNI MRI single-subject brain. Neuroimage. 2002;15(1):273–289. doi: 10.1006/nimg.2001.0978S1053811901909784. [DOI] [PubMed] [Google Scholar]
- Vardy J. Cognitive function in breast cancer survivors. Cancer Treatment Research. 2009;151:387–419. doi: 10.1007/978-0-387-75115-3_24. [DOI] [PubMed] [Google Scholar]
- Wefel JS, Saleeba AK, Buzdar AU, Meyers CA. Acute and late onset cognitive dysfunction associated with chemotherapy in women with breast cancer. Cancer. 2010;116(14):3348–3356. doi: 10.1002/cncr.25098. [DOI] [PubMed] [Google Scholar]
- Wefel JS, Schagen SB. Chemotherapy-related cognitive dysfunction. Current Neurological and Neuroscience Reports. 2012;12(3):267–275. doi: 10.1007/s11910-012-0264-9. [DOI] [PubMed] [Google Scholar]
- Whitfield-Gabrieli S, Nieto-Castanon A. Conn: A functional connectivity toolbox for correlated and anticorrelated brain networks. Brain Connectivity. 2012;2(3):125–141. doi: 10.1089/brain.2012.0073. [DOI] [PubMed] [Google Scholar]
- Zeng LL, Shen H, Liu L, Wang L, Li B, Fang P, Hu D. Identifying major depression using whole-brain functional connectivity: A multivariate pattern analysis. Brain. 2012;135(Pt 5):1498–1507. doi: 10.1093/brain/aws059. [DOI] [PubMed] [Google Scholar]
- Zhang D, Shen D. Multi-modal multi-task learning for joint prediction of multiple regression and classification variables in Alzheimer’s disease. Neuroimage. 2012;59(2):895–907. doi: 10.1016/j.neuroimage.2011.09.069. [DOI] [PMC free article] [PubMed] [Google Scholar]
- Zhang D, Wang Y, Zhou L, Yuan H, Shen D. Multimodal classification of Alzheimer’s disease and mild cognitive impairment. Neuroimage. 2011;55(3):856–867. doi: 10.1016/j.neuroimage.2011.01.008. [DOI] [PMC free article] [PubMed] [Google Scholar]