Abstract
The enrichment and isolation of rare cells from complex samples, such as circulating tumor cells (CTCs) from whole blood, is an important engineering problem with widespread clinical applications. One approach uses a microfluidic obstacle array with an antibody surface functionalization to both guide cells into contact with the capture surface and to facilitate adhesion; geometrically enhanced differential immunocapture is a design strategy in which the array is designed to promote target cell–obstacle contact and minimize other interactions (Gleghorn et al., 2010; Kirby et al., 2012). We present a simulation that uses capture experiments in a simple Hele-Shaw geometry (Santana et al., 2012) to inform a target-cell-specific capture model that can predict capture probability in immunocapture microdevices of any arbitrary complex geometry. We show that capture performance is strongly dependent on the array geometry, and that it is possible to select an obstacle array geometry that maximizes capture efficiency (by creating combinations of frequent target cell–obstacle collisions and shear stress low enough to support capture), while simulatenously enhancing purity by minimizing non-specific adhesion of both smaller contaminant cells (with infrequent cell–obstacle collisions) and larger contaminant cells (by focusing those collisions into regions of high shear stress).
Keywords: immunocapture, rare cell capture, circulating tumor cell, CTC, LNCaP, prostate cancer, GEDI, microfluidic, microdevice
1 Introduction
The capture of rare cells from complex samples, such as circulating tumor cells (CTCs) from whole blood, is an important engineering challenge with a wide range of clinical applications. Recent work has successfully isolated CD34-positive endothelial stem (Zhu et al., 2013) and progenitor cells (Hatch et al., 2011), and CTCs from cancer patients (Hsieh et al., 2006; Nagrath et al., 2007; Talasaz et al., 2009; Stott et al., 2010; Gleghorn et al., 2010) with microfluidic devices. These devices can be divided into two major categories: pressure-driven devices and those that also use electrokinetic techniques (primarily dielectrophoresis). Within the former, cells can be isolated by size-based sorting (deterministic lateral displacement (Inglis et al., 2006; Davis et al., 2006; Frechette and Drazer, 2009; Loutherback et al., 2010), inertial sheath flows (Wu et al., 2009)), size- and stiffness-based filtration (Zheng et al., 2007; Lin et al., 2010), and through antibody-mediated surface capture. Pratt et al. (2011) present a review of these devices; Smith et al. (2012) review the fundamental transport mechanisms that determine their performance.
This work focuses on the subset of rare cell capture microfluidic devices that use an array of antibody-terminated obstacles to form their capture surface, and details simulations to optimize their geometries. One such optimization strategy has been termed geometrically enhanced differential immunocapture (GEDI) (Gleghorn et al., 2010), in which an array of obstacles is designed so that capture efficiency is maximized by displacing target cells (e.g., CTCs) onto streamlines that result in subsequent cell–obstacle collisions, while contaminant cells (e.g., leukocytes) are displaced onto streamlines that avoid additional cell–obstacle interactions.
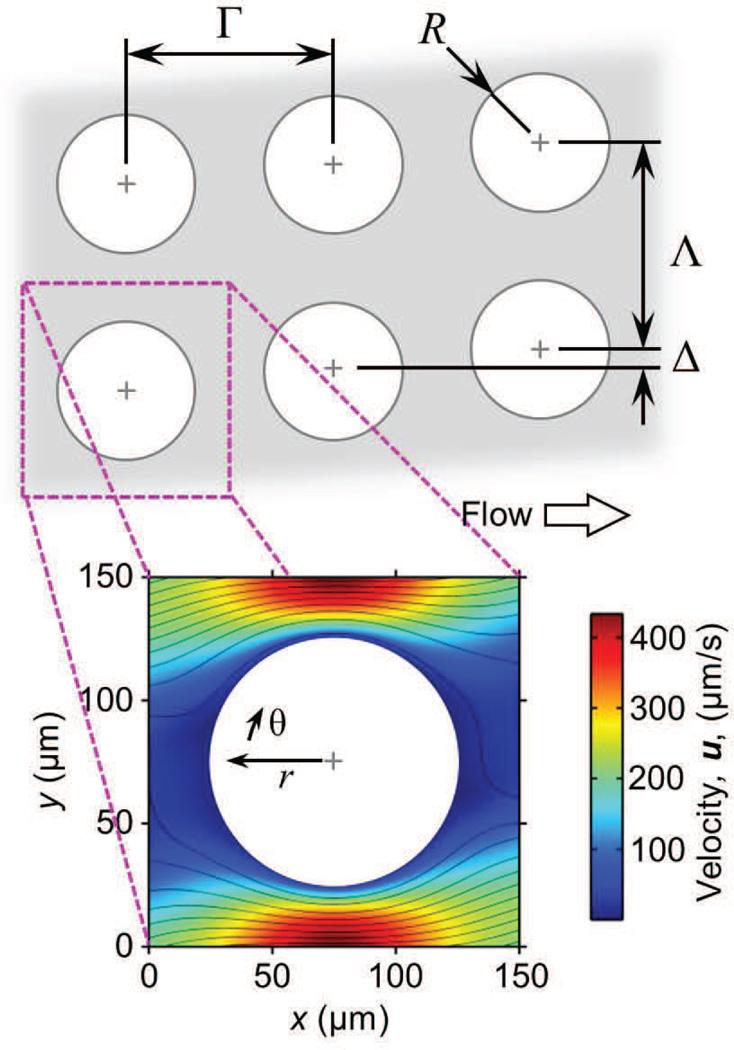
Such an array is shown in Figure 1, in which cell–obstacle collisions are governed by the spacing between rows (Γ) and columns of obstacles (Λ), the obstacle (R) and cell radius (a), and the array offset (Δ). Figure 1 shows a “unit structure”, the smallest unit of the array, consisting of one obstacle and the velocity field around it; a unit structure has symmetric boundaries and can be arrayed as needed to simulate a device of any size.
Fig. 1.
Cell collision and capture events in microfluidic 2D arrays of cylindrical obstacles are governed by the array geometry, cell size, cell and surface chemistry, and flow rate (and thus local velocity and shear stress). Large arrays minimize edge effects and can be divided into “unit structures” with symmetric boundaries; these unit structures can be repeated as needed to simulate arrays of arbitrary size. The velocity field shown here is for a Γ = Λ = 150 µm array with Δ = 22 µm, 2r = 100 µm and a mean velocity of 100 µm/s.
Within these microdevices, the force on a spherical particle in Stokes flow in the bulk fluid (i.e., far from a wall) is given by
| (1) |
were μ is the fluid viscosity and U is the velocity at the particle center. Near a wall, there is a correction
| (2) |
where d is the distance from the particle center to the wall (Batchelor, 1967). As contact occurs, d → a, and . We linearize the velocity distribution near the wall, and treat the dislodging force on a cell in contact with an obstacle as proportional to the local transverse shear stress, τ, which is calculated as
| (3) |
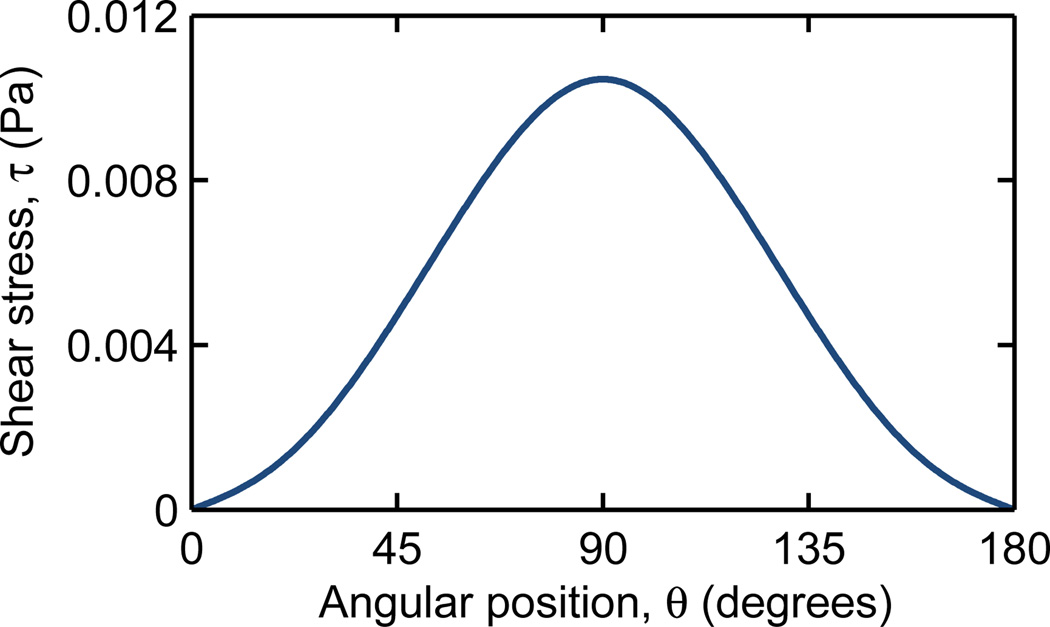
where Uθ is the velocity tangential to the obstacle surface. The shear stress is zero near leading and trailing edges and is greatest at the shoulder, where the velocity gradient is largest (Fig 2).
Fig. 2.
For a cell in contact with the obstacle surface, the local shear stress, τ, ranges from zero at the leading and trailing edges (θ = 0° and 180°, respectively) to a maximum at the shoulder (θ = 90°). The shear stress shown here is for a representative array of Γ = Λ = 200 µm with Δ = 0 µm, a mean velocity of 100 µm/s, and a 2a = 18 µm LNCaP cell.
We consider this dislodging force and the frequency of collisions between cells and the capture surfaces with coupled computational fluid dynamics (CFD), particle advection, and capture simulations for the identification of GEDI-optimized array geometries and the design of high efficiency and high purity microfluidic rare cell capture devices. These simulations are informed by shear stress-dependent experimental capture data, collected in a Hele-Shaw geometry (Santana et al., 2012), allowing data from a simple device to be used to study arbitrarily complex geometries.
2 Modeling cell capture
Cell adhesion models include mechanical-force responses, cell adhesion kinetics, mechanics, and modes (Bell et al., 1984; Dembo et al., 1988), and cell deformation and biomolecule deformation and rearrangement (Dustin et al., 1996; Zhu et al., 2000). The most sophisticated simulations consider these parameters and predict capture, rolling, and release events. Upon adhesion to a surface, local forcing, reduced cell velocity, and long residence times result in cell adherence owing to continued bond formation (Dong and Lei, 2000) or to cell rolling owing to a series of bond formations and disassociations (Lawrence and Springer, 1991; Orsello et al., 2001).
Predicting cell adhesion probabilities and modes with detailed models requires a priori knowledge, or at least estimates, of many parameters (e.g. reaction rate coefficients, receptor densities, etc.); this information is often unavailable, especially in cases of rare, heterogeneous cells. In various models, as in the physical system, many parameters are codependent (Dembo et al., 1988; Dong and Lei, 2000). Additionally, computational approaches require models for various physical parameters (e.g. harmonic potentials for bond strengths (Saad and Schultz, 1986; Dembo et al., 1988; Luo et al., 2011), cell mechanical properties (Zhu et al., 2000; N’Dri et al., 2003), and simplified fluid properties (Das et al., 2000; Smith et al., 2012)) and must make many assumptions (e.g. periodic and uniform surfaces (Saintillan et al., 2005), continuum fields to represent concentrated suspension (Baier et al., 2009), and simplified geometries (Das et al., 2000)).
Because detailed parameters are largely unavailable for rare cell capture applications, reduced-order models are a logical engineering approach. Decuzzi and Ferrari (2006) present a relatively simple exponential capture model for cell capture in a linear shear flow, which was successfully used to study CTC capture in microfluidic devices by Wan et al. (2011). This model predicts the probability of adhesion in a simple channel as
| (4) |
where mr and ml are the receptor and ligand surface densities, the receptor–ligand association constant at zero load, Ac the contact area, λ the characteristic receptor–ligand bond length, kBT the thermal energy, and Fdislodge the dislodging force. Rather than determining each of these parameters, we grouped them into two lumped parameters,
| (5) |
and
| (6) |
which are experimentally determined constants specific to each combination of cell and surface chemistry. We linearized Fdislodge as proportional to τ near the wall, and discretized the model as
| (7) |
where dt is the time that a cell is in contact.
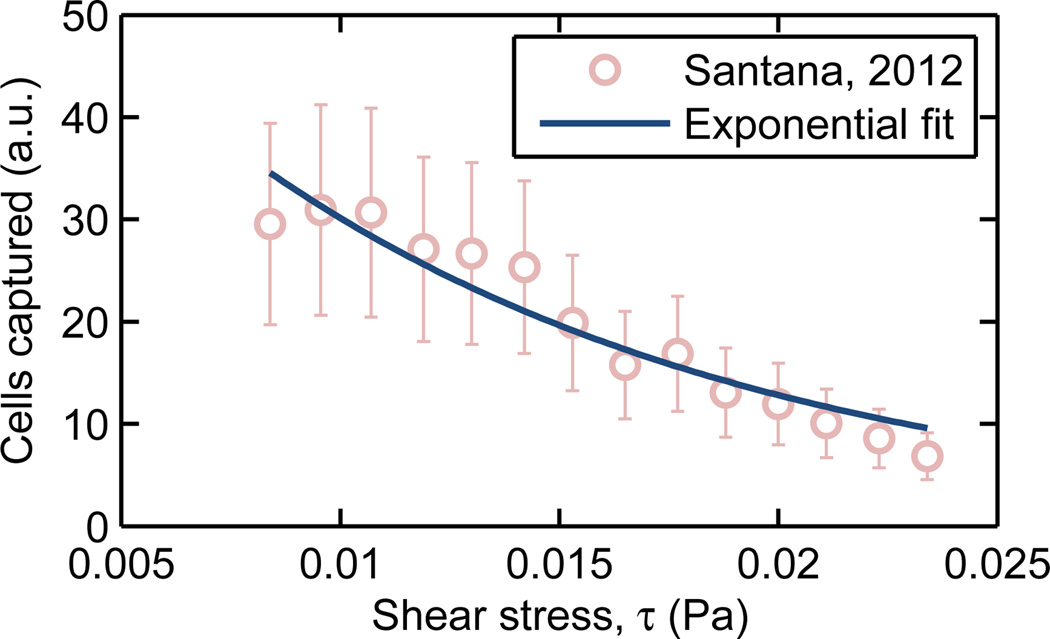
We selected LNCaP immortalized human prostate adenocarcinoma cells as a model rare cell, and determined A and B for these cells in contact with surfaces functionalized with J591, a monoclonal antibody that targets the prostate-specific membrane antigen (PSMA) expressed on LNCaP cells. Santana et al. (2012) used a Hele-Shaw microfluidic device, consisting of a shallow and wide chamber that expands so as to create a region of monotonically-decreasing shear stress from the inlet to the outlet, and reported LNCaP capture on a surface saturated with J591 as a function of shear stress. Figure 3 shows this experimental data and a simple exponential fit, which yields a value of B = 85.5 Pa−1.
Fig. 3.
The shear stress-dependent capture of LNCaP cultured prostate cancer cells on a J591 surface chemistry was determined by Santana et al. (2012). Fitting this data to an exponential capture model (eqn. 7) results in B = 85.5 Pa−1.
The constant A determines cell capture at a given shear stress. Gleghorn et al. (2010) report an overall capture of approximately 70% for LNCaPs and J591 in a GEDI device with Γ = Λ = 200 µm, Δ = 7 µm. This geometry was simulated as described in Section 3 for LNCaP-sized cells (2a = 17.5 ± 1.5 µm (Zheng et al., 2007)), iterating on A until 70% capture was predicted; A = 3.44 × 10⁻² s−1 was the result. We approximated A and B as independent of 2a; a more sophisticated Hele-Shaw experiment could group cells into different size distributions and use A(2a) and B(2a) for the capture probability model.
This modeling approach allows for the result of one experiment, performed in a known Hele-Shaw geometry, to inform A and B for each specific combination of cell and surface chemistry. The resulting capture model lumps together many effects (such as the balance between lubrication forces, cell and obstacle surface irregularities, and van der Waals attraction) into two experimentally-determined parameters and permits the computationally efficient study of a large design space.
3 Computational methods
A CFD–particle advection simulation was developed to track cells of various sizes through a range of obstacle array geometries, calculating when cell–obstacle contact occurred and the likelihood that a given collision results in capture. The simulation workflow consisted of three discrete steps performed in series.
3.1 Computational fluid dynamics (CFD) simulations
COMSOL Multiphysics (COMSOL, Inc.; Burlington, MA, USA) was used to solve the two–dimensional Navier–Stokes equations and compute the fluid velocity field in each obstacle array geometry. A subdomain of 5 by 20 obstacle unit structures was simulated, with this subdomain size chosen based on the results of a convergence study on the removal of edge effects. The boundary conditions consisted of a uniform inlet velocity, U; a zero-pressure outlet on the opposite end; and symmetry boundary conditions on the sides. U = 100 µm/s was used for all inlet velocities, consistent with a 0.612 mL/hr flow rate in the 8.5 mm wide and 200 µm deep “GEDI chip” first described in Gleghorn et al. (2010) and resulting in a Reynolds number of
| (8) |
where ρ = 1000 kg/m3 and μ = 1 mPa·s represent the bulk density and viscosity, respectively.
The x- and y-velocity components of the center obstacle unit structure were interpolated onto a regular grid and saved; this unit structure has symmetrical boundaries and was arrayed in later steps to simulate a device of any arbitarily large length and width.
3.2 Cell–obstacle collision simulations
A custom, parallelized particle advection simulation was developed in MATLAB (The MathWorks, Inc.; Natick, MA, USA) to track cells through each obstacle array. In this system, advection dominates diffusion (Pe, the Péclet number, ≫ 1), and particle inertial effects are negligible (St, the Stokes number, ≪ 1). As such, the cells were modeled as Lagrangian tracers, tracing the fluid streamlines unless a cell–obstacle collision occurred, at which point a no-penetration condition was enforced. A device 100 columns long was simulated by arraying unit structures as previously described, with cells entering the array evenly spaced 5 µm apart (this spacing was chosen as it resulted in the mean collision frequency being independent of the cells’ initial positions) and advected through the array by use of a fourth-order Runge-Kutta integration scheme with adaptive time stepping.
The number of collisions was averaged for each cell starting point and over the length of the device, and is reported as the mean collision frequency for that cell size and array geometry. Additionally, at each timestep for which a cell was in contact with an obstacle, the angular position (with respect to the nearest obstacle), the local shear stress, and the duration of contact was recorded for later use in calculating capture.
3.3 Cell capture Monte Carlo simulations
To calculate capture, the discrete capture probability,
| (9) |
(where dt is the timestep length, τ is the local shear stress, and the constants A = 3.44 × 10⁻² s−1 and B = 85.5 Pa−1 were calculated as described in Section 2) was calculated for every timestep where cell–obstacle contact occurred. This discrete probability was compared to a psuedorandom number, dPrandom; if dPcapture ≥ dPrandom, that cell was “captured.” This stochastic process was repeated for N = 1000 replicates per initial position (determined based on a convergence study) and the averaged value is presented as the mean capture probability for each combination of cell size and obstacle array geometry.
4 Experimental methods
The Γ = Λ = 200 µm, Δ = 7 µm GEDI device reported in Gleghorn et al. (2010) was used to capture LNCaP prostate cancer cells. The captured cells were fixed, stained, and their angular position with respect to the obstacles’ leading edge was calculated.
4.1 Capture experiments
Microdevice preparation
The GEDI devices were functionalized with monoclonal J591 antibody (provided by Dr. Neil Bander, Weill Cornell Medical College) as described in Kirby et al. (2012). The devices were then sealed with 3 mm thick Polydimethylsiloxane (PDMS, 7:1 base:curing agent) gaskets held in place with a compression jig. Working fluids enter and exit the device through 15 cm pieces of 0.020 inch ID Tygon tubing (Saint-Gobain) installed at the entrance and exit ports of the device using 7 mm segments of 23 gauge stainless steel tubing threaded through holes formed in the PDMS gaskets at the locations of the ports.
Cell preparation
LNCaP cells were cultured in T75 tissue culture treated flasks (Corning). The cells were incubated at 37°C in RPMI-1640 culture media supplemented with 10% Fetal Bovine Serum and 1% Penicillin-Streptomycin. Upon reaching confluence the cells were treated with trypsin and resuspended at a density of 1.5 × 10³ cells/mL in a carrier solution consisting of Dulbecco’s phosphate buffered saline with 1% bovine serum albumin and 1 mM ethylenediaminetetraacetic acid.
Microfluidic capture procedure
A three-way stopcock (Baxter) with one female and two male luer-lock ports was fitted with two 3 mL syringes (BD) and one blunt needle mounted to a male luer-lock fixture. The Tygon tubing extending from the entrance port of the assembled GEDI device was attached to the blunt needle. Initially, one syringe is filled with deionized water while the other was filled with cell-free carrier solution. The syringe containing the DI water, with the stopcock assembly attached, was fitted into a syringe pump (Chemyx, Inc.) set to a flow rate of 1.0 mL/hr. This flow rate was maintained in all subsequent steps. DI water was flowed for 15 minutes, after which the syringes were swapped (without removal from the stopcock assembly) and carrier solution was flowed for another 15 minutes. At this point the syringe containing DI water was removed from the stopcock and replaced with an identical syringe containing 1 mL of the pre-prepared cell suspension. This suspension was run for 1 hour, thus flowing the entire volume of the suspension through the device. Finally, cell-free carrier solution was again flowed for 15 minutes to ensure that the dead volume of the stopcock that may contain any residual cell suspension was flushed.
Fixing and staining cells
Upon completion of the capture procedure, the compression jig was disassembled and the PDMS gasket was carefully removed from the GEDI microchip. The captured cells were then fixed on-chip by incubating for 15 minutes in PHEMO fixative (PHEMO buffer: PIPES acid, HEPES acid, EGTA disodium salt, Mg-Cl2-6H2O, 10% DMSO) with 2% formaldehyde. The cells were permeabilized with 0.1% Triton X-100 (Sigma-Aldrich) in PBS and stained with DAPI (Invitrogen). The microchips were then mounted onto glass coverslips with Mowiol.
4.2 Image analysis
A Zeiss LSM 5 Live Confocal Microscope with a 10×, 0.3 NA objective was used to image the capture surface of the GEDI chip. Individual fields of view were tiled into one composite image of the entire chip at four vertical slices. Images were acquired with two different optical settings: one collecting backscatter from the laser to image the reflection from the tops of the obstacles in the GEDI device and the other with a 405 nm excitation laser and a 415–480 nm bandpass emission filter to image the fluorescence from the DAPI nuclear stain.
A MATLAB script was used to take a maximum intensity projection of each image tile along the depth of the chip and stitched the tiles into a large, two-dimensional, two-channel image. To isolate obstacle-sized features in the backscatter channel and cell nucleus-sized features (6–10 µm) in the DAPI channel, the script filtered each channel with a correspondingly tuned difference-of-gaussians kernel. The script then found the locations and intensities of local maxima in the DAPI and backscatter channels, and a user-set brightness threshold eliminated insufficiently bright local maxima (i.e., peaks that arose from noise rather than obstacles or cells). All sufficiently bright backscatter maxima were assumed to be centers of obstacles and all sufficiently bright DAPI maxima were assumed to be centers of LNCaP cells. The script then determined the location of the nearest obstacle center to the cell and defined a set of local coordinates of each cell relative to the nearest obstacle center.
5 Results and Discussion
Here we present one design study as an illustrative example of the model described in Section 3, and discuss conclusions applicable to a wide range of target cells and surface chemistries. We consider the capture of prostate cancer cells with the goal of maximizing capture efficiency while simulatenously rejecting contaminating cells through a combination of shear stress and cell size, both large and small.
5.1 Simulations
Given the large parameter space (Γ, Λ, Δ, a, r), we restricted our study to devices 100 obstacles long and with spacings of Γ = Λ = 150 µm and R = 50 µm obstacles. This results in a 50 µm gap between obstacles, which is large enough to avoid clogging but still minimizes the overall device length. We normalized these length scales by the row spacing, Γ, so that they may be applied to other geometries as long as the flow rate is also scaled accordingly.
Identifying high-efficiency geometries
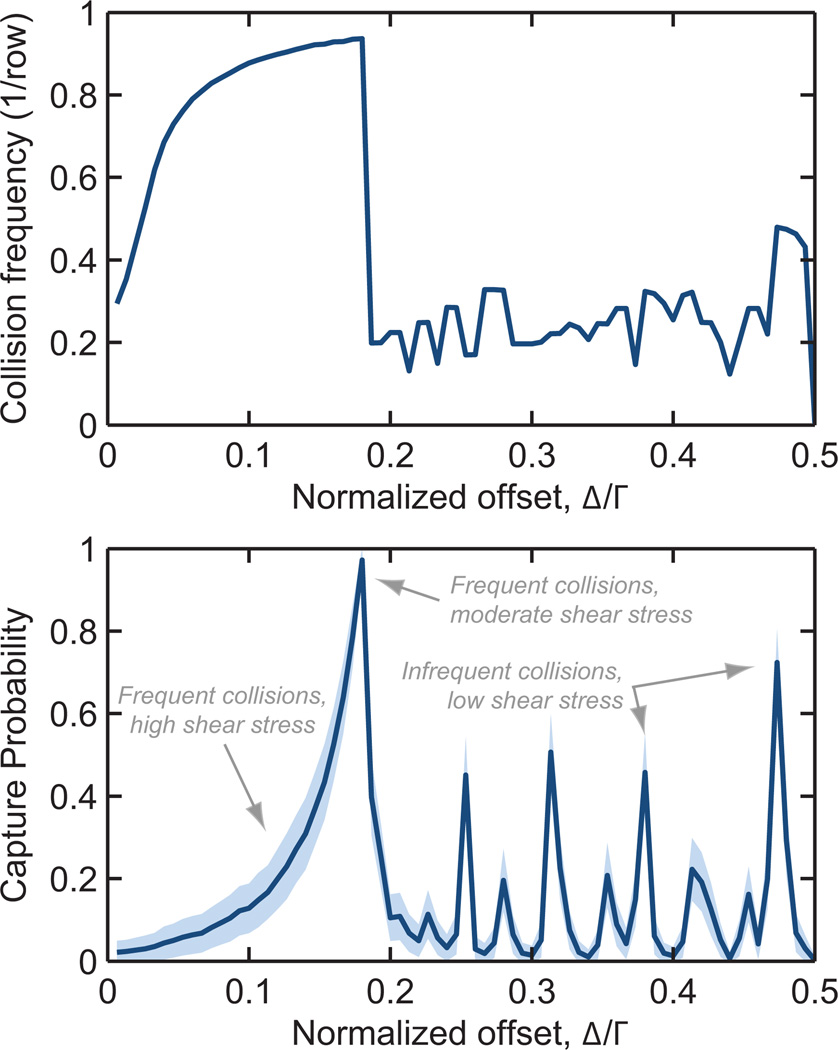
The first design objective for a rare cell capture device is to isolate the target cells at high efficiency. Toward that end, we studied LNCaP collision and capture performance for normalized offsets ranging from Δ/Γ = 0 (a straight array) to 0.5 (a hexagonal array). Figure 4 shows these results for the geometry described above and a mean flow rate of 100 µm/s.
Fig. 4.
Collision frequency (top) and capture probability (bottom) as a function of offset, Γ, for a 2a = 18 µm diameter LNCaP cell in a 100 row device at 100 µm/s mean velocity. Γ = Λ = 150 µm, R = 50 µm. Shaded region represents one standard deviation for 3 × 10⁴ simulated cells.
We note several trends that are broadly applicable: First, Δ/Γ = 0 and 0.5 result in cells being displaced onto streamlines which do not result in additional cell–obstacle collisions, resulting in low collision frequencies and correspondingly low capture rates.
Second, as Δ/Γ increases from zero, the collision frequency increases to a maximum. As the distribution of cells enters the device, they must travel through a finite number of unit structures before colliding with the first obstacle. An array with Δ/Γ = 0 results in some cells never having a collision; as the offset increases from zero, a cell travels through fewer unit structures before its first collision. This trend is exacerbated in shorter devices.
Third, the abrupt transition from the maximum collision frequency to lower values occurs as the cells transition from colliding on the offset-side of each subsequent obstacle to a more complex “zig-zag” collision trajectory; for Δ/Γ larger than this “critical offset”, the sharp transitions in collision frequency for varying Δ/Γ are a result of the collision pattern changing from one discrete combination of collisions and misses to another. Some of these collision patterns focus cells near the leading edge, where shear stress is low and residence time high, resulting in spikes in the capture probability curve.
Finally, capture probability increases with increasing Δ/Γ, a result of cells being more broadly distributed across the obstacle’s leading edge at larger Δ/Γ, as compared to being concentrated in the high-shear-stress shoulder region at small Δ/Γ.
Recalling our first design objective of capturing prostate cancer cells at high efficiency, we select an offset of Δ/Γ = 0.18 and turn to our second objective, maximizing sample purity.
Rejecting contaminating cells
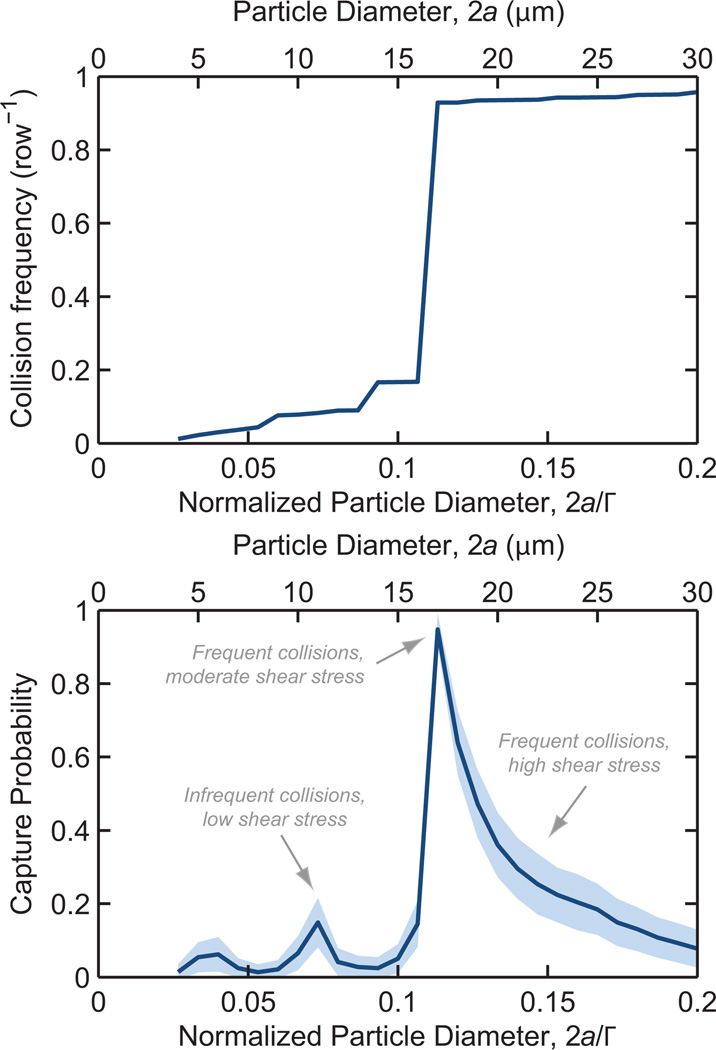
Purity is enhanced by minimizing contaminant–obstacle collisions and, when a collision does occur, engineering the geometry so that it occurs in a region of high shear stress where capture is unlikely to occur. Figure 5 shows collision rates and capture probability with a Δ/Γ = 0.18 geometry. Following a collision with an obstacle, contaminating cells smaller than a “critical diameter” of 2a = 17 µm are displaced onto streamlines that do not impinge on subsequent obstacles, leading to a near-zero collision frequency and a subsequently low capture probability—this is in contrast with straight and hexagonal arrays (Nagrath et al., 2007; Hatch et al., 2011) (Δ/Γ = 0 and 0.5, respectively), which do not have size-dependent collision frequencies. Large contaminating cells have frequent collisions but these interactions are focused near the obstacle shoulder, where shear stress is highest and the residence time is shortest. Contaminating cells of the same size as the target cells have the same collision frequeny, but are partially rejected from capture via the immunospecificity of the antibody functionalization.
Fig. 5.
Collision frequency (top) and capture probability (bottom) as a function of particle diameter, 2a, for a 100 row device at a 100 µm/s mean velocity. Δ/Γ = 16.67, Γ = Λ = 150 µm, R = 50 µm. Shaded region represents one standard deviation for 3 × 10⁴ simulated cells.
5.2 Experimental Verification
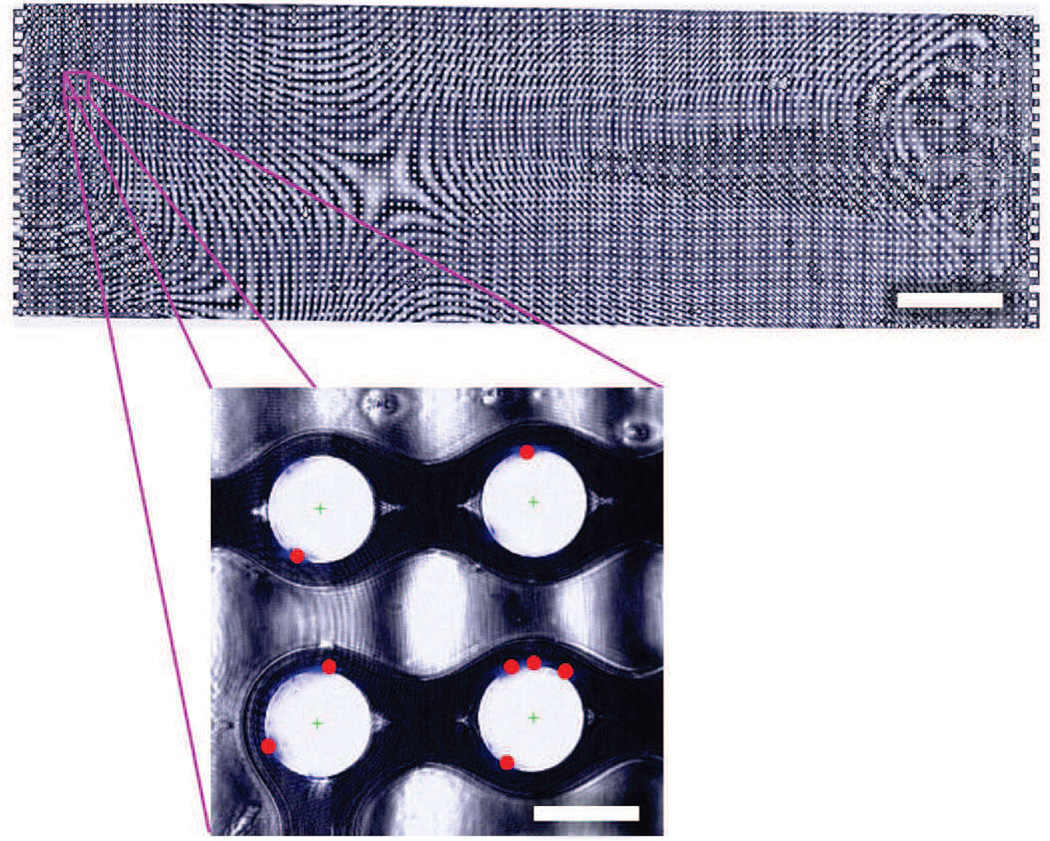
In addition to the aggregate capture probabilities described above, the model predicts capture location on the obstacle with respect to the leading edge. We compare these predictions to experimental capture data, extracted from microscopy images such as those in Figure 6, to validate the simulation.
Fig. 6.
False-color composite brightfield image of a complete GEDI device (scale bar: 3 mm), with inset showing DAPI-stained LNCaP nuclei (blue) and automatically calculated cell centers (red dots) in a region of four obstacles (inset scale bar: 100 µm). Note that the interference pattern observed is a result of slight thickness nonuniformities following mounting.
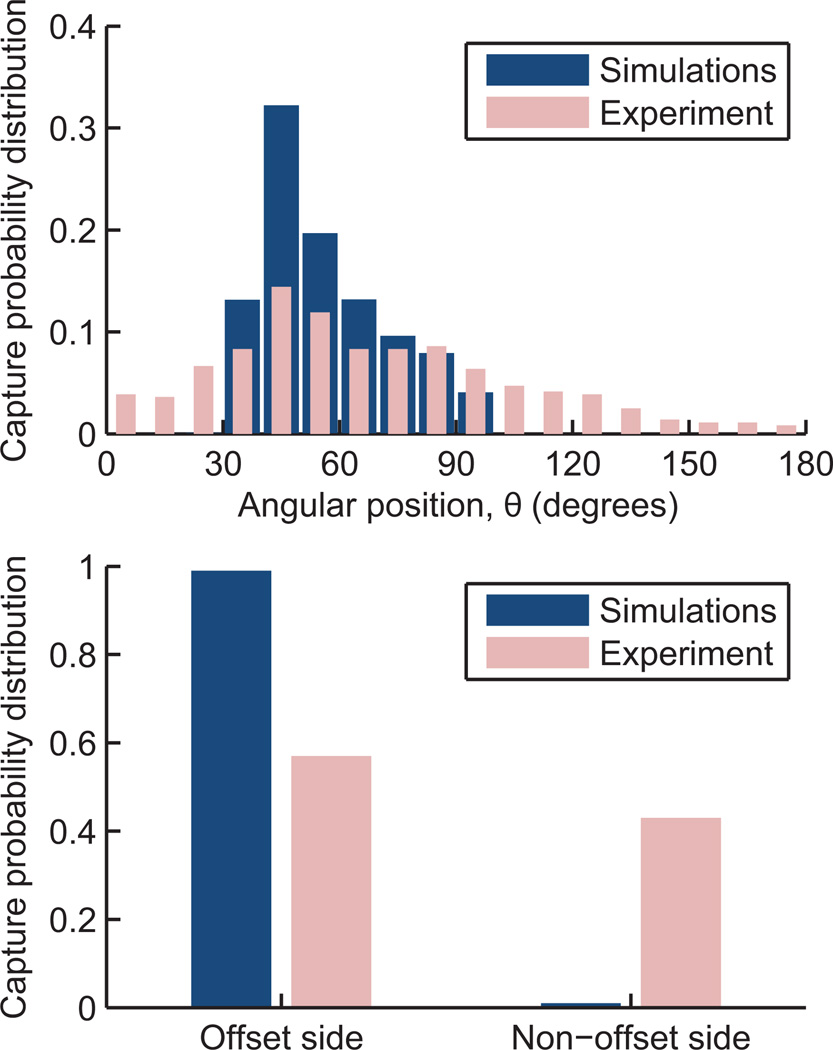
The experimental capture results agree with the trends observed in the simulations. Most capture is observed in a region 30–90° from the leading edge of the obstacle, with a bias toward the leading edge, where shear stress is lower than at the shoulder (Figure 7, top). The experimental results show a broader distribution owing to non-uniformities in cell size as well as the effect of captured cells on both the fluid flow and other cells. Additionally, the GEDI chip (Gleghorn et al., 2010) used in the experiments reverses offset direction every 10 rows, so as to not systematically offset cells toward one side of the device. This reversal cannot be simulated using the single obstacle unit structure approach described in Section 3, resulting in additional entrance transition effects beyond what is captured in the simulations. Although the reversal does not affect the shear stress encountered (and thus the capture probability distribution from the leading edge), it does result in some cells being captured on the non-offset side of the obstacle (Figure 7, bottom). This redistribution of some cells to the non-offset side of the obstacles also has the beneficial effect of increasing the usable capture area of the device.
Fig. 7.
Simulated and experimental capture probability distributions as a function of angular position from the leading edge (top). Reversal in the offset direction in the experiments does not affect the distribution from the leading edge, but does redistribute some cells to the non-offset side of the obstacle (bottom), an effect not captured in the simulations.
6 Conclusion
This work has developed a simulation for the collision and capture of rare cells in microfluidic obstacle arrays, and shown that both collision frequency and shear stress at each collision are important for the optimization of these immunocapture devices. Using LNCaP prostate cancer cells as an illustrative design study, we have identified a high-efficiency geometry which has many LNCaP–obstacle collisions at moderate shear stress but infrequent contaminant–obstacle collisions (for small contaminant cells). The simulation uses one experiment evaluating capture at many shear stresses to inform the study of arbitrarily complex geometries, and is readily adaptable to other target cells and surface chemistries. These simulations are validated by a comparison between simulated and experimentally observed capture distributions as a function of angular position around the obstacle surfaces.
Acknowledgements
The work described was partially supported by the Cornell Center on the Microenvironment & Metastasis through Award Number U54CA143876 from the National Cancer Institute, Sanofi U.S., the National Science Foundation Graduate Research Fellowship Program (T.L.), the Cornell NSF GK-12 program (S.S.), and the Cornell Sloan Fellowship (S.S.).
Contributor Information
James P. Smith, Sibley School of Mechanical and Aerospace Engineering, Cornell University, Ithaca, NY, 14853, USA
Timothy B. Lannin, Sibley School of Mechanical and Aerospace Engineering, Cornell University, Ithaca, NY, 14853, USA
Yusef A. Syed, Sibley School of Mechanical and Aerospace Engineering, Cornell University, Ithaca, NY, 14853, USA
Steven M. Santana, Sibley School of Mechanical and Aerospace Engineering, Cornell University, Ithaca, NY, 14853, USA
Brian J. Kirby, Sibley School of Mechanical and Aerospace Engineering, Cornell University, Ithaca, NY, 14853, USA; Division of Hematology and Medical Oncology, Department of Medicine, Weill Medical College of Cornell University, New York, NY, 10065, USA.
References
- Baier T, Mohanty S, Drese KS, Rampf F, Kim J, Schoenfeld F. Modelling immunomagnetic cell capture in CFD. Microfluid Nanofluid. 2009;7(2):205–216. [Google Scholar]
- Batchelor GK. An Introduction to Fluid Dynamics. Cambridge: 1967. [Google Scholar]
- Bell GI, Dembo M, Bongrand P. Cell adhesion. competition between nonspecific repulsion and specific bonding. Biophys J. 1984;45(6):1051–1064. doi: 10.1016/S0006-3495(84)84252-6. [DOI] [PMC free article] [PubMed] [Google Scholar]
- Das B, Johnson P, Popel A. Computational fluid dynamic studies of leukocyte adhesion effects on non-Newtonian blood flow through microvessels. Biorheology. 2000;37(3):239–258. [PubMed] [Google Scholar]
- Davis J, Inglis D, Morton K, Lawrence D, Huang L, Chou S, Sturm J, Austin R. Deterministic hydrodynamics: Taking blood apart. Proc Natl Acad Sci USA. 2006;103(40):14,779–14,784. doi: 10.1073/pnas.0605967103. [DOI] [PMC free article] [PubMed] [Google Scholar]
- Decuzzi P, Ferrari M. The adhesive strength of non-spherical particles mediated by specific interactions. Biomaterials. 2006;27(30):5307–5314. doi: 10.1016/j.biomaterials.2006.05.024. [DOI] [PubMed] [Google Scholar]
- Dembo M, Torney DC, Saxman K, Hammer D. The reaction-limited kinetics of membrane-to-surface adhesion. Philos Trans R Soc London Biol. 1988;234(1274):55–83. doi: 10.1098/rspb.1988.0038. [DOI] [PubMed] [Google Scholar]
- Dong C, Lei XX. Biomechanics of cell rolling: shear flow, cell-surface adhesion, and cell deformability. J Biomech. 2000;33(1):35–43. doi: 10.1016/s0021-9290(99)00174-8. [DOI] [PubMed] [Google Scholar]
- Dustin ML, Ferguson LM, Chan PY, Springer TA, Golan DE. Visualization of cd2 interaction with lfa-3 and determination of the two-dimensional dissociation constant for adhesion receptors in a contact area. J Cell Biol. 1996;132(3):465–474. doi: 10.1083/jcb.132.3.465. [DOI] [PMC free article] [PubMed] [Google Scholar]
- Frechette J, Drazer G. Directional locking and deterministic separation in periodic arrays. J Fluid Mech. 2009;627:379–401. [Google Scholar]
- Gleghorn JP, Pratt ED, Denning D, Liu H, Bander NH, Tagawa ST, Nanus DM, Giannakakou PA, Kirby BJ. Capture of circulating tumor cells from whole blood of prostate cancer patients using geometrically enhanced differential immunocapture (gedi) and a prostate-specific antibody. Lab Chip. 2010;10:27–29. doi: 10.1039/b917959c. [DOI] [PMC free article] [PubMed] [Google Scholar]
- Hatch A, Hansmann G, Murthy SK. Engineered alginate hydrogels for effective microfluidic capture and release of endothelial progenitor cells from whole blood. Langmuir. 2011;27(7):4257–4264. doi: 10.1021/la105016a. [DOI] [PMC free article] [PubMed] [Google Scholar]
- Hsieh HB, Marrinucci D, Bethel K, Curry DN, Humphrey M, Krivacic RT, Kroener J, Kroener L, Ladanyi A, Lazarus N, Kuhn P, Bruce RH, Nieva J. High speed detection of circulating tumor cells. Biosens Bioelectron. 2006;21(10):1893–1899. doi: 10.1016/j.bios.2005.12.024. [DOI] [PubMed] [Google Scholar]
- Inglis D, Davis J, Austin R, Sturm J. Critical particle size for fractionation by deterministic lateral displacement. Lab Chip. 2006;6(5):655–658. doi: 10.1039/b515371a. [DOI] [PubMed] [Google Scholar]
- Kirby BJ, Jodari M, Loftus MS, Gakhar G, Pratt ED, Chanel-Vos C, Gleghorn JP, Santana SM, Liu H, Smith JP, Navarro VN, Tagawa ST, Bander NH, Nanus DM, Giannakakou P. Functional characterization of circulating tumor cells with a prostate-cancer-specific microfluidic device. PLoS ONE. 2012;7(4):e35,976. doi: 10.1371/journal.pone.0035976. [DOI] [PMC free article] [PubMed] [Google Scholar]
- Lawrence MB, Springer TA. Leukocytes roll on a selectin at physiologic flow rates: Distinction from and prerequisite for adhesion through integrins. Cell. 1991;65(5):859–873. doi: 10.1016/0092-8674(91)90393-d. [DOI] [PubMed] [Google Scholar]
- Lin HK, Zheng S, Williams AJ, Balic M, Groshen S, Scher HI, Fleisher M, Stadler W, Datar RH, Tai YC, Cote RJ. Portable filter-based microdevice for detection and characterization of circulating tumor cells. Clin Cancer Res. 2010;16(20):5011–5018. doi: 10.1158/1078-0432.CCR-10-1105. [DOI] [PMC free article] [PubMed] [Google Scholar]
- Loutherback K, Chou KS, Newman J, Puchalla J, Austin RH, Sturm JC. Improved performance of deterministic lateral displacement arrays with triangular posts. Microfluid Nanofluid. 2010;9:1143–1149. [Google Scholar]
- Luo ZY, Xu F, Lu TJ, Bai BF. Direct numerical simulation of detachment of single captured leukocyte under different flow conditions. J Mech Med Biol. 2011;11(2):273–284. [Google Scholar]
- Nagrath S, Sequist LV, Maheswaran S, Bell DW, Irimia D, Ulkus L, Smith M, Kwak EL, Digurmarthy S, Muzikansky A, Ryan P, Balis U, Tompkins RG, Haber DA, Toner M. Isolation of rare circulating tumor cells in cancer patients by microchip technology. Nature. 2007;450:1235–1239. doi: 10.1038/nature06385. [DOI] [PMC free article] [PubMed] [Google Scholar]
- N’Dri N, Shyy W, Tran-Soy-Tay R. Computational modeling of cell adhesion and movement using a continuum-kinetics approach. Biophys J. 2003;85(4):2273–2286. doi: 10.1016/s0006-3495(03)74652-9. [DOI] [PMC free article] [PubMed] [Google Scholar]
- Orsello C, Lauffenburger D, Hammer D. Molecular properties in cell adhesion: a physical and engineering perspective. Trends Biotech. 2001;19(8):310–316. doi: 10.1016/s0167-7799(01)01692-4. [DOI] [PubMed] [Google Scholar]
- Pratt ED, Huang C, Hawkins BG, Gleghorn JP, Kirby BJ. Rare cell capture in microfluidic devices. Chem Eng Sci. 2011;66(7):1508–1522. doi: 10.1016/j.ces.2010.09.012. [DOI] [PMC free article] [PubMed] [Google Scholar]
- Saad Y, Schultz MH. Gmres: A generalized minimal residual algorithm for solving nonsymmetric linear systems. SIAMJ Sci Stat Comp. 1986;7(3):856–869. [Google Scholar]
- Saintillan D, Darve E, Shaqfeh ESG. A smooth particle-mesh ewald algorithm for stokes suspension simulations: The sedimentation of fibers. Phys Fluids. 2005;17(3):033,301. [Google Scholar]
- Santana SM, Liu H, Bander NH, Gleghorn JP, Kirby BJ. Immunocapture of prostate cancer cells by use of anti-psma antibodies in microdevices. Biomed Microdev. 2012;14:401–407. doi: 10.1007/s10544-011-9616-5. [DOI] [PMC free article] [PubMed] [Google Scholar]
- Smith JP, Barbati AC, Santana SM, Gleghorn JP, Kirby BJ. Microfluidic transport in microdevices for rare cell capture. Electrophoresis. 2012;33(21):3133–3142. doi: 10.1002/elps.201200263. [DOI] [PMC free article] [PubMed] [Google Scholar]
- Stott SL, Lee RJ, Nagrath S, Yu M, Miyamoto DT, Ulkus L, Inserra EJ, Ulman M, Springer S, Nakamura Z, Moore AL, Tsukrov DI, Kempner ME, Dahl DM, Wu CL, Iafrate AJ, Smith MR, Tompkins RG, Sequist LV, Toner M, Haber DA, Maheswara S. Isolation and characterization of circulating tumor cells from patients with localized and metastatic prostate cancer. Sci Trans Med. 2010 doi: 10.1126/scitranslmed.3000403. [DOI] [PMC free article] [PubMed] [Google Scholar]
- Talasaz AH, Powell AA, Huber DE, Berbee JG, Roh KH, Yu W, Xiao W, Davis MM, Pease RF, Mindrinos MN, Jeffrey SS, Davis RW. Isolating highly enriched populations of circulating epithelial cells and other rare cells from blood using a magnetic sweeper device. Proc Natl Acad Sci USA. 2009;106(10):3970–3975. doi: 10.1073/pnas.0813188106. [DOI] [PMC free article] [PubMed] [Google Scholar]
- Wan Y, Tan J, Asghar W, Kim Yt, Liu Y, Iqbal SM. Velocity effect on aptamer-based circulating tumor cell isolation in microfluidic devices. J Phys Chem B. 2011;115(47):13,891–13,896. doi: 10.1021/jp205511m. [DOI] [PubMed] [Google Scholar]
- Wu Z, Willing B, Bjerketorp J, Jansson JK, Hjort K. Soft inertial microfluidics for high throughput separation of bacteria from human blood cells. Lab Chip. 2009;9:1193–1199. doi: 10.1039/b817611f. [DOI] [PubMed] [Google Scholar]
- Zheng S, Lin H, Liu JQ, Balic M, Datar R, Cote RJ, Tai YC. Membrane microfilter device for selective capture, electrolysis and genomic analysis of human circulating tumor cells. J Chromatogr A. 2007;1162(2):154–161. doi: 10.1016/j.chroma.2007.05.064. [DOI] [PubMed] [Google Scholar]
- Zhu B, Smith JP, Yarmush ML, Nahmias Y, Kirby BJ, Murthy SK. Microfluidic enrichment of mouse epidermal stem cells and validation of stem cell proliferation in vitro. Tissue Eng C. 2013 doi: 10.1089/ten.tec.2012.0638. [DOI] [PMC free article] [PubMed] [Google Scholar]
- Zhu C, Bao G, Wang N. Cell mechancis: Mechanical response, cell adhesion, and molecular deformation. Ann Rev Biomed Eng. 2000;2(1):189. doi: 10.1146/annurev.bioeng.2.1.189. [DOI] [PubMed] [Google Scholar]


