Abstract
This study aims to investigate the application of impedance spectroscopy using fixed electrode geometries on a standard glass vial in the characterisation of the freezing process of solutions at different fill liquid volumes. Impedance spectra (between 10 and 106 Hz) were recorded every 3 min, during the freezing cycle on a solution of 30 mg/mL sucrose contained within 10 mL glass vials having an electrode system (two thin copper foils: w, 18 mm; h, 5 mm) affixed to the external surface of the vial. A fill factor (Φ) was defined in terms of the relative height of the solution volume to the height of the electrodes from the base of the vial. Solution volumes of 1.5 to 5 mL (corresponding to Φ= 0.5–1.6) were investigated to establish the applicability of having a fixed electrode geometry for a range of solution volumes. A linear relationship between the time duration of the ice formation/solidification phase and the fill factor suggests that fixed electrode geometries may be used to investigate a range of fill volumes. The benefit of this approach is that it does not invade the solution and hence records the freezing process without providing additional nucleation sites and in a manner which is representative of the entire fill volume.
KEY WORDS: fill height, freezing, impedance spectroscopy, sucrose
INTRODUCTION
Freeze-drying (lyophilisation) is widely practiced in the manufacture of injectable pharmaceuticals to preserve the stability of the therapeutic agent and to facilitate storage at room temperature (1). The process comprises three discrete stages: freezing, primary drying and secondary drying. Of these stages, it is the freezing stage that defines the ice matrix structure and hence the porosity of the dry layer through which water vapour migrates during the subsequent primary drying stage (2–5). The ice morphologies that were developed on freezing are impacted by various factors, including the presence of foreign objects and the topography of the container walls, which provide nucleating sites for subsequent ice growth, the degree of super-cooling and the fill height of liquid in the vial (5–8).
The characteristics of the freezing process have been evaluated indirectly from retrospective analysis of the primary drying stage (i.e. dry layer resistance using process analytical tools) or from measurements of the pore structure of a freeze dried cake at the end of the cycle (by microCT tomography) (5,9). Those studies which attempt to examine the freezing process by direct means are invariably undertaken by off-line techniques, viz. freeze-drying microscopy and differential scanning calorimetry (10). However, the results are of limited relevance because the cooling rate and the degree of super-cooling differ from the real vial conditions, principally due to the differences in sample geometry and differences in cleanliness of a manufacturing environment and a lab environment.
The conventional in-line method for characterising the freezing step is to use a thermocouple inserted into the product to monitor changes in temperature associated with the exothermic crystallisation of ice (11,12). However, by virtue of the fact that the probe resides within the liquid, then the physical presence of the probe necessarily perturbs the processes of ice nucleation and solidification, through the introduction of nucleation sites and thermal inputs respectively. This may result in ice structures which are different from those that would otherwise develop within the regular (non-thermocouple containing) vials (13). Alternatively, the thermocouple probe is attached to the external surface (base) of the vial to avoid product invasion. Nevertheless, being a single-point measurement tool, the data derived from a thermocouple measurement may not provide a true representation of the entire fill volume (6).
Other techniques, including near-infrared (NIR) spectroscopy, Raman spectroscopy and optical tomography (14–16) are also used to study the freezing profile. Challenges associated with these technologies include (1) the placement of a thermocouple probe within the vial will inevitably impact/perturb the processes of ice formation and (2) bulky technologies, such as NIR and Raman probes, which require close placement to the vial in question, do not permit the usual hexagonal arrangement of vials on the freeze drier shelf and therefore provide limited access to those vial in the centre of the cluster.
Impedance spectroscopy (IS) concerns the response of a material to an applied electric field. The response may range from the delocalised charge phenomenon of ionic conduction, through localised space charge polarisation (e.g. interfacial polarisation of the boundaries between two phases) to true dielectric phenomenon such as dipole re-orientation. The majority of applications for IS are for the analysis of materials in which ionic conduction predominates (e.g. solid and liquid electrolytes), for example in the study of fuel cells, rechargeable batteries, and corrosion. There are fewer, but equally important, applications for IS in the study of dielectric materials (i.e. solid or liquid non-conductors whose electrical characteristics involve dipolar rotation, e.g. glasses and polymers) and for those materials whose mechanism of conduction is predominantly electronic (e.g. single-crystal or amorphous semiconductors) (17). Invariably the term dielectric spectroscopy is adopted in preference to IS for the latter types of materials, as the main focus for investigation is the thermally damped relaxation of molecular dipoles. However, many materials do not fall into one category or another, and so IS often finds uses in more complex situations, such as a partly conducting dielectric material with some ionic conductivity. Pharmaceutical materials are a good example of this latter type of material, with even the driest of materials (e.g. powders and granules) exhibiting protonic conduction processes which percolate through the hydration surface of a powder (18,19), whilst displaying pronounced dielectric relaxation phenomena associated with dipole reorientation (20). Despite numerous scientific studies on a wide range of material types, the application for IS for industrial process control is much less prevalent, with the most well-known being the monitoring of the fermentation process in the brewing industry (21,22).
The recent exploration of the use of IS for the characterisation of the lyophilisation process (23) has shown that the cooling rate, the freezing process and the end point of primary drying may be monitored by the application of electrodes external to the vial. The reason why this approach has worked in practice is that the electrical impedance of the object is a function of both the dielectric and conductive properties of the assembly which are, in turn, defined by the composition and physical state of the material contained within the vial, the temperature of the assembly, and the geometry of the vial and electrode system. The first article demonstrated the application of IS in defining the end point of primary drying, which was determined from the inflection in the derivative profile of the imaginary capacitance (dielectric loss) at 1 kHz. The technology described in that publication, comprised a pair of stimulating and sensing electrodes affixed close to the base of a glass vial (10 mL). Each electrode has dimensions 18 × 5 mm and is surrounded by a guard electrode to prevent leakage of the electrical field. The height of each electrode measures 1 cm from the base of the vial (which cover a 3 mL volume in the vial) (24).
An understanding of the position and dimensions of the electrodes in relation to the volume (fill height) occupied by the liquid, for a range of vial sizes, is necessary to the general application of this approach in freeze-drying process development. The obvious first question is how the liquid fill height will impact the impedance spectra recorded by the measurement instrument and the second question is how universal this type of measurement might be for a range of vial sizes.
The first question will be addressed in the main body of this article through an experimental study on conventional 10 mL vial (Schott) with a fill volume ranging from 1.5 to 5 mL, corresponding to a fill height of 0.5 to 1.7 cm. The height of the electrodes was fixed at 1 cm from the bottom of the vial, and electrical impedance profiles were recorded for a fill volume of 3 mL which provides a fill depth of 1 cm and fill factor (Φ) of 1 (ratio of sample height to the height of the top of the guard electrode). In practice, the fill depth may increase up to 2 cm (equivalent to 2ɸ (6 mL)). The measurements of electrical responses at these fill heights will define the potential of IS in monitoring of the freeze-drying process at variable fill volumes. Fill heights of >2 cm should be avoided where possible as it may result in high intra-vial variability and poor cake appearance due to altered heat flow during freezing and primary drying (6).
The second question, in relation to the opportunity to measure the freezing characteristics of solutions within other sizes of vials, is examined theoretically through calculations of the shift in the relaxation frequency of the interfacial polarisation process with changes to the diameter of the vial. The methodology and results of these calculations have been given in Appendix 1.
The final aspect to investigate, when considering different vial geometries and the associated differences in the design/geometry of the electrodes, is the impact of the additional electrode mass on the thermal characteristics of the vial, as there is potential for the additional mass to affect heat transfer to the vial and the rate of freezing and/or drying experienced by the modified vials. The starting point for this analysis is to define a theoretical limit of the thermal mass contributed by the electrodes as ~1% of the vial weight. For the 10-mL tubing vials, used in the through-vial impedance measurements, the electrode mass was measured and found to be ~1.4% of the vial weight. For other sizes of vial, it is also necessary to estimate whether the electrode mass is within the theoretical limit of ~1%. To make this assessment, some calculations were made to determine the mass of the electrode system for different sized glass vials, viz. 2, 4, 6 and 8 mL glass vials. The same calculation was undertaken for the 10 mL vial to demonstrate the validity of these thermal mass calculations. The methodology and results from these calculations are given in Appendix 2. Finally, it should be pointed out that while the current study, reported here, was performed above Tg′ our previous publication also shows that the technique is applicable below Tg′ (25) and may, in fact, be used to observe the glass transition itself.
MATERIALS
Sucrose, purchased from Sigma Aldrich UK, was used as supplied.
METHODS
A 30-mg/mL sucrose solution was prepared in single distilled water obtained from all glass apparatus. Aliquots of the sucrose solution were transferred to impedance measurement vials (N = 5) via a 0.2-μm micro-filter (Minisart, Germany). The impedance measurement vial is a clear glass 10 mL freeze-drying tubing vial (Schott) with two copper foil electrodes (18 × 5 mm) attached at the external bottom curvature and connected at the vial neck to a pair of miniature coaxial cables via longitudinal copper foil strips. In addition, a thin guard electrode was applied around each of the stimulating and sensing electrodes to prevent electrical leakage during the impedance measurement (Fig. 1).
Fig. 1.
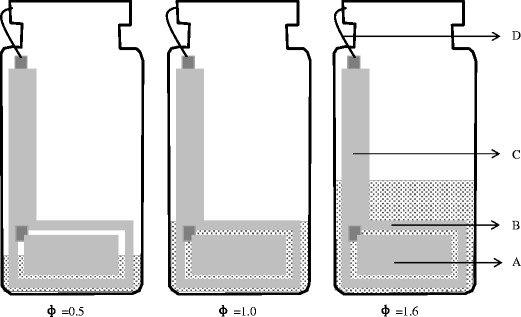
Electrodes attached to the exterior of a freeze-drying vial. A active electrode, B guard electrode, C connector strip from the elecrode to the neck of the vial, D miniature co-axial wire connecting the electrode to the measuring system (where the outer braiding of the coaxial cable attaches to the guard electrode and the inner conductor attaches either to the stimulating or current sensing electrode), Φ ratio of liquid fill height to the height of the top of the guard electrode
The measurement vials were connected to a high precision impedance analyser located outside of the freeze drier (HETO FD08, Denmark) via a junction box and a hermetically sealed pass-through. The impedance spectrum was recorded by scanning the frequencies in the range 101–106 Hz. The acquisition time for each spectrum was 27 s and an interval between all five measurements of 3 min. The product temperature was recorded by means of type K thermocouple placed in the glass vials, arranged in a line on the shelf, using temperature data logger OctTemp 2000 (Madgetech USA).
The fill volume was successively increased from 1.5 to 5 mL. Each freezing experiment was repeated to provide 10 measurements at each fill volume. The corresponding solution fill height ranged from ~4.6 mm (1.5 mL) which sits below the electrode foil height of 10.5 mm, to 17.5 mm (5.0 mL), which sits above the top of the electrodes. These product fill heights correspond to a fill factor (Φ) increasing from 0.5 to 1.6 (Fig. 1).
The freezing cycle comprised the following steps: (1) temperature ramp to 25°C, over 10 min; (2) hold temperature at 25°C for 20 min; (3) temperature ramp to −30°C, over 60 min; and 4 hold temperature at −30°C for 120 min.
RESULTS AND DISCUSSION
The basic characteristics of the freezing process are described first for a fill factor of Φ = 1 while the impact of fill height is evaluated in the next section.
Freezing Characteristics at Fill Factor (Φ = 1)
At a fill factor of Φ = 1 the capacitance spectrum of the material under test (i.e. glass vial and the 30 mg/mL sucrose solution) displayed a step-like decrease in the real part of the electrical capacitance as the frequency is increased through the critical frequency which corresponds to the relaxation time constant for the sample (f = 1/2πτ) (Fig. 2(i)). There is a corresponding peak in the associated imaginary capacitance (dielectric loss) spectrum as the material under test starts to conduct electricity through the phase lag between the response of the sample and the applied electric field (Fig. 2(ii)). The real part of capacitance refers to that component of the capacitance which is in phase with the reactive current and the imaginary capacitance refers to that component of the capacitance that is out of phase with the reactive current. The manifestation of the step in the real part of capacitance and the peak in the imaginary par of capacitance is known as a pseudo-relaxation process, as it has the appearance of a real relaxation process within a material (i.e. one that has a frequency dependence to its dielectric properties owing to some molecular relaxation or some form of interfacial charging within the material). In reality, the dielectric properties of the material within the vial may be static i.e. invariant with frequency, and the pseudo-relaxation process is simply due to the accumulation of charge at the glass surface as ions migrate through the liquid (or solid) contained within the glass vial. A more appropriate description of the pseudo-relaxation process is therefore ‘an interfacial polarisation’ process.
Fig. 2.
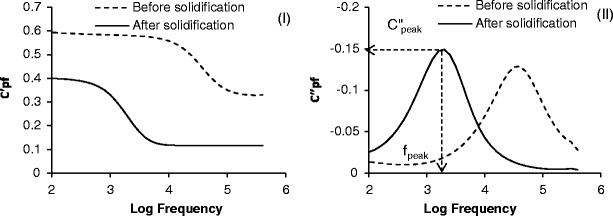
Capacitance plots during the freezing of a sucrose solution (30 mg/mL): i left shows the frequency dependence of the real part of capacitance (C′) and ii right shows the frequency dependence of the imaginary part of capacitance (C′). The dotted line represents liquid state and the solid line denotes frozen state
The features of the pseudo-relaxation process as a function of time were characterised in terms of the amplitude (C″peak) and frequency position (fpeak) of the peak in the imaginary capacitance spectrum (Fig. 2(ii)). The time profile of log fpeak (Fig. 3(i)) is remarkably similar to that recorded by the thermocouple (Fig. 3(iii)) and identifies various phases in the freezing cycle: the pre-cooling phase (A to B), the onset of ice formation (point B), the solidification phase of the product (i.e. the ice growth phase; B to D) and the subsequent equilibration of the product temperature with the shelf temperature (D to E). In contrast the time profile of C″peak (Fig. 3(ii)) is quite different and somewhat scattered, up to the point of complete solidification (point D).
Fig. 3.
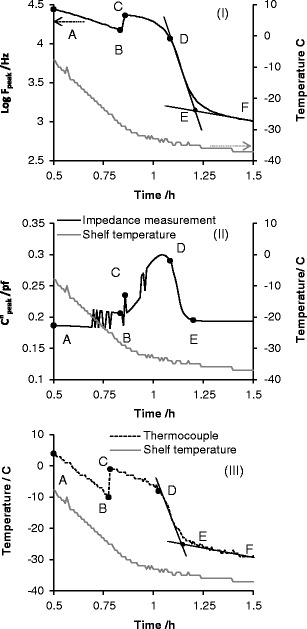
Time profile of i the peak frequency (f peak), ii the peak amplitude (C″ peak) and iii product temperature of sucrose 30 mg/mL during freezing. Plots I and III clearly identify critical steps relating to product freezing; A to B is product cooling (pre-ice formation), B is the onset of ice formation, C describes the maximum increase in product temperature following exothermic heat dissipation during ice formation. From these transitions, one can define B–D as the ice solidification phase, D–E as the equilibration phase, E–F is product cooling (ii; post-ice formation). C″ peak appears noisy during the freezing but delineates precisely the end point of the equilibration phase (point E). Note that time zero is taken from the end of the equilibration phase after the vial and contents have been maintained at 25°C for 10 min
Further explanation of each phase is given below:
- Cooling Phase (A to B)
The magnitude of log fpeak decreases linearly with the time because of the temperature dependent decrease in the electrical resistance of the sucrose solution. This behaviour continues until the ice nucleation point is reached (point B).
- Ice Nucleation (point B)
The onset of freezing or ice nucleation is identified by an abrupt increase in the magnitude of fpeak which results from the elevation in temperature, following the release of the heat of ice crystallisation (an exothermic process). The time corresponding to this transition was recorded as the nucleation time.
- Solidification Phase (B–D)
As the ice nucleation phase progresses to the growth of ice crystals, it is the rate of ice formation that defines the rate of energy release into the product and hence the rate of the temperature rise. However, in parallel with the increase in temperature from ice formation, there is also an increase in the rate of heat dissipation through the walls of the vial. At some point, the rate of ice formation slows down, such that the rate of heat dissipation then exceeds the rate of heat release and the temperature then starts to decrease. This defines the point C. Thereafter, the heat dissipation rate dominates the energy balance in the system and the temperature begins to return to equilibrium with the shelf (point E). However, before equilibrium is reached there comes a point when no more ice forms in the system and energy dissipation alone defines the energy balance in the system. The time period from point B to point D is therefore defined as the solidification time, during which the ice crystallisation process is complete, whereas the time period from D to E defines the equilibration phase.
- Cooling Phase II (E–F)
Following the equilibration phase, the contents of the vial continue to cool at rate defined by the cooling rate of the shelf; Though the thermal exchange between the vial contents and the surroundings means that the temperature within the vial stabilise 1–2°C above the shelf temperature.
The end of the equilibration phase (E) was estimated from the point where the tangent of the line through the data from the solidification phase intersects with the tangent of the line through the data from cooling phase II (post ice formation). The freezing time is then defined as the time difference from point B to E. The time duration of each phase was also estimated from the product temperature profile recorded by the thermocouple (Fig. 3(ii)).
Freezing characteristics of sucrose 30 mg/mL at different fill factors (Φ = 0.5 to1.6)
The features of pseudo-relaxation process were also assessed at two other fill factors (Φ = 0.5 and Φ = 1.6). Both log fpeak and temperature profiles show that by increasing the fill volume (so that the fill factor changes from 0.5 to 1.6) results in the prolongation of the freezing process (Fig. 4). The analysis of these profiles, along the lines described earlier, provides a range of estimates for the ice nucleation time, the freezing time, the solidification time and the equilibration time. In each plot, the cumulative standard deviation takes in account the variability in freezing times associated with the position of vials on the self in relation to the walls of the drier, and the small differences in vial geometry.
Fig. 4.
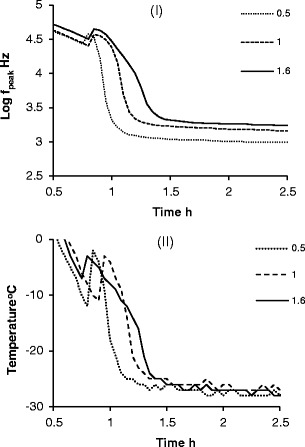
Time profiles of i f peak and ii temperature for 30 mg/mL sucrose during freezing at different fill factors (Φ = 0.5, 1 and 1.6; n = 10). Note that time zero is taken from the end of the equilibration phase after the vial and contents have been equilibrated at 25°C for 10 min
The results from the perspective of ice nucleation time suggest that there appears to be little influence of fill height on the onset time (Fig. 5). This observation is consistent with the fact that freezing starts from the base of the vial, and so the fill height has little bearing on when the inititation of the ice nucleation event occurs. Although one could argue that, the greater the fill volume, the longer it will take to cool the product to the nucleation temperature. However, the overlapping standard deviation values preclude the drawing of any definitive conclusion.
Fig. 5.
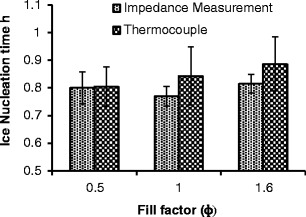
Ice nucleation time for sucrose 30 mg/mL at different fill factors. Time zero is taken from the end of the equilibration phase after the vial and contents have been equilibrated at 25°C for 10 min. The nucleation time is then calculated from the time point B (Fig. 3)
The results from ice nucleation time might also suggest an earlier ice nucleation in the IS measured vials compared with thermocouple TC, however these observation remains inconclusive because of a high degree of variation in the onset of formation signified by the overlapping standard deviation values.
The scatter in the ice nucleation (Fig. 5) for any particular fill volume confirms the stochastic nature of the ice nucleation process (26) (%COVs range from 12.4 to 8.8 for the thermocouple data and 7.2 to 4.1 for the IS data). This inherent variability in the onset of ice formation could result in differences in the degree of super-cooling and hence different ice morphologies in the frozen matrix. The fact that the scatter in the onset is greater for the TC data than the IS data may be due to the fact that the TC measurement is more sensitive to its position in the vial in relation to the spatial seeding of the ice layer.
By plotting the freezing time, the solidification time and the equilibration time (from both the fpeak derived estimates and thermocouple derived estimates) shows that the duration of each phase has a broadly linear dependence on fill factor (Fig. 6). The solidification time almost doubles with a doubling of the fill factor as one might expect. However, the equilibration time is much less dependent on the fill factor. The fact that the equilibration time is almost constant might mean that this time equates to the time required for the excess heat to pass through the base of the vial and to some extent through the walls of the vial. As the volume of the frozen mass increases there is a small increase in the contribution from the vial, which is associated with the increased wall volume that is adjacent to the liquid fill. The intercept on the y-axis can then be considered as the time constant for heat flux through the base and the gradient of the line is the time constant for heat flux through unit area of the side walls of the vial.
Fig. 6.
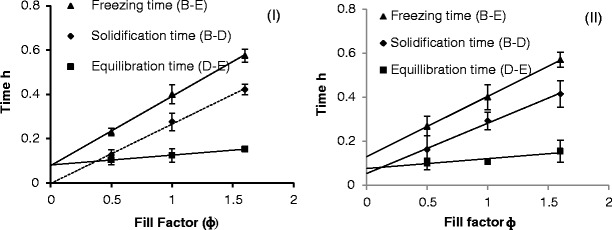
Freezing time, solidification time and equilibration time for 30 mg/mL sucrose solution at different fill factors (n = 10), I Impedance measurement (left); II thermocouple measurement (right)
The line of best fit to the IS derived solidification time extrapolates back to zero whereas the line of best fit for the TC derived solidification time does not extrapolate to zero. This observation suggests a potential limitation of the point measurement systems, whereby the position of the thermocouple in relation to the fill volume and the walls of the vial will impact the time point at which any one particular phase is deemed to have completed.
By contrast, the improved linearity between the time duration of the solidification phase and the fill volume, as derived from the log fpeak values, is a consequence of the fact that the impedance measurement is sensing the entire fill volume (given that the guard electrode surrounds the measurement electrodes then this will force the field lines through the contents of the vial and hence the impedance measurements sense the entire contents of the vial).
From this work and other recent publications (24), it is becoming clear that the through-vial IS technique may have a role to play in the development of lyophilisation processes and formulations. In particular it may find a useful role in defining the in situ characteristics of the freezing process, especially in regard to the manefestation of first and second order transitions such as eutectic crystallation (data not presented) and the glass transition (25) and the impact of various process conditions (set temperatures and ramp rates) including those which define the process of annealing. Further development of the technology to establish a non-contact measurement may even allow for the technique to be used more extensively in the processes of scale up.
A major advantage over other single vial measurement techniques (such as NIR, microbalance) is that vials may be clustered in the usual hexagonal array (which is employed when the shelf is fully loaded) as a consequence of the minimal physical space taken up by the electrode system. The major disadvantage (as with all single vial measurements) is that only a limited number of vials may be characterised which makes exptralotation to the whole batch somewhat difficult. However, further development of the technology to establish a non-contact measurement may allow for multiple vials to be assesed within domains of the freeze-drier. Such a development would then render the technique more applicable to scale up and process verification in GMP freeze-driers.
CONCLUSIONS
Impedance spectra from the electrode-vial-solution assembly displayed a pseudo-relaxation process which arises from the polarisation of the solution-glass wall interface. Of the two parameters characterising the process (i.e. fpeak and C″peak), it is fpeak that shows a strong correlation with the solution temperature as recorded by the thermocouple. The time profile of fpeak during the freezing process recorded the various phases of (1) cooling, (2) ice nucleation and growth leading to the solidification of the product and (3) the equilibration of the frozen solution with the shelf temperature. A linear relationship between the duration of the solidification phase and fill volume suggests that fixed electrode geometries may be used to investigate a range of fill volumes.
ACKNOWLEDGMENTS
The current impedance measurement system (LyoDEA™) was developed through collaboration with GEA Pharma Systems, AstraZeneca, and Ametek, and co-funded by the Technology Strategy Board.
Appendices
Appendix 1: Estimation of the Peak Frequencies of Liquid and Frozen Sucrose Solution (30 mg/mL) Within Tubing Vial of Different Vial Geometries
In a simple approximation, the impedance of the object under test can be described as a combination of resistor and capacitor; the resistance of which is defined by following equation
 |
1 |
where K1 is a geometrical coefficient, d is the internal diameter of the vial, ACS is an area of effective vertical cross section of the sample (i.e. the solution within the vial) and σ is specific conductivity of the sample. The capacitance can be defined by the following equation.
 |
2 |
Where ε0 is the permittivity of a vacuum, ε is the dielectric constant of glass, A is the area of the electrodes and l is thickness of the glass wall. For the purpose of these calculations, the wall thickness is assumed to be constant for all sizes of vial.
Multiplying R by C, we obtain
 |
3 |
where τ is the known as the time constant of the serial RC circuit. It is this time constant which defines the position of the interfacial relaxation peak in the experimental frequency window (where fpeak = 1/2πτ).
In the first approximation, ACS can be presented as ACS = AK2 where K2 is a constant coefficient (associated with the fixed cylindrical shape of the sample volume). Then Eq. (3) can be rewritten as
 |
4 |
A in the numerator and denominator can be cancelled thus giving
 |
5 |
For simplicity, let us denote
 |
6 |
As all members in the right side of Eq. (6) are constants then Kp (the proportionality coefficient) is also a constant, and expression (5) can be simplified to
 |
7 |
and respectively
 |
8 |
Expression (8) shows that the frequency position of the peak has an approximately inverse dependence on the internal diameter of the vial.
Having measured the experimental value of fpeak for 10 mL (fpeak10 ml), it is then straight forward to estimate fpeak(xml) for different sized vials from the ratio of the diameters, according to the formula below.
 |
9 |
Table I gives theoretical estimates for the peak frequency for different sized vials, for both the liquid state and the frozen state.
Table I.
Estimated Position of Pseudo-relaxation Peak for a 30 mg/mL Solution of Sucrose in Distilled Water Within Glass Tubing Vials of Varying Diameter (but Constant Wall Thickness, 2 mm)
| Vial size (mL) Schott | Internal diameter (mm) | f peak liquid (kHz) | f peak frozen (kHz) |
|---|---|---|---|
| 10 | 21.95 | 64.021 | 1.390 |
| 2 | 13.91 | 101.056 | 2.194 |
| 4 | 13.92 | 100.959 | 2.192 |
| 6 | 19.92 | 70.579 | 1.532 |
| 8 | 19.90 | 70.626 | 1.533 |
Values of f peak for a 30 mg/mL sucrose solution in the 10-mL tubing vial (Schott) have been determined experimentally
Appendix 2: Thermal Mass Contributions from the External Electrodes
The basis for these calculations is to first determine the position of the top of the guard electrode from the base of the vial (dimension A; Fig. 7) for a fill volume that provides a constant ratio of the liquid cross sectional area to the liquid fill height, for all sizes of vial and which is equal to that for a 3-mL fill volume in a 10-mL vial.
Fig. 7.
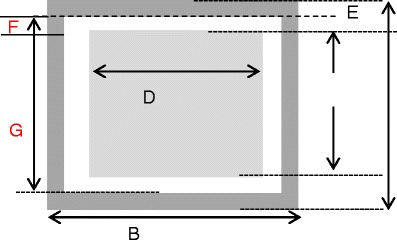
Schematic of the electrode assembly. A electrode height, B length of guard electrode, C height of stimulating/sensing electrode, D width of stimulating/sensing electrode, E width of guard electrode, F spacing between guard electrode and sensing electrode, and G is the height of the side segment of the guard electrode
Once the position of the top of the guard electrode is defined, then the next step is to estimate the length of the sensing/stimulating electrode (dimension D; Fig. 7). This dimension is defined by the ratio of the electrode length to the circumference of the vial, which is fixed at 0.4 for all vials. All other dimensions, i.e. the separation/gap between the guard and the sensing/stimulating electrodes and the width of the guard electrode are fixed at 1 and 1.5, respectively. Knowing the dimensions A, D, E and F permits the calculation of all other dimensions, from which the total area of the electrode assembly can then be calculated (Table II). The mass of the electrode assembly is then determined from the specific weight of the electrode material (0.4 mg/mm2 for the copper foil used on the 10 mL vial) and the %increase in vial weight from attaching the copper foil is then determined from the weight of the vial. Table III shows the dimensions of the electrode assemblies and the results of these calculations of %increase in mass.
Table II.
Calculation of Liquid Cross Sectional Area (a) and Liquid Fill Height (h) Corresponding to a Fixed Ratio of a/h = 45 mm
| Vial size | Mean weight (g) | ±SD (weight) | Mean diameter (mm) | ±SD (diameter) | a (mean area of liquid (mm2)) | ±SD (area) | h (mean liquid fill height (mm)) | ±SD (fill height) |
|---|---|---|---|---|---|---|---|---|
| 2 | 4.420 | 0.014 | 15.950 | 0.010 | 199.833 | 0.251 | 4.433 | 0.006 |
| 4 | 5.584 | 0.034 | 15.983 | 0.042 | 200.669 | 1.046 | 4.451 | 0.023 |
| 6 | 7.999 | 0.085 | 21.937 | 0.006 | 377.996 | 0.199 | 8.385 | 0.004 |
| 8 | 8.639 | 0.084 | 21.923 | 0.076 | 377.537 | 2.629 | 8.375 | 0.058 |
| 10 | 9.283 | 0.068 | 23.957 | 0.061 | 450.816 | 2.299 | 10.000 | 0.051 |
Table III.
Theoretical Calculations of the %Increase in Thermal Mass on Fixing an Electrode Pair (with Guard Electrodes) to Different Volumes of Tubing Vial
| Vial size mL | Vial weight (mg) | Electrode height mm | Sensing electrode | Top- and bottom-guard electrode | 2 side-guard electrodes | Total area of electrode assembly (mm2) | Wt of electrode assembly | Thermal mass as % of vial weight | ||||||
|---|---|---|---|---|---|---|---|---|---|---|---|---|---|---|
| Height (mm) | Width (mm) | Area (mm2) | Height (mm) | Width (mm) | Area mm2 | Height (mm) | Width (mm) | Area (mm2) | ||||||
| 2 | 4,419 | 4.4 | 2.22 | 11 | 24.37 | 1.11 | 15.9 | 17.64 | 4.7 | 1.11 | 5.22 | 94.48 | 37.793 | 0.86 |
| 4 | 5,584 | 4.5 | 2.23 | 16.3 | 36.34 | 1.11 | 15.9 | 17.64 | 4.7 | 1.11 | 5.22 | 118.43 | 47.37 | 0.85 |
| 6 | 7,998 | 8.4 | 4.19 | 16.3 | 68.29 | 2.09 | 21.75 | 45.58 | 6.5 | 2.08 | 13.52 | 254.81 | 101.92 | 1.27 |
| 8 | 8,639 | 8.4 | 4.19 | 16.3 | 68.29 | 2.09 | 21.79 | 45.67 | 6.5 | 2.09 | 13.59 | 255.11 | 102.04 | 1.18 |
| 10 | 9,282 | 10 | 5 | 18 | 90 | 2.5 | 24 | 60 | 7 | 3 | 21 | 342.00 | 136.8 | 1.47 |
The application of electrodes was practicable by the current method (manually) for vial sizes 6, 8 and 10 mL as the dimensions of different electrode components were greater than 1 mm thickness. On contrary for smaller-sized glass vials, i.e. 2 and 4 mL, dimension electrodes and its spacing fractionate between 1 mm which may require an alternate methodology (sputtering) to apply thermal mass of the electrode
REFERENCES
- 1.Pikal MJ. Freeze drying. In: Swarbrick J, editor. Encyclopedia of pharmaceutical technology. 3. New York: Marcel Dekker; 2002. pp. 1807–33. [Google Scholar]
- 2.James A, Searles JFC, Randolph TW. The ice nucleation temperature determines the primary drying rate of lyophilization for samples frozen on a temperature-controlled shelf. J Pharm Sci. 2001;90(7):860–71. doi: 10.1002/jps.1039. [DOI] [PubMed] [Google Scholar]
- 3.Hottot A, Vessot S, Andrieu J. Freeze drying of pharmaceuticals in vials: influence of freezing protocol and sample configuration on ice morphology and freeze-dried cake texture. Chem Eng Process. 2007;46(7):666–74. doi: 10.1016/j.cep.2006.09.003. [DOI] [Google Scholar]
- 4.Wilson PW, Heneghan AF, Haymet ADJ. Ice nucleation in nature: supercooling point (SCP) measurements and the role of heterogeneous nucleation. Cryobiology. 2003;46(1):88–98. doi: 10.1016/S0011-2240(02)00182-7. [DOI] [PubMed] [Google Scholar]
- 5.Rambhatla S, Ramot R, Bhugra C, Pikal M. Heat and mass transfer scale-up issues during freeze drying: II. Control and characterization of the degree of supercooling. AAPS PharmSciTech. 2004;5(4):54–62. doi: 10.1208/pt050458. [DOI] [PMC free article] [PubMed] [Google Scholar]
- 6.Liu J, Viverette T, Virgin M, Anderson M, Dalal P. A study of the impact of freezing on the lyophilization of a concentrated formulation with a high fill depth. Pharm Dev Technol. 2005;10(2):261–72. doi: 10.1081/PDT-54452. [DOI] [PubMed] [Google Scholar]
- 7.Guttzeit M. Designing an effective PAT-driven scale-up of lyophilization processes. PharmTechnol. 2010;22(11):8. [Google Scholar]
- 8.Oetjen G-W. Foundations and process engineering. Freeze-drying. Weinheim: Wiley; 2007. pp. 1–126. [Google Scholar]
- 9.Mousavi R, Miri T, Cox PW, Fryer PJ. A novel technique for ice crystal visualization in frozen solids using X-ray micro-computed tomography. J Food Sci. 2005;70(7):e437–42. doi: 10.1111/j.1365-2621.2005.tb11473.x. [DOI] [Google Scholar]
- 10.Ward KR, Matejtschuk P. The use of microscopy, thermal analysis, and impedance measurements to establish critical formulation parameters for freeze-drying cycle development. In: Rey L, May JC, editors. Freeze drying/lyophilization of pharmaceutical and biological products. New York: Marcel Dekker; 2010. pp. 112–35. [Google Scholar]
- 11.Kasper JC, Friess W. The freezing step in lyophilization: physico-chemical fundamentals, freezing methods and consequences on process performance and quality attributes of biopharmaceuticals. Eur J Pharm Biopharm. 2011;78(2):248–63. doi: 10.1016/j.ejpb.2011.03.010. [DOI] [PubMed] [Google Scholar]
- 12.Konstantinidis AK, Kuu W, Otten L, Nail SL, Sever RR. Controlled nucleation in freeze-drying: effects on pore size in the dried product layer, mass transfer resistance, and primary drying rate. J Pharm Sci. 2011;100(8):3453–70. doi: 10.1002/jps.22561. [DOI] [PubMed] [Google Scholar]
- 13.Franks F. Freeze-drying of pharmaceuticals and biopharmaceuticals. Cambridge: The Royal Society of Chemistry; 2007. [Google Scholar]
- 14.Brülls M, Folestad S, Sparén A, Rasmuson A. Near-infrared spectroscopy monitoring of the lyophilization process. Pharm Res. 2003;20(3):494–9. doi: 10.1023/A:1022680810474. [DOI] [PubMed] [Google Scholar]
- 15.Mujat M, Greco K, Galbally-Kinney KL, Hammer DX, Ferguson RD, Iftimia N, et al. Optical coherence tomography-based freeze-drying microscopy. Biomed Opt Express. 2012;3(1):55–63. doi: 10.1364/BOE.3.000055. [DOI] [PMC free article] [PubMed] [Google Scholar]
- 16.De Beer TRM, Vercruysse P, Burggraeve A, Quinten T, Ouyang J, Zhang X, et al. In-line and real-time process monitoring of a freeze drying process using Raman and NIR spectroscopy as complementary process analytical technology (PAT) tools. J Pharm Sci. 2009;98(9):3430–46. doi: 10.1002/jps.21633. [DOI] [PubMed] [Google Scholar]
- 17.Macdonald JR, Johnson WB. Fundamentals of impedance spectroscopy. In: Barsoukov E, Macdonald JR, editors. Impedance spectroscopy theory, experiment and applications. 2. New Jersey: Wiley; 2005. p. 595. [Google Scholar]
- 18.Suherman PM, Smith G. A percolation cluster model of the temperature dependent dielectric properties of hydrated proteins. Journal of Physics D-Applied Physics. 2003;36(4):336–42. doi: 10.1088/0022-3727/36/4/303. [DOI] [Google Scholar]
- 19.Petrovsky V, Jasinski P, Dogan F. Effective dielectric constant of two phase systems: application to mixed conducting systems. J Appl Phys. 2012;112(3):034107. doi: 10.1063/1.4743985. [DOI] [Google Scholar]
- 20.Ermolina I, Smith G. Dielectric spectroscopy of low-losses sugar lyophiles: III: the influence of moisture on the dielectric response of freeze-dried lactose. J Non-Cryst Solids. 2011;357(2):671–6. doi: 10.1016/j.jnoncrysol.2010.06.062. [DOI] [Google Scholar]
- 21.Soley A, Lecina M, Gámez X, Cairó JJ, Riu P, Rosell X, et al. On-line monitoring of yeast cell growth by impedance spectroscopy. J Biotechnol. 2005;118(4):398–405. doi: 10.1016/j.jbiotec.2005.05.022. [DOI] [PubMed] [Google Scholar]
- 22.Olmi R, Meriakri VV, Ignesti A, Priori S, Riminesi C. Monitoring alcoholic fermentation by microwave dielectric spectroscopy. J Microw Power Electromagn Energy. 2007;41(3):37–49. [PubMed] [Google Scholar]
- 23.Smith G, Polygalov E, Page T, inventors; GEA Pharma Systems Limited, assignee. Electrical monitoring of a lyophilization process Great Britain patent GB2480299. 2011; 16/11/2011.
- 24.Smith G, Polygalov E, Arshad MS, Page T, Taylor J, Ermolina I. An impedance-based process analytical technology for monitoring the lyophilisation process. Int J Pharm. 2013;449(1–2):72–83. doi: 10.1016/j.ijpharm.2013.03.060. [DOI] [PubMed] [Google Scholar]
- 25.Smith G, Arshad MS, Polygalov E, Ermolina I. An application for impedance spectroscopy in the characterisation of the glass transition during the lyophilization cycle: the example of a 10% w/v maltodextrin solution. Eur J Pharm Biopharm. 2013 doi: 10.1016/j.ejpb.2013.08.004. [DOI] [PubMed] [Google Scholar]
- 26.Nakagawa K, Hottot A, Vessot S, Andrieu J. Modeling of freezing step during freeze-drying of drugs in vials. AIChE J. 2007;53(5):1362–72. doi: 10.1002/aic.11147. [DOI] [Google Scholar]


