Abstract
Acetylshikonin (AS) has demonstrated antitumor potential. However, the development of therapeutic applications utilizing AS is inhibited by its poor solubility in water. In the present work, polyamidoamine (PAMAM) dendrimers and their PEGylated derivatives were employed to increase the solubility of AS. A distinct color transition was observed during the encapsulation of AS suggesting strong intermolecular forces between PAMAM and AS. Ultraviolet–visible, high-performance liquid chromatography, and 1H NMR were used to verify the interaction between PAMAM and AS. The maximum amount of combined AS to each PAMAM molecule was determined. The cytotoxicity of AS nanoparticles was evaluated against leukemia (K562) and breast cancer (SK-BR-3) cell lines; the AS nanoparticles were shown to effectively inhibit tumor cells.
KEY WORDS: acetylshikonin (AS), color transition, polyamidoamine (PAMAM) dendrimer
INTRODUCTION
Acetylshikonin (AS), along with several other naphthoquinones, has been extracted and isolated from the external surface of the roots of at least 150 species of the Boraginaceae family (1). Several investigations have found that AS is a potent pharmaceutical substance with wound healing, antimicrobial, anti-inflammatory, antipyretic, antioxidant, and antitumor activities (2–4).
In the last decade, extensive research has been conducted to study the antitumor activity and the mechanism of the antitumor effect of AS (5–9). However, AS exhibits extremely low solubility in water (detected in this study). The poor aqueous solubility of AS places restrictions on its administration and absorption, therefore, hinders the development of AS-containing therapeutic applications. A drug delivery carrier is required to increase the solubility of AS in aqueous solutions.
Polyamidoamine (PAMAM) dendrimers are hyperbranched macromolecules with uniform size, monodispersity and a high density of peripheral functional end groups. PAMAM dendrimers are an important classification of drug carriers (10,11). Drug molecules can either link to the peripheral groups through covalent and noncovalent bonds or be encapsulated into the cavities of PAMAM by hydrogen bonds, electrostatic interactions and hydrophobic interactions (10,12). Drug molecules, with an assortment of diameters, molecular weights, surface charges and solubilities, interact with PAMAM in various ways (13). In previous studies, PAMAM, with hydrophobic interiors and hydrophilic chain ends, demonstrated the potential to increase the solubility of hydrophobic drugs in an aqueous solution (14). However, PAMAM has shown a low tendency to encapsulate hydrophilic drug molecules into its core region, while some insoluble drugs that carry negative charges were prone to be encapsulated into the interior region of PAMAM (15).
Its nanometer structure and large quantity of binding sites make PAMAM an ideal vector for antitumor drugs. However, cationic PAMAM, with a large number of peripheral primary amino groups, demonstrates increased cytotoxicity and rapid clearance from the circulation (16). Polyethylene glycol (PEG), a commonly used hydrophilic chain, was used to modify PAMAM to increase the circulation time and reduce hemolytic toxicity (17,18).
In the present study, new formulations of AS were prepared with PAMAM generation 4 (G4) dendrimers and PEG-PAMAM (PPG) with the intent to increase the aqueous solubility of AS for further applications. AS nanoparticles were prepared using the organic solvent evaporation method. AS was either combined with the peripheral ends or encapsulated into the interior region of PAMAM. The interactions between PAMAM and AS were characterized, and the combination capability of PAMAM with AS was detected. Finally, the cytotoxicity of AS nanoparticles was evaluated in K562 and SK-BR-3 cell lines.
MATERIALS AND METHODS
Materials
PAMAM G4 was purchased from Chenyuan Corporation (Shandong, China). mPEG-MAL (5 kDa) was obtained from Yare Biotech (Shanghai, China) with 95.3% purity. 2-Iminothiolane hydrochloride was purchased from Sigma-Aldrich. Dried pulverized roots of Lithospermum erythrorhizon Sieb. et Zucc was purchased from Liaoning province in China. Human tumor cell line K562 and SK-BR-3 were obtained from the Institute of Biochemistry and Cell Biology, Chinese Academy of Sciences. All cell culture media and reagents were purchased from Gibco Inc. All organic solvents were of analytical grade and purchased from Yuwang Group (Shandong, China). Water used in all experiments was of high-performance liquid chromatography (HPLC) grade.
Extraction of AS
Dried pulverized roots (100 kg) were extracted by supercritical CO2 (HA221-40–48, Nantong Huaan above-critical extraction Co., Ltd., China) to obtain dark red viscous residues (2 kg). Methanol (200 mL) was selected to dissolve the resulting extract (30 g), and the solution was filtered to remove the insoluble substance. Subsequently, a solution of copper acetate (140 g) in distilled water (30 mL) was added to the methanol solution to chelate the naphthoquinone derivatives, and it was then filtered. Subsequently, 10% HCl (150 mL) was applied to displace copper ions from the Cu complexes; the mixture was stirred for 2 h and then filtered to obtain the crude product. The product was then dried in a vacuumoven at 50~60°C, ground to a powder and directly subjected to column chromatography. Ethyl acetate and petroleum ethyl (V/V = 1:10) were used as the mobile phase to separate AS. The product was then re-crystallized repeatedly with n-hexane to offer high-optical purity (>99%) AS as the resulting solid red product.
Solubility of AS
The solubility of AS in water, pH 7.4 PBS (0.01 M) and 1% SDS solution was studied by the stir flask method. An excess amount of AS (approximately 5 mg) was added to each cap vial containing 2 mL of the solutions. After sealing, the mixtures were stirred at 500 rpm and kept at 25°C for 48 h. Then, the samples were centrifuged at 10,000 rpm for 15 min to remove the undissolved AS. The upper layer was removed and diluted with methanol for quantification by HPLC. Each value represents the mean ± standard deviations (SD; n = 3).
The determination was performed using HPLC/UV detection (LC-10AT VP, Shimadzu, Japan) with methanol: distilled water: glacial acetic acid (92:8:0.3) as the mobile phase at a flow rate of 1.0 mL/min. The column was a reversed-phase column (Inertsil ODS-3, 4.6 × 250 mm, i.d. 5 μm; GL Sciences, Japan). Detection was recorded at λ = 518 nm (detected in “UV–Vis Spectroscopy and HPLC Detection”). The AS stock solution was diluted to working solutions ranging from 0.1 to 20 μg/mL, and the standard calibration curves were constructed by plotting concentrations against peak areas. A good linearity was achieved with a correlation coefficient of 0.9997.
Synthesis of PEG-PAMAM
2-Iminothiolane hydrochloride (Traut’s reagent) was added to PAMAM at molar ratio of 10:1 in pH 9.0 borate buffer (0.2 M, containing 3 mM EDTA) and stirred for 1 h. The product was subjected to ultrafiltration (MWCO, 3 kDa; Millipore, USA) with pH 7.4 borate buffer (0.2 M, containing 3 mM EDTA) as a substitution to remove surplus Traut’s reagent. Then, mPEG-MAL (5 kDa) dissolved in pH 7.4 borate buffer (0.2 M) was added to the above thiolation PAMAM at molar ratio of PEG-PAMAM = 8:1, stirring for 12 h at room temperature. The product was subjected to ultrafiltration (MWCO, 10 kDa; Millipore, USA) with pure water as substitution until no free PEG spot was detected by thin-layer chromatography (chloroform/methanol/water = 1/1/0.1, v/v/v) (19). Subsequently, it was lyophilized and dissolved in D2O, and the structure of PPG was confirmed using a 300 MHz1H NMR spectrometer (Fig. 1). The spectrum of PPG contains characterized signals of PEG: δ = 3.55~3.8 ppm (m, CH2CH2O). The average number of PEG chains attached to PAMAM was 5.
Fig. 1.
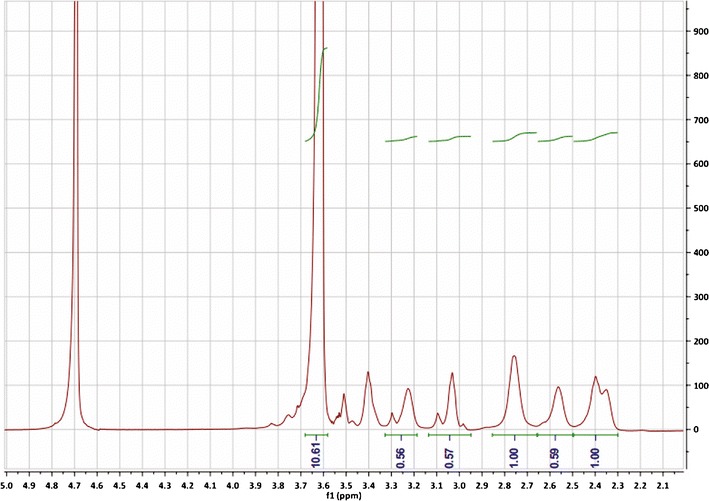
1H NMR spectrum of PPG in D2O
Encapsulation of AS by PAMAM and PEG-PAMAM
PAMAM was mixed with AS at AS/PAMAM molar ratios of 5:1,7.5:1, 15:1 and 30:1 (mol/mol) in methanol and agitated at room temperature for 12 h. The organic solvent was evaporated to dryness at 30°C using a rotary evaporator. The dry product was dissolved in pH 7.4 PBS (0.01 M) and left for 4 h for hydration at 30°C. Then, the above solution was filtrated through a cellulose acetate filtrate membrane (Millipore, pore size, 0.45 μm) to obtain the PAMAM/AS nanoparticles (PAM/AS NPs). The same method was used to prepare the PEG-PAMAM/AS nanoparticles (PPG/AS NPs). Freshly prepared PAM/AS and PPG/AS NPs (at molar ratio of AS/PAMAM = 6:1) were used in the experiments that follow.
Particle Size and Morphology Study of Nanoparticles
The particle size, zeta potential and poly-dispersity index (PDI) of nanoparticles were measured at room temperature with a particle size analyzer (Zetasizer Nano ZS, Malvern, UK). The samples were diluted with 7.4 PBS (0.01 M) to a final concentration of 0.17 mM PAMAM or PPG before being measured. The transmission electron micrograph (TEM) study was performed using a HITACHI H-600 (Hitachi High-Technologies, Japan), operated at 75 kV. In total, 20 μL of PAM/AS and PPG/AS NPs were placed on carbon-coated Formvar copper grids and air-dried. Negative staining was performed by adding a drop of 2% phosphotungstic acid solution to the copper grid containing the samples. The samples were determined after they were air-dried.
Characterization of the Interaction Between PAMAM and AS
During the preparation of the PAM/AS NPs, the color of AS transitioned from red to purple. This phenomenon was similar to that of the classic reaction between iodine and starch (20), which implies that there are strong intermolecular forces between PAMAM and AS. Therefore, characterizations of PAM/AS NPs were performed to confirm this assumption.
UV–Vis Spectroscopy and HPLC Detection
The ultraviolet–visible (UV–vis) spectra of AS and PAM/AS NPs were detected by UV–vis spectrophotometry (Agilent 8453, Agilent Technology, USA). Three organic solvents: methanol, ethanol and DMSO were added to PAM/AS NPs, and the samples were vortexed for 20 min. These solvents were supposed to break down the structure of the carrier, or the intermolecular forces between the drug and carrier, to release the drug into the solvents (19,21). The free AS in methanol and the PAM/AS NPs in pH 7.4 PBS (0.01 M) were detected as controls.
AS in methanol and PAM/AS NPs in pH 7.4 PBS solution and methanol were detected by HPLC/UV detection as described in “Solubility of AS”; the detection was recorded at λ = 545 nm.
1H NMR Spectroscopy
For 1H NMR spectroscopy, AS and lyophilized PAM/AS NPs (prepared at the ratio of AS/PAMAM = 10:1) were dissolved in the D2O and DMSO-d6, respectively, and analyzed at 300 MHz (Bruker, Germany).
The Combination Capability of PAMAM with AS
Establishment of an Analytical Method for the Combined AS
PAM/AS NPs prepared at a AS/PAMAM molar ratio of 6 : 1 were chosen as the standard sample for establishment of the analytical method. PAM/AS NPs standard solution (containing AS 3.03 mM) was diluted with 7.4 PBS to the concentration range of 30.3–151.4 μM. Each sample was determined using a 752 UV–vis spectrophotometer (Qinghua Instruments, China) at λ = 545 nm, and a calibration curve of the combined AS was established.
Maximum Amount of AS Combined to Each PAMAM Molecule
A series of PAM/AS NPs were prepared at molar ratios of AS/PAMAM = 1:0.003, 1:0.007, 1:0.013, 1:0.020, 1:0.033, 1:0.066, 1:0.132, 1:0.168, 1:0.201, and 1:0.251. The concentration of the combined AS was determined by UV spectrophotometer after being diluted by pH 7.4 PBS. The AS combination percentage (percent) was calculated using the following equation:
 |
Cytotoxic Activity Assay
K562 leukemia cells and SK-BR-3 breast cancer cells were maintained at 37°C in RPMI 1640 with 10% FBS and 10,000 U/mL of penicillin/streptomycin, in an atmosphere of 5% CO2 with 90% relative humidity. Cells were seeded in 96-well plates at a density of 5 × 10³ cells/well for the K562 cells and 1 × 10⁴ cells/well for the SK-BR-3 cells. After 24 h of incubation, the medium was replaced with fresh medium containing PAMAM, PPG, PAM/AS NPs, PPG/AS NPs and free AS at four different concentrations. After 48 h of incubation at 37°C, cell proliferation was assayed through Cell Counting Kit-8 (CCK-8).
Statistical Analysis
The results were presented as the mean ± SD of at least three independent experiments. All statistical analyses were performed using “SPSS 14.0.”
RESULTS AND DISCUSSION
Solubility of AS
The solubility of AS in water and pH 7.4 PBS was 0.39 ± 0.02 and 0.43 ± 0.03 μg/mL, respectively. However, AS was significantly solubilized in the 1% SDS solution (234.06 ± 5.58 μg/mL). The results revealed that AS has extremely low aqueous solubility. Therefore, it was assumed that free AS was completely removed by filtration in the preparation of the nanoparticles.
Preparation of PAM/AS and PPG/AS NPs
In the preparation of PAM/AS NPs, PAMAM was added to the AS methanol solution drop wise under continuous stirring. An obvious color transition from red to dark red was observed when PAMAM was added, and the color of mixture was deepened as the amount of AS increased. Subsequently, the color of the mixture transitioned from dark red to purple when the mixture was dissolved in pH 7.4 PBS (Fig. 2). The same color transition was also observed in the preparation of PPG/AS NPs.
Fig. 2.

The color of a AS in methanol, b AS mixed with PAMAM in methanol, and c PAM/AS NPs in pH 7.4 PBS solution
As the ratio of AS/PAMAM increased, it became more challenging to dissolve the dried product in the PBS solution. When the AS/PAMAM molar ratio was above 15 : 1, the precipitation of AS was observed after hydration. The presence of precipitate indicated that the maximum number of AS combined to each PAMAM molecule was between 7.5 and 15. Therefore, PAM/AS NPs were prepared at a molar ratio of AS/PAMAM = 6:1 in the following experiments to ensure complete encapsulation of AS.
Particle Size, Zeta Potential, and TEM
After encapsulation of AS, the average particle size of PAMAM and PPG was increased from less than 10 to 40 and 96 nm, respectively (Table I). The nanoparticles with diameters between 10 and 100 nm possessed effective extravasation from the leaky vasculature of tumor tissues and have the potential to avoid filtration by the kidney and specific capture by the liver (22,23). The zeta potential of PAMAM was severely decreased to 5 mV below after conjugated with PEG, which was ascribed to the masked surface groups by long chains of PEG (24). The interactions between AS and PAMAM also interfere with the charge of nanoparticles resulting in the sharply decrease of zeta potential.
Table I.
Particle Size, Zeta Potential, and PDI of Preparations
| Preparations | PAMAM | PAM/AS NPs | PPG | PPG/AS NPs |
|---|---|---|---|---|
| Diameter (nm) | 5.77 ± 0.25 | 40.44 ± 2.12 | 9.55 ± 0.02 | 96.70 ± 1.11 |
| PDI | 0.234 ± 0.006 | 0.958 ± 0.036 | 0.337 ± 0.004 | 0.407 ± 0.006 |
| Zeta potential (mV) | 15.47 ± 1.80 | 2.37 ± 0.58 | 3.83 ± 0.76 | 3.15 ± 1.07 |
TEM was performed to further reveal the morphologies of PAM/AS and PPG/AS NPs (Fig. 3). The images showed that PAM/AS NPs were prone to aggregation, which was consistent with high PDI, whereas PPG/AS NPs were loosely associated. Although AS encapsulated by the carriers would interfere with the stability of PAMAM and PPG, the steric stabilization of PEG contributed to the smaller PDI and produced fewer aggregates.
Fig. 3.
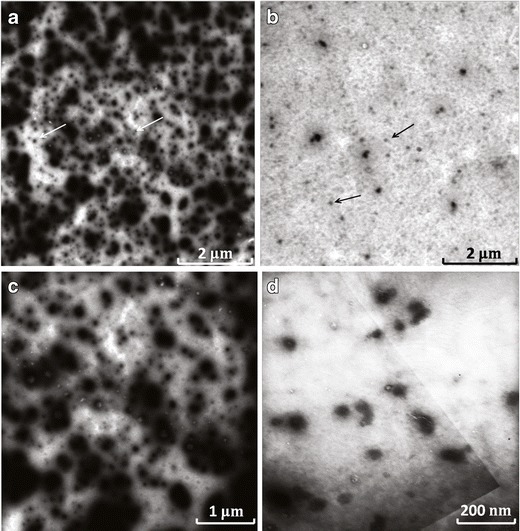
TEM image for a PAM/AS NPs and b PPG/AS NPs; scale bar represents 2 μm. c, d is the amplification of a and b, respectively
Characterization of a Strong Interaction Between PAMAM and AS
UV–Vis Spectroscopy and HPLC Detection
The spectrum of AS was distinctly different from that of PAM/AS NPs in four solvents (Fig. 4). The UV–vis spectra showed that the maximum peak of AS at 272 nm disappeared in the PAM/AS NPs, and the other major peaks at 518 and 556 nm shifted to 545 and 585 nm, respectively (Table II). The spectra of PAM/AS NPs in various solvents were approximately identical. Thus, it was reasonable to conclude that AS was encapsulated into the carriers and the organic solvents did not break down the structure of PAMAM and released AS into the solvents. Similarly, the previous study on the UV–vis spectra of AS at different pH values showed that the integral spectrum of AS shifted at different pH values along with the color transitions (25). However, the peak of AS at 272 nm did not disappear as the pH value changed, and the color of PAM/AS NPs was darker than AS at pH 7.4. Therefore, the effect of PAMAM on AS was distinct compared to the effect of pH on AS.
Fig. 4.
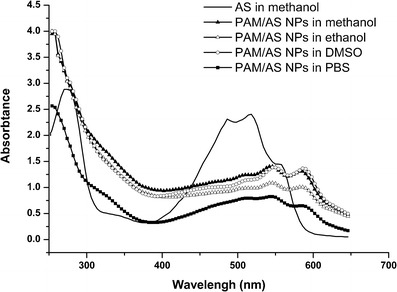
UV–vis spectra of purified AS in methanol and PAM/AS NPs in different solvents
Table II.
Major Absorption Peaks of AS Preparations in Different Solvents
| Preparations | Peak 1 | Peak 2 | Peak 3 | Peak 4 |
|---|---|---|---|---|
| AS (in methanol) | 272 | 512 | 518 | 556 |
| PAM/AS NPs (in methanol) | N/A | 512 | 544 | 585 |
| PAM/AS NPs (in ethanol) | N/A | 511 | 545 | 585 |
| PAM/AS NPs (in DMSO) | N/A | 513 | 548 | 587 |
| PAM/AS NPs (in PBS solution) | N/A | 512 | 545 | 585 |
The results of HPLC detection showed that the peak of AS in free AS was at retention time (tR) = 7.46 min, while the peak of AS in PAM/AS NPs appeared at tR = 4.55 min and 4.68 min in methanol and PBS, respectively (Fig. 5). The peak at approximately tR = 4.5 min was assumed to be the characteristic peak of the combined AS, which possessed higher polarity. Considering the results of the UV–vis and HPLC detection, it is reasonable to suggest that strong intermolecular forces were formed between the PAMAM and AS molecules.
Fig. 5.
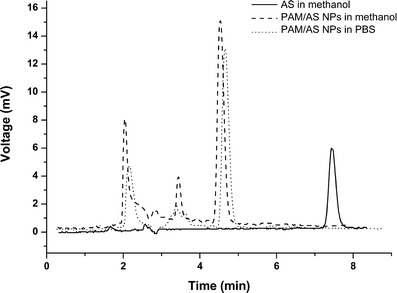
HPLC spectra of purified AS in methanol, PAM/AS NPs in methanol, and PBS solution
1H NMR Spectroscopy
The 1H NMR spectrum for AS is depicted in Fig. 6 and shows the following characteristic signals: δ (ppm) 1.50–1.60 (s, 3H, H-15), 1.60–1.70 (s, 3H, H-16), 2.10–2.15 (s, 3H, H-17), 5.05–5.20 (m, 1H, H-13), 5.70–5.95 (m, 1H, H-11), 7.05–7.15 (s, 1H, H-3), 7.30–7.40 (s, 2H, H-6,7), 12.25 (s, 1H, H-8), and 12.35 (s, 1H, H-5). In comparison with the spectrum of AS, the weak signal intensity of combined AS in the spectrum was explained by the large amount of protons in PAMAM. However, it was not difficult to find that the signal of H-3 and H-6,7 from AS disappeared in the spectrum of PAM/AS NPs, and new peaks appeared at 6.5–7.0 ppm. The signal of H-11 and H-13 also shifted.
Fig. 6.
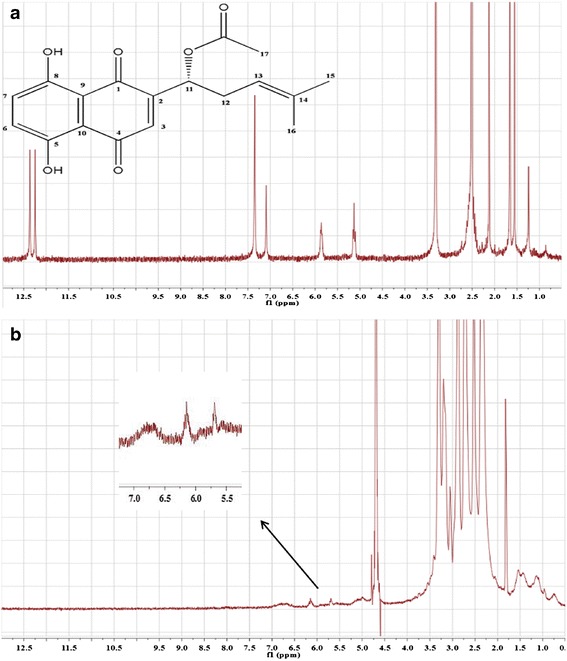
1H NMR spectra of a AS in DMSO-d6 and b PAM/AS NPs in D2O
The results provide further evidence that strong intermolecular forces were formed between AS and PAMAM, and the migration of peaks indicated that the specific binding sites on AS were the hydroxide radicals (H-6,7). It was assumed that hydrogen bonds and electrostatic interactions formed between the hydroxide radicals and the amine groups of PAMAM. However, the specific binding sites on PAMAM remain uncertain as AS was capable of combining with both the peripheral amine ends and the interior amide groups.
The Combination Capability of PAMAM with AS
The calibration curve was described as C = 180.34A + 5.07 (R2 = 0.9998). As PAMAM has no absorbance at λ = 545 nm, the determination of the combined AS would not be affected by variations in PAMAM concentrations (26). Thus, the concentration of combined AS could be calculated according to the calibration curve.
A linear increase in the combination percentage of AS was observed when the concentration of PAMAM was below 0.2 mM (AS/PAMAM = 1:0.066 equals to PAMAM/AS = 1:15) and the combination percentage of AS is less than 100% which indicates that AS is excessive. However, the combination percentage of AS was approximately invariant (100%) when the concentration of PAMAM was above 0.4 mM (AS/PAMAM = 1:0.132 equals to PAMAM/AS = 1:7.5) implying the completely combination between AS and PAMAM (Fig. 7a). Therefore, the maximum amount of AS combined with one PAMAM molecule is between 7.5 and 15. Furthermore, the dependence of the solubility of combined AS on the concentration of PAMAM (below 0.2 mM) was described by a linear equation, y = 12.82x–0.18, R2 = 0.9908 (Fig. 7b). The coefficients of the line could be ascribed to a physical conception (27). The directional coefficient (12.82) was interpreted as the maximum amount of AS combined with one PAMAM molecule. The free term (−0.18) approaching zero, represented the solubility of AS in pure water without PAMAM. Hence, the interpretation of the coefficients was in line with previous studies—the maximum amount of combined AS to each PAMAM molecular was between 7.5 and 15 and extremely low aqueous solubility of AS (0.39 ± 0.02 μg/mL).
Fig. 7.
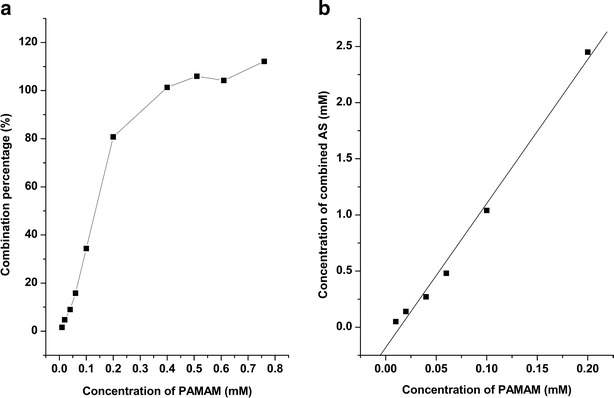
Dependence of a combination percentage of AS on the concentration of PAMAM and b solubility of combined AS on the concentration of PAMAM (below 0.2 μM)
A single molecule of PAMAM G4 contains 250 potential bonding sites, which includes 64 surface primary amino groups, 62 internal tertiary amine groups, and 124 amide groups (27). The maximum amount of combined AS was far less than the total potential binding sites or any part of binding sites of PAMAM. However, the encapsulation of fluorouracil (5-FU) by PAMAM showed different results. The maximum combined 5-FU was 90 which indicated that the drug molecules are combined not only with the surface amine groups but also with those inside (27). Thus, the binding sites on PAMAM were likely the surface amine groups through hydrogen bonds, electrostatic and/or hydrophobic interactions (12). Therefore, it was reasonable to infer that the stereo-specific blockade of the drug molecules hindered the combination of more AS molecules to PAMAM. Similar conclusion has been reached in the study of complex of PAMAM and methotrexate (19).
Cytotoxicity
The in vitro antitumor effects of the AS nanoparticles were evaluated by the cell growth inhibition rate (Fig. 8). Free AS exhibited the highest cytotoxicity among all groups. For K562 leukemia cells, the cell growth inhibition rates of both AS nanoparticles were almost the same as those at lower concentrations, whereas the cytotoxicity of PAM/AS NPs and PPG/AS NPs significantly increased to 75% and 55% at 10 μM, respectively. In comparison with the K562 cells, PAM/AS NPs demonstrated lower cytotoxicity to SK-BR-3 cells, which was approximately 45% inhibition at 10 μM. However, the cytotoxicity of PPG/AS NPs was invariant at the highest concentration. The strong combination between AS and PAMAM may explain the decrease in the cytotoxicity of the nanoparticles versus that of free AS. This type of formulation may allow for the use of AS as an antitumor agent. The blank carrier PPG exhibited distinctly lower cytotoxicity than PAMAM, and PPG/AS NPs demonstrated better stability and more effective antitumor activity than PAM/AS NPs.
Fig. 8.
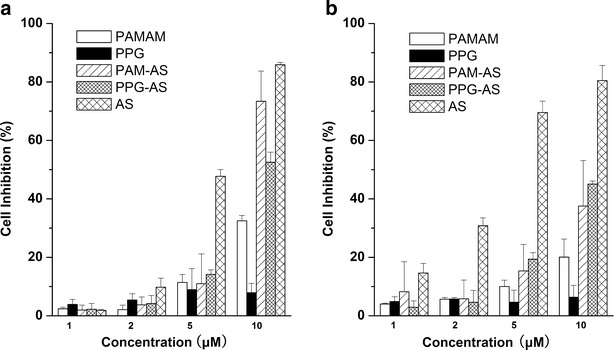
Cytotoxicity of PAMAM, PAM/AS NPs, PPG, PPG/AS NPs, and free AS to a K562 cells and b SB-KR-03 cells (mean ± SD, n = 6). The PAM/AS and PPG/AS NPs were prepared at molar ratio of PAMAM (or PPG)/AS = 1:6
CONCLUSIONS
In this work, AS nanoparticles were prepared for the first time using hyperbranched-carriers PAMAM dendrimers and PPG. Obvious color transitions implied strong interactions between AS and PAMAM. To verify the AS and PAMAM interaction, the PAM/AS NPs were characterized by UV–vis, HPLC, and 1H-NMR detection. The formation of strong intermolecular forces was verified, and the binding sites were identified as the hydroxide radicals of AS. Furthermore, the maximum combination number of AS with each PAMAM molecule was measured. Although the intermolecular forces between AS and PAMAM decrease the antitumor activity of AS, the cytotoxicity of PAM/AS NPs and PPG/AS NPs remained effective at 10 μM. These results suggested that both PAMAM and PPG are possible carriers for AS, with PPG demonstrating lower cytotoxicity and PPG/AS NPs exhibiting higher stability. Future studies should include determining the specific binding sites on PAMAM and broadly applying PAMAM and PPG as nanocarriers for other structurally analogous drugs.
Acknowledgments
This work was supported by the Natural Science Foundation of Jiangsu Province grant (no. BK2011771) and the Fundamental Research Funds for the Central Universities (no. JKQ2011019).
Footnotes
Jianqing Peng, Wen Zhou, and Xinyi Xia contributed equally to this work.
Contributor Information
Zhenghong Wu, Phone: +86-15-062208341, FAX: +86-025-83179703, Email: zhenghongwu66@cpu.edu.cn.
Zhengrong Li, Phone: +86-25-86863153, FAX: +86-25-86862731, Email: lzr@njmu.edu.cn.
References
- 1.Papageorgiou VP. Naturally occurring isohexenylnaphthazarin pigments: a new class of drugs. Planta Med. 1980;38(03):193–203. doi: 10.1055/s-2008-1074864. [DOI] [PubMed] [Google Scholar]
- 2.Hayashi M. Pharmacological studies of Shikon and Tooki. (2) Pharmacological effects of the pigment components, shikonin and acetylshikonin. Nihon yakurigaku zasshi. Folia pharmacol Jpn. 1977;73(2):193–203. doi: 10.1254/fpj.73.193. [DOI] [PubMed] [Google Scholar]
- 3.Sankawa U, Ebizuka Y, Miyazaki T, Isomura Y, Otsuka H. Antitumor activity of shikonin and its derivatives. Chem Pharm Bull. 1977;25(9):2392. doi: 10.1248/cpb.25.2392. [DOI] [PubMed] [Google Scholar]
- 4.Papageorgiou VP, Assimopoulou AN, Samanidou V, Papadoyannis I. Recent advances in chemistry, biology and biotechnology of alkannins and shikonins. Curr Org Chem. 2006;10(16):2123–2142. doi: 10.2174/138527206778742704. [DOI] [Google Scholar]
- 5.Chang YS, Kuo SC, Weng SH, Jan SC, Ko FN, Teng CM. Inhibition of platelet aggregation by shikonin derivatives isolated from Arnebia euchroma. Planta Med. 1993;59(05):401–404. doi: 10.1055/s-2006-959718. [DOI] [PubMed] [Google Scholar]
- 6.Staniforth V, Wang SY, Shyur LF, Yang NS. Shikonins, phytocompounds from Lithospermum erythrorhizon, inhibit the transcriptional activation of human tumor necrosis factor α promoter in vivo. J Biol Chem. 2004;279(7):5877–5885. doi: 10.1074/jbc.M309185200. [DOI] [PubMed] [Google Scholar]
- 7.Lee HJ, Lee HJ, Magesh V, Nam D, Lee EO, Ahn KS, et al. Shikonin, acetylshikonin, and isobutyroylshikonin inhibit VEGF-induced angiogenesis and suppress tumor growth in lewis lung carcinoma-bearing mice. Yakugaku Zasshi. 2008;128(11):1681–1688. doi: 10.1248/yakushi.128.1681. [DOI] [PubMed] [Google Scholar]
- 8.Zeng Y, Liu G, Zhou LM. Inhibitory effect of acetylshikonin on human gastric carcinoma cell line SGC-7901 in vitro and in vivo. World J Gastroenterol. 2009;15(15):1816. doi: 10.3748/wjg.15.1816. [DOI] [PMC free article] [PubMed] [Google Scholar]
- 9.Rajasekar S, Park DJ, Park C, Park S, Park YH, Kim ST, et al. In vitro and in vivo anticancer effects of Lithospermum erythrorhizon extract on B16F10 murine melanoma. J Ethnopharmacol. 2012;144:335–345. doi: 10.1016/j.jep.2012.09.017. [DOI] [PubMed] [Google Scholar]
- 10.Svenson S, Tomalia DA. Dendrimers in biomedical applications—reflections on the field. Adv Drug Deliv Rev. 2012;57:2106–2129. doi: 10.1016/j.addr.2005.09.018. [DOI] [PubMed] [Google Scholar]
- 11.Yiyun C, Tongwen X. Dendrimers as potential drug carriers. Part I. Solubilization of non-steroidal anti-inflammatory drugs in the presence of polyamidoamine dendrimers. Eur J Med Chem. 2005;40(11):1188–1192. doi: 10.1016/j.ejmech.2005.06.010. [DOI] [PubMed] [Google Scholar]
- 12.D’Emanuele A, Attwood D. Dendrimer–drug interactions. Adv Drug Deliv Rev. 2005;57(15):2147–2162. doi: 10.1016/j.addr.2005.09.012. [DOI] [PubMed] [Google Scholar]
- 13.Maingi V, Kumar MVS, Maiti PK. PAMAM dendrimer–drug interactions: effect of pH on the binding and release pattern. J Phys Chem B. 2012;116(14):4370–4376. doi: 10.1021/jp211515g. [DOI] [PubMed] [Google Scholar]
- 14.Gupta U, Agashe HB, Asthana A, Jain N. Dendrimers: novel polymeric nanoarchitectures for solubility enhancement. Biomacromolecules. 2006;7(3):649–658. doi: 10.1021/bm050802s. [DOI] [PubMed] [Google Scholar]
- 15.Zhao L, Wu Q, Cheng Y, Zhang J, Wu J, Xu T. High-throughput screening of dendrimer-binding drugs. J Am Chem Soc. 2010;132(38):13182–13184. doi: 10.1021/ja106128u. [DOI] [PubMed] [Google Scholar]
- 16.Malik N, Wiwattanapatapee R, Klopsch R, Lorenz K, Frey H, Weener J, et al. Dendrimers: relationship between structure and biocompatibility in vitro, and preliminary studies on the biodistribution of 125I-labelled polyamidoamine dendrimers in vivo. J Control Release. 2000;65(1):133–148. doi: 10.1016/S0168-3659(99)00246-1. [DOI] [PubMed] [Google Scholar]
- 17.Bhadra D, Bhadra S, Jain S, Jain N. A PEGylated dendritic nanoparticulate carrier of fluorouracil. Int J Pharm. 2003;257(1):111–124. doi: 10.1016/S0378-5173(03)00132-7. [DOI] [PubMed] [Google Scholar]
- 18.Luo D, Haverstick K, Belcheva N, Han E, Saltzman WM. Poly(ethylene glycol)-conjugated PAMAM dendrimer for biocompatible, high-efficiency DNA delivery. Macromolecules. 2002;35(9):3456–3462. doi: 10.1021/ma0106346. [DOI] [Google Scholar]
- 19.Jiang YY, Tang GT, Zhang LH, Kong SY, Zhu SJ, Pei YY. PEGylated PAMAM dendrimers as a potential drug delivery carrier: in vitro and in vivo comparative evaluation of covalently conjugated drug and noncovalent drug inclusion complex. J Drug Target. 2010;18(5):389–403. doi: 10.3109/10611860903494203. [DOI] [PubMed] [Google Scholar]
- 20.Rundle R, Foster JF, Baldwin R. On the nature of the starch—iodine complex 1. J Am Chem Soc. 1944;66(12):2116–2120. doi: 10.1021/ja01240a031. [DOI] [Google Scholar]
- 21.Kontogiannopoulos KN, Assimopoulou AN, Hatziantoniou S, Karatasos K, Demetzos C, Papageorgiou VP. Chimeric advanced drug delivery nano systems (chi-aDDnSs) for shikonin combining dendritic and liposomal technology. Int J Pharm. 2011;422:381–389. doi: 10.1016/j.ijpharm.2011.09.031. [DOI] [PubMed] [Google Scholar]
- 22.Malam Y, Loizidou M, Seifalian AM. Liposomes and nanoparticles: nanosized vehicles for drug delivery in cancer. Trends Pharmacol Sci. 2009;30(11):592–599. doi: 10.1016/j.tips.2009.08.004. [DOI] [PubMed] [Google Scholar]
- 23.Gullotti E, Yeo Y. Extracellularly activated nanocarriers: a new paradigm of tumor targeted drug delivery. Mol Pharm. 2009;6(4):1041–1051. doi: 10.1021/mp900090z. [DOI] [PMC free article] [PubMed] [Google Scholar]
- 24.Utreja S, Khopade A, Jain N. Lipoprotein-mimicking biovectorized systems for methotrexate delivery. Pharm Acta Helv. 1999;73(6):275–279. doi: 10.1016/S0031-6865(99)00002-3. [DOI] [PubMed] [Google Scholar]
- 25.Cho MH, Paik YS, Hahn TR. Physical stability of shikonin derivatives from the roots of Lithospermum erythrorhizon cultivated in Korea. J Agric Food Chem. 1999;47(10):4117–4120. doi: 10.1021/jf9902853. [DOI] [PubMed] [Google Scholar]
- 26.Majoros IJ, Myc A, Thomas T, Mehta CB, Baker JR. PAMAM dendrimer-based multifunctional conjugate for cancer therapy: synthesis, characterization, and functionality. Biomacromolecules. 2006;7(2):572–579. doi: 10.1021/bm0506142. [DOI] [PubMed] [Google Scholar]
- 27.Buczkowski A, Sekowski S, Grala A, Palecz D, Milowska K, Urbaniak P, et al. Interaction between PAMAM-NH2 G4 dendrimer and 5-fluorouracil in aqueous solution. Int J Pharm. 2011;408(1):266–270. doi: 10.1016/j.ijpharm.2011.02.014. [DOI] [PubMed] [Google Scholar]


