Background: Store-operated calcium entry requires the redistribution of ER localized STIM1 to ER-PM junctions.
Results: Altering ER morphology by modulating reticulon expression affects STIM1 redistribution and consequently calcium entry.
Conclusion: Reticulon shaping of the ER is critical for store-operated calcium entry.
Significance: Understanding how membrane shaping proteins participate in the regulation of organelle function is essential in elucidating the structure-function interdependence of organelles.
Keywords: Apoptosis, Cell Signaling, Endoplasmic Reticulum (ER), Imaging, Membrane, reticulons
Abstract
Despite recent advances in understanding store-operated calcium entry (SOCE) regulation, the fundamental question of how ER morphology affects this process remains unanswered. Here we show that the loss of RTN4, is sufficient to alter ER morphology and severely compromise SOCE. Mechanistically, we show this to be the result of defective STIM1-Orai1 coupling because of loss of ER tubulation and redistribution of STIM1 to ER sheets. As a functional consequence, RTN4-depleted cells fail to sustain elevated cytoplasmic Ca2+ levels via SOCE and therefor are less susceptible to Ca2+ overload induced apoptosis. Thus, for the first time, our results show a direct correlation between ER morphology and SOCE and highlight the importance of RTN4 in cellular Ca2+ homeostasis.
Introduction
The endoplasmic reticulum (ER)2 is a structurally and functionally diverse organelle. It is composed of morphologically distinct domains with prominent functional specializations (reviewed in Refs. 1, 2). The most noticeable of these domains are the nuclear envelope, ER sheets and ER tubules. ER sheets are relatively flat structures that are densely packed with polyribosomes, offer a large volume-to-surface ratio, and are enriched in proteins involved in the synthesis, folding, and sorting of integral membrane and secreted proteins (3). Accordingly, these structures are abundant in professional secretory cells, such as plasma cells and pancreatic cells. ER tubules on the other hand are long cylindrical structures with high membrane curvature that form an interlinked network via three-way junctions (4). The surface-to-volume ratio (5), polyribosome density (5, 6), and molecular chaperones levels of ER tubules are lower than that of ER sheets (3). Hence, in contrast to ER sheets, ER tubules are often associated with lipid synthesis and calcium (Ca2+) signaling, on the premise that they are enriched in cell types specialized in those functions. For example, muscle cells, specialized in Ca2+ signaling, and adrenal cortex cells, that produce high volumes of steroids, have extensive tubular ER networks. Such cell-type specific enrichment of ER domains conveys how the morphology of the ER in a given cell type depends on which of its functions predominates and reinforces the theorem of functional specialization of ER domains. ER configuration can also have simpler justifications. For instance, a predominantly tubular ER configuration can be advantageous as it enables the extensive and uniform distribution of ER membranes throughout the cytoplasm without interfering with the diffusion and trafficking of cytoplasmic elements. Furthermore, diffusion of proteins to a target becomes more efficient as dimensionality is reduced (7). Therefore ER tubules (1D) are intrinsically more advantageous than sheets (2D) for processes relying on targeted diffusion, such as store-operated Ca2+ entry (SOCE).
Ca2+ depletion from the ER prompts the influx of extracellular Ca2+ via SOCE; a process essential to sustain prolonged Ca2+ transients and refill internal stores. The core molecular components of SOCE have recently been identified and include the ER-resident Ca2+ sensor STIM1 (8, 9) and the plasma membrane (PM)-resident Ca2+ channel Orai1 (10–12). The processes underlying SOCE activation require the structural rearrangement and dynamic redistribution of ER and PM components and their interaction at ER-PM junctions (reviewed in Ref. 13). Briefly, under replete conditions Ca2+ binds and keeps dimeric STIM1 in a compact, inactive conformation. ER depletion alters STIM1 conformation, inherent to Ca2+ dissociation, resulting in oligomerization of STIM1 and its activation via extension of its cytosolic domain. This domain harbors the Orai1 interacting domain (known variably as CAD (14), SOAR (15) or OASF (16)) and a C-terminal lysine-rich repeat. In the active, extended conformation, the lysine-rich repeat, through interaction with PM lipids, concentrates oligomerized STIM at ER-PM junctions. At ER-PM junctions, extended STIM1 oligomers can bridge the junctional gap and interact with and activate Orai1 channels, leading to Ca2+ influx. STIM1-Orai1 complexes are disassembled, and the system is reset once Ca2+ transients cease and internal stores are replenished. Concurrently to these mechanistic insights, other studies have demonstrated the paramount importance of SOCE in numerous cell processes, including apoptosis (reviewed in Ref. 17). Despite such advancements in the field, the role of ER structure in SOCE has received little attention.
The structure of the ER is established through the use of a wide array of proteins involved in ER membrane fusion, anchorage, and sculpting (reviewed in Refs. 1, 2, 18). The most studied and best characterized of these are the ubiquitously expressed ER-sculpting proteins of the reticulon (RTN) family. Mammals have four RTN paralogs (RTN1–4) that each generates multiple isoforms (19). The N-terminal region of these isoforms is highly divergent and is associated with biological functions believed to be initiated from the cell surface (20, 21). RTNs, however, almost exclusively localize to the ER (21, 22). Unlike most ER-resident proteins, they do not possess a canonical ER localization signal, and their ER retention seems to be due to structural elements in their C-terminal region (22, 23). This C-terminal region, called the reticulon homology domain (RHD), is evolutionarily conserved and common to all RTN family members (19). The RHD consists of 150–200 amino acid residues and contains a pair of hydrophobic regions separated by a hydrophilic loop and followed by a short C-terminal tail. The hydrophobic segments are longer than typical single pass transmembrane domains and are believed to form hairpins (24). These hairpins, too short to completely span the ER membrane, displace more of the outer leaflet than the inner leaflet. Additionally, RTNs have also been shown to form arc-shaped oligomers (25). These “wedging” and “scaffolding” mechanisms bestow RTNs with membrane curvature generating/stabilizing properties. This is best demonstrated in in vitro reconstitution experiments, using yeast homologues, where it was demonstrated that RTNs are capable of transforming proteoliposomes into tubules (26). Accordingly, in vivo, these proteins are necessary and sufficient for sculpting ER elements with high membrane curvature, such as ER tubules (24, 27). Therefore, overexpression of RTNs leads to the enrichment of ER tubules at the expense of ER sheets, while the converse is true upon depletion of RTNs (24).
Coincidental evidence from recent studies collectively suggests that changes in ER morphology may play a role in Ca2+ signaling. Studies investigating the role of the cytoskeleton in SOCE reported a decrease in Ca2+ influx following disruption of the microtubule cytoskeleton (28, 29). Interestingly, microtubule depolymerization has also been reported to lead to the collapse of the ER network and conversion of peripheral ER tubules to extended ER sheets (30). Additionally, SOCE is also disrupted during cell division (29, 31, 32), when similar changes in ER structure are also known to take place (33, 34). Despite such examples of association and tremendous interest in the field, insufficient understanding of ER morphogenesis has so far limited efforts to directly test the long suspected importance of ER structure in SOCE. This limitation has recently been alleviated with the identification and functional characterization of ER shaping proteins. These findings offer the opportunity to use these proteins as a novel tool to modulate ER morphology and directly assess the interdependence of ER structure and SOCE. Here we demonstrate in a simple cell system that the loss of RTN4 results in ER morphological changes that selectively disrupt certain structure-sensitive ER processes such as SOCE and highlight the importance of RTN4 in Ca2+ homeostasis.
EXPERIMENTAL PROCEDURES
Reagents and Antibodies
2-APB and thapsigargin were obtained from Calbiochem. Gadolinium trichloride was obtained from Sigma. Human recombinant PDGF-BB, anti-BiP, and anti-HSP90 antibodies were obtained from BD Biosciences. Anti-caspase-3, anti-caspase-8, anti-phospho-eIF2α, anti-eIF2α, anti-phospho-JNK, anti-JNK, anti-Orai1, anti-PARP, and anti-STIM1 were obtained from Cell Signaling. Anti-β-actin (1:5000 dilution) and anti-ATF6 were obtained from Abcam. Anti-RTN4a/b (1:5,000 dilution) was obtained from Imgenex. Anti-calreticulin, anti-GRP94, anti-SERCA2, anti-TRPC1 were obtained from Santa Cruz. Anti-calnexin was obtained from Stressgen. AlexaFluor680-labeled donkey anti-goat, anti-mouse, and anti-rabbit antibodies were obtained from Invitrogen. IRDye800-labeled donkey anti-mouse and anti-rabbit antibodies were obtained from Rockland. Primary antibodies were used at 1:1,000 dilutions unless otherwise specified. All secondary antibodies were used at 1:10,000.
Plasmids and Cloning
GFP-Sec61b (plasmid 15108), STIM1-YFP (plasmid 19754), Orai1-Myc (plasmid 21638), Orai1-YFP (plasmid 19756), and Orai1-CFP (plasmid 19757) were obtained from Addgene. mCherry-STIM1 was kindly provided by Dr Richard S Lewis (Stanford University, Palo Alto, CA). To generate GFP-RTN4b and GFP-RHD, RTN4b and RHD were amplified by PCR from pcDNA3 (20). The PCR reaction also added an HA tag to the C terminus. The PCR products were cloned into pEGFP-C1 (Clontech) using EcoRI and BamHI. TM2mut was generated using GFP-RTN4b as a template and according to Ref. 35. Initially, a small C-terminal fragment of RTN4b was PCR amplified to insert the extra nucleotides into TM2. This fragment was then used as a reverse primer to generate full-length TM2mut, which was then cloned into pEGFP-C1 using EcoRI and BamHI. To generate mCherry-tagged constructs, eGFP in pEGFP-N3 (Clontech) was substituted by mCherry to generate pmCherry-N3. mCherry was PCR amplified from mCherry-Myc-KDEL kindly provided by Dr. Pietro De Camilli (Yale University, New Haven, CT). To generate Orai1-mCherry, Orai1 was amplified by PCR from Orai1-Myc and cloned into pmCherry-N3, using EcoRI and KpnI. STIM1 fragments CAD and D7 were generated by PCR based on Ref. 14 and cloned into pmCherry-N3 to generate CAD-mCherry and D7-mCherry using BglII and XmaI. Plasmids for lentiviral transduction were generated by cloning the appropriate RTN4b related PCR product into pHR-SIN-SFFV using BamHI and XhoI.
Cell Culture, Transfection, and Transduction
WT and RTN4-KO MEFs were isolated from C57Bl6 and congenic RTN 4a/b KO mouse embryos (36, 37) and immortalized by serial passaging. Briefly, embryos were harvested at E13.5 and primary MEFs were generated following decapitation and evisceration of embryos and trypsinization of the bodies after mincing. The resulting slurry was plated in 75-cm2 flasks. Cells were maintained in DMEM (Invitrogen) supplemented with 10% FBS and 2 mm glutamine in the presence of 100 units/ml penicillin/streptomycin. Cells were passaged and plated at 1 × 10⁶ cells in 100-mm dishes every 3 days. After crisis, cells were expanded and used for experiments as pooled immortalized clones. For transient expression, constructs were transfected into cells for 24 h using Lipofectamine 2000 (Invitrogen) according to the manufacturer's instructions. To establish RTN4-KO MEFs stably expressing RTN4b, RHD, and TM2mut, lentiviruses were packaged by co-transfection of the appropriate constructs with the 3rd generation packaging plasmids in HEK293T cells in 100-mm dishes with Lipofectamine 2000. Medium was replaced the next day with OptiMEM (Invitrogen), viral particles were collected for 24 h, centrifuged at 200 × g for 5 min, passed through a 0.45-μm filter, and stored at 4 °C until used. Ready to use RFP lentiviral particles were purchased from AMS Biotechnology. Cells were transduced with the viral suspensions in the presence of 8 mg/ml Polybrene (Sigma-Aldrich) in 6-well plates. Following 24 h, cells were passaged to 100-mm dishes and allowed to reach confluency. Transgene expression was confirmed by Western blot analysis and immunofluorescence by blotting against HA tag, and cell lines with physiologic levels were kept.
Western Blot Analysis
For immunoblot assays, cells were harvested in ice-cold lysis buffer (50 mm Tris-HCl pH 7.4, 0.1% SDS, 0.1% sodium deoxycholate, 0.1 mm EDTA, 0.1 mm EGTA, 1% Nonidet P-40, 1.5 mg/ml protease inhibitor mixture (Roche), 0.25 mg/ml AEBSF (Roche). Proteins were extracted for 45 min at 4 °C, resolved by SDS-PAGE, and transferred onto nitrocellulose membranes for 2 h at 100 V. Membranes were blocked using 0.1% (w/v) casein (Bio-Rad) in TBS for 1 h and incubated with primary antibodies overnight at 4 °C. Next, membranes were washed with TBS-T (TBS containing 0.1% Tween 20) and incubated with conjugated secondary antibodies for 1 h at room temperature. Finally, membranes were washed with TBS-T and developed using the Odyssey system (Li-Cor) and further analyzed using ImageJ software (NIH).
Immunofluorescence Microscopy Studies
For the detection of endogenous RTN4a/b, cells were grown on glass coverslips, fixed, and permeabilized in 100% methanol at −20 °C for 10 min and blocked with 1% BSA (Sigma). Samples were incubated with the primary antibody overnight at 4 °C, and then incubated with the secondary antibody for 1 h at room temperature. Washes were performed using PBS. Nuclei were stained with DAPI (4,6-diamidino-2-phenylindole; Sigma). Coverslips with stained cells were washed and mounted onto glass slides in Vectashield medium (Vector Laboratories) for microscopy. Images were acquired using a Leica TCS SP5 confocal laser-scanning microscope with a ×63/1.49 NA oil-immersion objective. The quantification of ER sheets and the detection of exogenous proteins were carried out using live-cell imaging on 35 mm glass-bottom dishes (MatTek). For the quantification of ER sheets, cells were stained with ER tracker and more than 50 cells per group were blindly analyzed from two independent experiments. Image analysis was performed with ImageJ software (NIH) and expressed as percentage of cytosol (total cell area minus the nucleus). For the detection of exogenous proteins, following 16 to 24 h transfection, culture medium was replaced with HEPES buffer, and cells were imaged at room temperature for no longer than an hour. For the quantification of endogenous STIM1 clusters a threshold was applied to collected images in ImageJ and only data from pixels above the threshold were quantified. The threshold was set at the minimum pixel intensity + 10% of the range of pixel intensities of the untreated WT image (threshold = min + 10%[max − min]) and was used as the global threshold for the rest of the images. Cells were outlined in thresholded images before conversion to binary images. Cell areas in binary images were analyzed using the analyze particles tool to collect area values for STIM1 signal and displayed as frequency distribution.
Electron Microscopy
For transmission electron microscopy, cells were grown to 90% confluence in a 100-mm dish. For the depletion of internal Ca2+ stores, cells were washed and bathed in Ca2+-free buffer followed by treatment with TG for 15 min at room temperature. Cells were then fixed in 2.5% glutaraldehyde/2% paraformaldehyde/2% sucrose in 0.1 m sodium cacodylate buffer, pH 7.4, for 30 min at room temperature followed by another 30 min at 4 °C. Subsequently, cells were rinsed, post-fixed in 1% osmium tetroxide for 1 h at room temperature, stained in 2% uranyl acetate in maleate buffer, pH 5.2, for a further hour then rinsed again. Finally, cells were dehydrated in ethanol, infiltrated with Epon resin and baked overnight at 60 °C. Blocks were cut using a Leica UltraCut UCT. 60-nm sections were stained using 2% uranyl acetate and lead citrate and viewed using a FEI Tencai Biotwin transmission electron microscope at 80 kV and spot size of 1. Images were taken using a Morada CCD and iTEM software (Olympus). Quantification of ER elements was carried out on 10 randomly selected cell sections for each group. ER tubules diameter was estimated from 40–45 measurements collected from 10 randomly selected cell sections from each group.
Ca2+ Measurements
For Ca2+ measurements, MEFs were incubated in loading medium (HBSS, 20 mm HEPES) containing 4 μm Fluo-4 (Invitrogen) for 30 min at 37 °C and another 30 min at room temperature. Cells were then washed and bathed in HEPES-buffered saline solution (140 mm NaCl, 1.13 mm MgCl2, 4.7 mm KCl, 2 mm CaCl2, 10 mm d-glucose, and 10 mm HEPES, adjusted to pH 7.4 with NaOH) for 15 min before Ca2+ measurements. In Ca2+-free solution, CaCl2 was omitted, and MgCl2 was increased to 2 mm. All experiments were conducted at room temperature. Images were acquired every 3 s for a period of 3.5 to 5 min using a Carl Zeiss scanning microscope Axiovert 200 m imaging system (100 - 400) using 488-nm (excitation) and 540-nm (emission) filters. The data were expressed as the change in fluorescence relative to baseline (F/F0) as a function of time. Relative mobilizations of Ca2+ levels were estimated from the area under the curve (AUC) of the Ca2+ traces. These values were obtained with ImageJ software (NIH) and further analyzed with Prism software (GraphPad Software).
Quantitative Real-time Polymerase Chain Reaction
Total RNA was extracted using Trizol (Invitrogen) and further purified using the RNeasy kit (Qiagen). Reverse transcription of 2 μg of total RNA was carried out using the AMV First Strand cDNA synthesis kit (Roche) according to the manufacturer's instructions. Quantitative real-time PCR was carried out on an iCycler iQ detection system using the iQ SYBR green Supermix kit (Bio-Rad). Samples were assessed in triplicate and normalized to the expression level of β-actin RNA. Relative mRNA expression was calculated versus a reference sample. The following primers were used: for RTN1, Fw 5′-GCT GCT TAT GGC TGT GGT TTC GAT-3′ and Rev 5′-TGC CAC GAC GGT GTT TAT GTG AGT-3′; for RTN2, Fw 5′-AAC ATC AGG CCC AGA TTG ACC AGT-3′ and Rev 5′-TTG GAT CCG GAG ACT GAT GCT GTT-3′; for RTN3, Fw 5′-AGA GTG GGA TTT CTT CCG TTG GGT-3′ and Rev 5′-TTC TCA GGT GGC ATT CTG GGA GTT-3′; for RTN4, Fw 5′-TAT GAA CGG CAT CAG GCG CAG ATA-3′ and Rev 5′-TTC TGC TTT GCG CTT CAA TCC AGG-3′; for β-actin, Fw 5′-GAT CTG GCA CCA CAC CTT CT-3′ and Rev 5′-GGG GTG TTG AAG GTC TCA AA-3′; for Xbp1, Fw 5′-AAG AAC ACG CTT GGG AAT GG-3′ and Rev 5′-ACT CCC CTT GGC CTC CAC-3′; for spliced Xbp1, Fw 5′-GAG TCC GCA GCA GGT G-3′ and Rev 5′-GTG TCA GAG TCC ATG GGA-3′; for Atf4, Fw 5′-ATG GCC GGC TAT GGA TGA T-3′ and Rev 5′-CGA AGT CAA ACT CTT TCA GAT CCA TT-3′.
Flow Cytometry Analysis
Flow cytometry analysis was carried out to detect apoptosis via annexin-V and PI double labeling using the Vybrant Apoptosis Assay Kit #2 (Molecular Probes) according to the manufacturer's instructions. In brief, cells cultured in 6-well plates were subjected to apoptotic stimuli for the appropriate time. After treatment, floating and adherent cells were harvested, washed with PBS, resuspended in annexin-V binding buffer (10 mm HEPES, 140 mm NaCl, and 2.5 mm CaCl2, pH 7.4), and stained with annexin-V and PI for 15 min at room temperature. Ten thousand events were acquired per sample using a FACSCalibur flow cytometer using CellQuest software (Becton Dickinson), and data were analyzed using FlowJo analysis software (Three Star). Negative and positive controls were used to adjust instrument settings.
Confocal Microscopy
For the detection of endogenous RTN4a/b, cells were grown on glass coverslips, fixed, and permeabilized in 100% methanol at −20 °C for 10 min and blocked with 1% BSA (Sigma). Samples were incubated with the primary antibody overnight at 4 °C, and then incubated with the secondary antibody for 1 h at room temperature. Washes were performed using PBS. Nuclei were stained with DAPI (Sigma). Coverslips with stained cells were washed and mounted onto glass slides in Vectashield medium (Vector Laboratories) for microscopy. Images were acquired as single XY planes using a Leica TCS SP5 confocal laser-scanning microscope with a ×63/1.49 NA oil-immersion objective. The quantification of ER sheets and the detection of exogenous proteins were carried out using live-cell imaging on 35-mm glass bottom dishes (MatTek). For the quantification of ER sheets, cells were stained with ER tracker and more than 50 cells per group were blindly analyzed from two independent experiments. Image analysis was performed with ImageJ software (NIH) and expressed as percentage of cytosol (total cell area minus the nucleus). For the detection of exogenous proteins, following 16 to 24 h transfection, culture media was replaced with HEPES buffer, and cells were imaged at room temperature for no longer than an hour. For the quantification of endogenous STIM1 clusters a threshold was applied to collected images in ImageJ, and only data from pixels above the threshold were quantified. The threshold was set at the minimum pixel intensity + 10% of the range of pixel intensities of the untreated WT image (threshold = min + 10%[max − min]) and was used as the global threshold for the rest of the images. Cells were outlined in thresholded images before conversion to binary images. Cell areas in binary images were analyzed using the analyze particles tool to collect area values for STIM1 signal and displayed as frequency distribution.
FRET Imaging and Analysis
FRET analysis was done using a CFP/YFP pair on a Leica TCS SP5 confocal laser-scanning microscope with a ×63/1.49 NA oil-immersion objective and its FRET Acceptor Bleaching module. Emission bands for the fluorescence channels were as follows: CFP (left: 465 nm; right: 499 nm), YFP (left: 530 nm; right: 628 nm). Co-transfected cells grown on glass-bottom dishes were left untreated or treated with TG in Ca2+-free buffer to induce Orai1 channel assembly. Cells were subsequently fixed with 4% paraformaldehyde for 15 min at room temperature and preserved in 90% glycerol. Controls were always run in parallel with experimental samples. Photobleaching was carried out using a 514 nm laser beam at 80% intensity (90 milliwatt laser power at the specimen) for 6 steps at 200 Hz. The FRET efficiency (FRETeff) was automatically calculated for the user defined regions of interest by the software according to the equation: FRETeff = [Dpost − Dpre]/Dpost. Readings with altered fluorescence profile maps in regions not exposed to bleaching were eliminated from analysis. FRET efficiency was acquired from 10 randomly selected cells per sample from three independent experiments using the same experimental parameters.
TIRF Microscopy and Analysis
TIRFM microscopy was carried out with an Olympus IX-70 microscope equipped with argon (488 nm) and argon/krypton (568 nm) laser lines, a TIRFM condenser (Olympus or custom condenser), a 60 × 1.45 NA TIRF objective (Olympus), an iXon887 EMCCD camera (Andor Technologies), and controlled using Andor iQ software as described (38, 39). All live cell microscopy was done at 37 °C (using a custom incubation chamber) in HEPES-buffered saline solution (pH 7.4). Calibration of the evanescent field penetration depth was done as described above. Images were further analyzed using ImageJ software (NIH). This ensured that cells were in close contact with the substrate, analysis of mCherry-STIM1 clustering was carried out using 20 μm2 regions applied to sections of cells with visible STIM1 clusters following TG challenge. Regions where no STIM1 clusters were visible were not included in the final analysis. Quantification of mCherry-STIM1 puncta formation was automated using the find maxima tool in ImageJ to detect STIM1 puncta as local spots of high fluorescence intensity above a noise tolerance of 10. Accuracy of puncta quantification was verified by independent blind counting.
Triacylglycerol Accumulation, Lipid Extraction, and Thin-layer Chromatography
To build up triacylglycerol in cells, WT and RTN4-KO MEF were incubated overnight in DMEM with 0.5 mm oleic acid (Cayman) complexed to 1% fatty acid free BSA. Cells were then washed with PBS and lysed with hypotonic lysis butter (20 mm Tris pH 7.4, 20 mm NaF, and 50 μm EDTA) followed by Dounce with loose tissue grinder (Wheaton). Equal amounts of total proteins were transferred to glass tubes. Lipids were extracted by adding 4 ml of chloroform/methanol (2:1 v:v) followed by addition of 750 μl of water. The lipid phase (organic phase) was collected and evaporated under N2. Lipid residues were resolved in 50 μl of chloroform and loaded onto silica gel HTLC plate (Whatmann). Separation of neutral lipids were performed by developing the plate in a neutral lipid solvent (heptane/isopropyl ether/acetic acid, 60:40:4, v:v:v) (65). Neutral lipids were visualized by Hanessian's stain.
Visualization of Lipid Droplets (LD)
Subconfluent cells grown on coverslips were loaded overnight with 0.5 mm oleic acid (Cayman) complexed to 1% fatty acid free BSA. Cells were then rinsed with PBS and fixed with 3.7% paraformaldehyde. Cells were stained with BODIPY 493/503 (Invitrogen) for LD and DAPI for nuclei. Coverslips were then mounted by mounting medium (Vectashield) and imaged by confocal microscopy.
Statistical Analysis
Data are expressed as the mean ± S.E. unless otherwise noted. Statistical analysis was performed using Prism software (GraphPad Software). Statistical significance between groups was determined by Student's t test. Significance between multiple groups was determined by one-way ANOVA with Tukey's post hoc analysis. In every case, p < 0.05 was considered statistically significant.
RESULTS
RTN4-KO Cells Display Altered ER Morphology with Loss of ER Tubulation and Enrichment of ER Sheets
To study the structure-function relationship of the ER, we established MEFs (mouse embryonic fibroblasts) from either wild-type (WT) C57Bl6 mice or C57Bl6 congenic mice lacking both Rtn4a and Rtn4b as previously described (36, 37). Disruption of a common exon shared by these isoforms results in complete deletion of both Rtn 4a/b mRNAs (called Rtn4-KO throughout this report). These cells provide the ideal system for the following reasons. First, MEFs abundantly express the ∼45 kDa RTN4b protein (Fig. 1A) with very little RTN4a. This is consistent with non-neural cells such as endothelial, smooth muscle, and macrophages expressing higher levels of RTN4b compared with RTN4a (20, 36). Second, the importance of this isoform is emphasized by the extensive, predominantly tubular, ER network present in these cells (Fig. 1B). Third, the loss of RTN4a/b does not lead to compensatory gene expression by other rtns, assessed by Q-PCR (Fig. 1C), and does not alter the overall cellular ER content, based on the expression of several ER luminal markers (BiP, calreticulin, and GRP94) and the ER integral membrane protein, calnexin (Fig. 1D). Finally, in contrast to previous reports (6, 7), the loss of the RTN4a/b isoforms is sufficient to significantly alter ER morphology without the deletion of additional RTNs or other curvature-inducing proteins (Fig. 1E, right panels). The morphological changes are characterized by a reduction of ER tubulation and enrichment of persistent ER sheets (designated by arrowheads). These changes were visualized by confocal microscopy using ER-resident GFP-Sec61b (Fig. 1E, top panels) or, to circumvent the possibility that overexpression of GFP-Sec61b alters ER structure, ER tracker, a cell-permeant dye highly selective for the ER (Fig. 1E, bottom panels). Quantitative analysis of confocal images of ER tracker revealed a ∼67% increase in ER sheets in RTN4-KO compared with WT MEFs (Fig. 2A).
FIGURE 1.
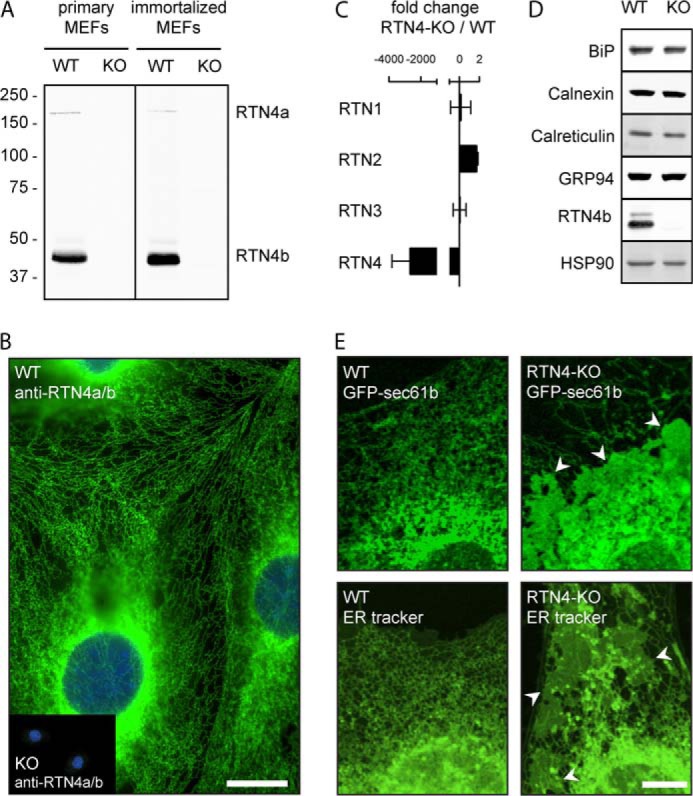
Loss of RTN4a/b alters ER morphology. A, Western blots of primary (left) or immortalized (right) WT and RTN4-KO (referred to here as KO) MEFs probed with anti-RTN4a/b. B, epifluorescence imaging of WT and RTN4-KO (inset, referred to here as KO) MEFs fixed and immunostained for RTN4a/b and stained with DAPI. Scale bar, 20 μm. C, quantitative real-time PCR analysis of reticulon transcripts expression levels in RTN4-KO relative to WT MEFs, n = 3. D, Western blot analysis of ER markers in WT and RTN4-KO (referred to here as KO) MEFs. Cell extracts were probed for both luminal (BiP, calreticulin, and GRP94) and membrane-integral (calnexin) proteins. HSP90 and RTN4b were used for controls. E, WT or RTN4-KO MEFs were transfected with GFP-Sec61b (top panels) or stained with ER-tracker (bottom panels) and visualized by confocal microscopy. Scale bar, 10 μm.
FIGURE 2.
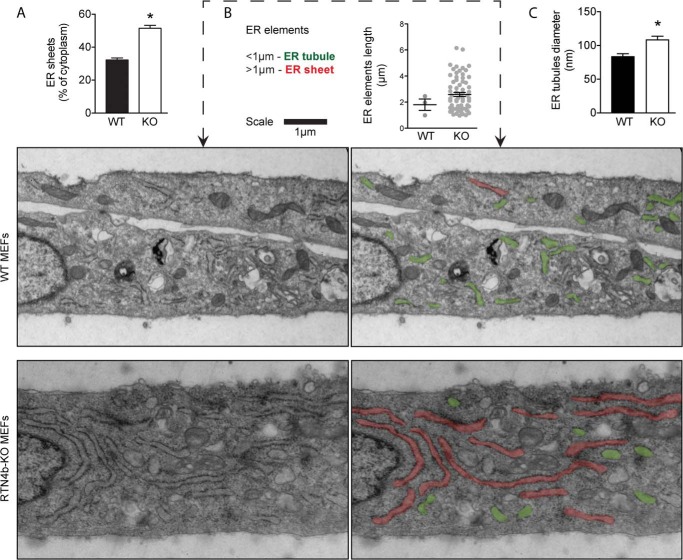
Loss of RTN4a/b alters ER morphology and ER tubules diameter. A, quantification of ER sheets present in WT and RTN4-KO MEFs. ER-tracker was used to delineate ER sheets. ER sheet area was subtracted from cytosol area (cell area − nucleus area) and expressed as % of cytoplasm. Values are mean ± S.E. of data collected from 25–30 cells in each group from three independent experiments. B, thin section EM micrographs of Epon embedded WT (top panels) and RTN4-KO MEFs (bottom panels). ER elements shorter (green) and longer (red) than 1 μm are indicated. Dot graphs represent the length of ER elements (>1 μm) observed in 10 cell sections from WT and RTN4-KO MEFs. Mean ± S.E. is indicated for each group. C, ER tubules diameter in WT and RTN4-KO MEFs. Values are mean ± S.E. of data collected from 10 cell-sections in each group. *, p < 0.05 compared with WT MEFs, Student's t test.
These findings were also corroborated by high-resolution transmission electron microscopy. Ultrastructural analysis of cross-sections of WT cells revealed a cytoplasm rich in short ER elements (ER profiles <1 μm, highlighted in green), reminiscent of ER tubules (Fig. 2B, top panels). On the contrary, RTN4-KO cell cross-sections displayed an abundance of longer ER elements (ER profiles >1 μm; highlighted in red) characteristic of ER sheets (Fig. 2B, bottom panels). The ER elements observed in RTN4-KO cells were also less constricted. The average ER tubule diameter reported in mammalian cells varies from 60 to 100 nm (2). The average diameter of ER elements observed in WT MEFs fell within this range at ∼80 nm, whereas that of RTN4-KO MEFs was unusually high at ∼110 nm (Fig. 2C). Taken together, these results indicate that this simple cell system, where ER morphology can be altered through the manipulation of a single protein, can be used as a novel tool to study the dependence of ER functions on morphology.
The Structural Alteration of the ER in RTN4-KO Cells Does Not Lead to Generalized ER Dysfunction but Reduces SOCE
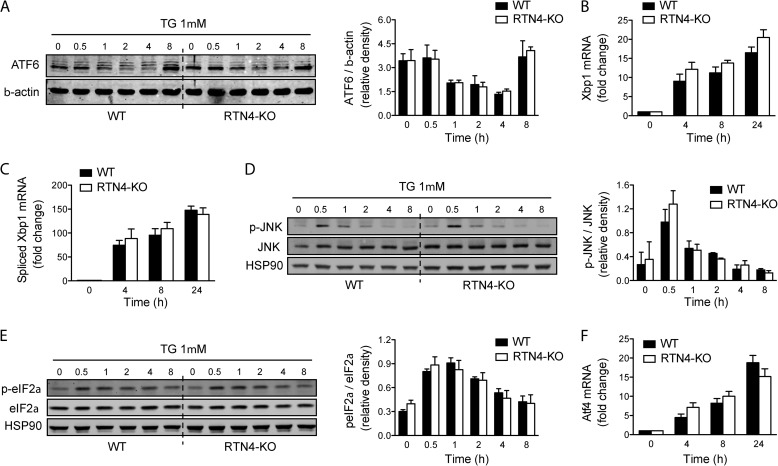
Next, we sought to investigate whether the loss of RTN4a/b and the associated structural changes of the ER would affect general ER functions. Assessment of triglyceride synthesis and lipid droplet formation in WT and RTN4-KO MEFs revealed no significant differences (Fig. 3, A–C). Likewise, no indication of ER stress was detected in RTN4-KO cells, suggesting proper functioning of the protein folding machinery. Upon pharmacological induction of ER stress, ER-to-nucleus signaling through the unfolded protein response (ATF6, IRE1, and PERK pathways; Fig. 4, A–F) was also unaltered in RTN4-KO when compared with WT MEFs. These results imply that although substantial rearrangement of the ER is incurred by the loss of RTN4a/b, it does not result in overt dysfunction of the organelle.
FIGURE 3.
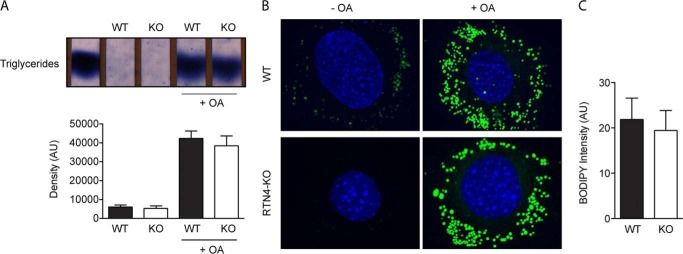
Triglyceride synthesis and LD formation are unaffected in RTN4-KO MEFs. A, thin-layer chromatogram of triglycerides prepared from untreated or oleic acid-treated (24 h) WT and RTN4-KO MEFs. Lane 1 represents triacylglycerol from purified standards. Bar graphs represent the quantitative densitometry mean ± S.E. of three independent experiments. B, confocal analysis of LD in WT (top panels) and RTN4-KO (bottom panels) MEFs untreated or treated with oleic acid. LD were labeled with BODIPY 493/503 and cell nuclei with DAPI. C, quantification of LD in oleate-loaded WT and RTN4-KO MEFs based on BODIPY 493/503 fluorescence intensity in the cytoplasm. Values are mean ± S.E. of data collected from 10 cells in each experimental condition from three independent experiments.
FIGURE 4.
The unfolded protein response is unaltered in RTN4-KO MEFs. A, representative immunoblot of proteolytic cleavage of full-length ATF6 during UPR induction with TG in WT and RTN4-KO MEFs. Bar graphs represent the cumulative quantitative densitometry from three independent experiments. B, Xbp1 and C, spliced Xbp1 mRNA expression in response to TG in WT and RTN4-KO MEFs analyzed by Q-PCR. D, representative immunoblot of JNK1/2 phosphorylation and E, eIF2α phosphorylation during UPR induction with TG in WT and RTN4-KO MEFs. Bar graphs represent the cumulative quantitative densitometry from three independent experiments. F, ATF4 mRNA expression in response to TG in WT and RTN4-KO MEFs analyzed by Q-PCR. Data presented as mean ± S.E.
The loss of RTN4a/b did, however, alter ER-regulated Ca2+ dynamics (Fig. 5). The generation of short and long Ca2+ transients was assessed in physiological levels of extracellular Ca2+ (2 mm), using PDGF (platelet-derived growth factor, 10 ng/ml) and TG (thapsigargin, 1 μm), a selective inhibitor of SERCA (sarco-endoplasmic reticulum Ca2+-ATPases), respectively. PDGF produced rapid Ca2+ transients that mobilized similar amounts of Ca2+ (measured via Fluo-4; Fig. 5A, bar graph), albeit with different kinetic profiles (Fig. 5A, line graph). A sharper decline in cytosolic Ca2+ levels was observed following the initial peak in RTN4-KO compared with WT cells. Differences were further apparent when Ca2+ transients were induced with TG. TG induced sustained Ca2+ transients in both cell types; however, the magnitude of Ca2+ mobilized was significantly reduced in RTN4-KO MEFs (Fig. 5B). Because both internal and external sources of Ca2+ contribute to these transients, to gain further insight into the underlying cause of altered Ca2+ dynamics in RTN4-KO cells, these two components were uncoupled and studied independently.
FIGURE 5.
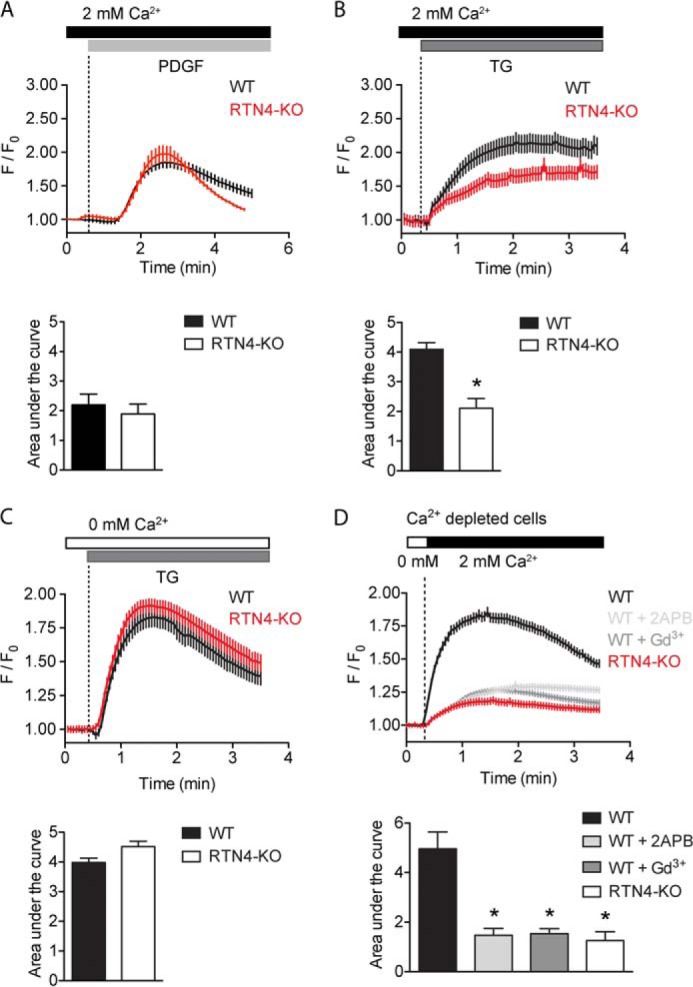
Loss of RTN4a/b reduces SOCE. A and B, increase in cytosolic Ca2+ in response to 10 ng/ml PDGF (A) or 1 μm TG (B) in WT and RTN4-KO MEFs in the presence of extracellular Ca2+. C, increase in cytosolic Ca2+ in response to TG induced depletion of internal stores in the absence of extracellular Ca2+. D, SOCE assessed by re-addition of extracellular Ca2+ to stores-depleted cells. Inhibition of SOCE was carried out in WT MEFs exposed to vehicle or CRAC inhibitors 2APB (50 μm) or gadolinium (10 μm). A–D, calcium traces represent the average response of 25–30 cells per triplicate from a single experiment. F/F0, change in fluorescence intensity relative to baseline. Areas under the curve were calculated after treatment or re-addition of external Ca2+. Data represent the mean ± S.E. of 4–6 independent experiments. *, p < 0.05 compared with WT MEFs, Student's t test.
To assess the amount of ER Ca2+ content, the major internal source of Ca2+, WT and RTN4-KO MEFs were treated with TG in the presence of nominally calcium-free buffer (0 mm extracellular Ca2+). Inhibition of SERCA activity with TG lead to a passive efflux of ER Ca2+ with no significant difference in the amount of Ca2+ mobilized in RTN4-KO compared with WT MEFs, indicating that internal Ca2+ stores are unaffected (Fig. 5C). To assess SOCE, internal stores were initially depleted with TG (in the absence of extracellular Ca2+), and external Ca2+ was added back to measure Ca2+ influx. The addition of extracellular Ca2+ prompted a robust influx in WT MEFs that was substantially reduced in RTN4-KO MEFs (Fig. 5D). Additionally, proposed inhibitors of SOCE, 2-APB (2-aminoethoxydiphenyl borate, 50 μm) and low concentrations of Gd3+ (gadolinium, 10 μm) blunted calcium influx in WT MEFs to levels close to those observed in RTN4-KO MEFs (Fig. 5D). Finally, when PDGF induced Ca2+ transients were examined in the absence of extracellular Ca2+, to preclude the contribution of SOCE to the Ca2+ signal, a significant drop in cytosolic Ca2+ level was observed in WT but not in RTN4-KO MEFs (Fig. 6). Thus, these results indicate that the altered Ca2+ dynamics observed in RTN4-KO MEFs are due to defective SOCE.
FIGURE 6.
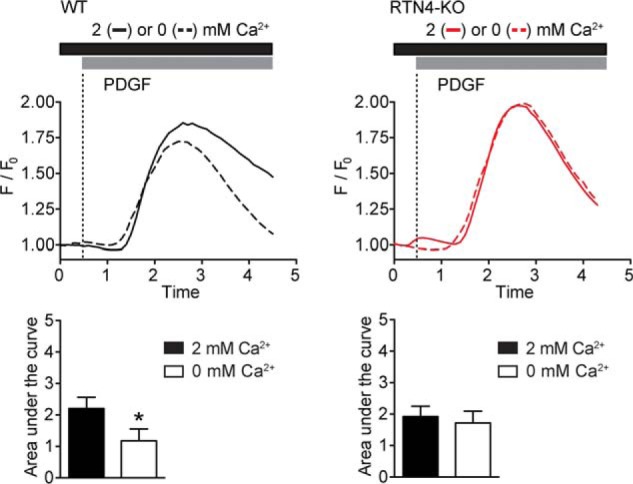
Absence of SOCE from PDGF-induced Ca2+ transient in RTN4-KO MEFs. Increase in cytosolic Ca2+ in response to 10 ng/ml PDGF in WT (left panels) and RTN4-KO (right panels) MEFs in the presence or absence of extracellular Ca2+. Calcium traces represent the average response of 25–30 cells per triplicate from a single experiment. F/F0, change in fluorescence intensity relative to baseline. Areas under the curve were calculated as an estimate of mobilized Ca2+. Data represent the mean ± S.E. of three independent experiments. *, p < 0.05 compared with response in presence of extracellular Ca2+, Student's t test.
Defective SOCE Renders RTN4-KO Cells Resistant to Ca2+ Overload Induced Apoptosis
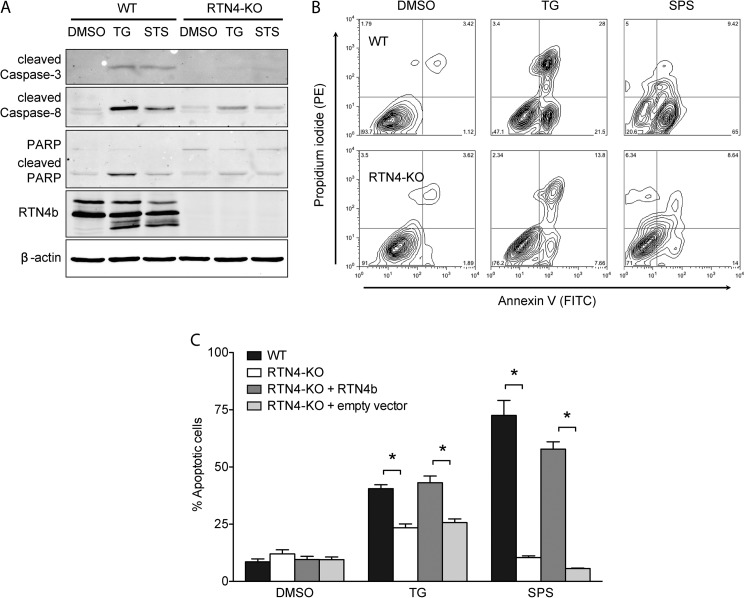
Next, we examined the physiological importance of this alteration in SOCE. Previous studies have shown that cells can utilize SOCE to promote their own demise. Prolonged cellular Ca2+ overload, sustained by SOCE, leads to mitochondrial dysfunction, release of pro-apoptotic factors, activation of caspases and Ca2+-dependent degradation enzymes, and subsequently cell death (reviewed in Rev. 40). Under such conditions, reducing SOCE activity can protect cells from apoptosis (41–45). To examine whether the reduction in SOCE observed in RTN4-KO MEFs hindered their capacity to undergo apoptosis, WT, and RTN4-KO MEFs were treated with TG or staurosporine (STS, 0.1 μm), agents that trigger cell death via sustained elevation of cytosolic Ca2+ levels (46–49). As expected, TG treatment of WT cells for 24 h resulted in robust activation of caspases-3 and -8 and PARP cleavage. These hallmark features of apoptosis were virtually absent in RTN4-KO MEFs (Fig. 7A). Similar results were obtained in response to 10 h exposure to STS (Fig. 7A). These results were further confirmed using FACS analysis of annexin-V/PI co-labeled cells (Fig. 7B). Moreover, lentiviral reintroduction of RTN4b, but not empty vector, restored apoptosis of RTN4-KO MEFs to levels observed in WT cells (Fig. 7C). Overall, these results highlight the importance of RTN4b-regulated ER morphogenesis in SOCE and cellular homeostasis and strengthen the biological relevance of our findings.
FIGURE 7.
RTN4-KO MEFs are resistant to Ca2+ overload triggered apoptosis. A, cells were treated with vehicle, 1 μm TG for 24 h, or 0.1 μm STS for 10 h, and lysates were probed for caspase-3, -8, and cleaved PARP. β-Actin and RTN4b were used as controls. B, representative flow cytometry density plots of WT (top panels) and RTN4-KO (bottom panels) cells assessed for apoptosis by annexin-V and PI staining after treatment with vehicle (left panels) or 1 μm TG for 24 h (middle panels) or 0.1 μm STS for 10 h (right panels). Bottom right quadrants are representative of early apoptotic and top right quadrants of late apoptotic cells. C, quantification of apoptosis (defined as annexin-V-positive cells) from measurements obtained in B for WT, RTN4-KO, and RTN4-KO MEFs reconstituted with empty vector or RTN4b. Data are presented as mean ± S.E. of four independent experiments. *, p < 0.05, two-way ANOVA followed by Tukey's post hoc test.
Defective SOCE in RTN4-KO Cells Results from Altered STIM1 Distribution
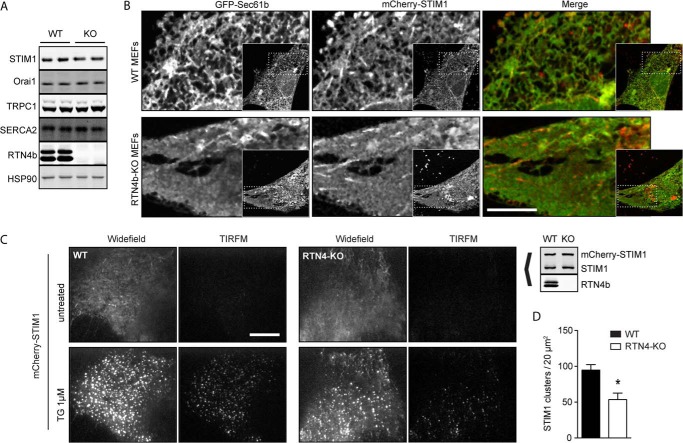
Next, we sought to examine the SOCE defect in RTN4-KO MEFs at the molecular level. In non-excitable cells, SOCE is largely mediated by STIM1 and Orai1. In addition to these essential components, TRPC1 (transient receptor potential channel-1) and SERCA have also been implicated in regulating SOCE (reviewed in Ref. 50). Immunoblotting for these proteins revealed their levels to be unaffected by the loss of RTN4b (Fig. 8A). Furthermore, we detected no changes in the mobility of STIM1 on SDS-PAGE implying that the phosphorylation state, reported to regulate STIM1 function (31, 51), was also unaltered.
FIGURE 8.
Loss of RTN4a/b alters STIM1 distribution and reduces STIM1 clustering. A, Western blot analysis of components of the store-operated calcium influx complex in WT and RTN4-KO (referred to here as KO) MEFs. Cell extracts were immunobloted for STIM1 and Orai1 as well as TRPC1 and SERCA. HSP90 and RTN4b were used for controls. B, live cell confocal images of WT (top panels) and RTN4-KO (bottom panels) MEFs expressing Sec61b-GFP and mCherry-STIM1. Scale bar, 10 μm. C, live cell imaging of mCherry-STIM1-transfected WT and RTN4-KO MEFs by TIRFM. Cells were incubated in Ca2+-free solution, and mCherry-STIM1-positive cells were imaged in widefield and TIRF mode before and after treatment with 1 μm TG. D, quantification of imaged acquired in C in TIRF mode for the number of STIM1 clusters in triplicate 20 μm2 areas per cell. Data are presented as mean ± S.E. of 10 cells. *, p < 0.05 compared with WT MEFs.
To investigate STIM1 localization, mCherry-STIM1 was co-expressed with GFP-Sec61b in WT and RTN4-KO MEFs. Common to previous publications (8, 28, 31, 52, 53), confocal imaging of WT cells revealed an interlaced, tubular distribution of STIM1 (Fig. 8B, top panels). In contrast, because of the ER morphological changes in RTN4-KO cells, STIM1 distributed predominantly to ER sheets (Fig. 8B, bottom panels). These findings have significant implications for SOCE since the recruitment of STIM1 to ER-PM junctions is diffusion-limited and spatially restricted to a 2-μm perimeter (53), and diffusion to a particular target becomes less efficient and slower as dimensionality is increased (7). Therefore, the probability of STIM1 clusters reaching ER-PM junctions is reduced in the ER sheet-enriched network of RTN4-KO MEFs compared with the predominantly tubular ER network of WT MEFs. This was corroborated by TIRFM assessment of STIM1 dynamics. When low levels of mCherry-STIM1 were transfected into WT and RTN4-KO MEFs, and cells were challenged with TG to deplete internal Ca2+ stores (in the absence of extracellular Ca2+), a 2-fold reduction in STIM1 clustering was observed in RTN4-KO compared with WT MEFs (Fig. 8, C and D). Consequently, these results suggest that the diminished SOCE in RTN4-KO cells could in part be due to altered STIM1 diffusion dynamics resulting from ER remodeling and STIM1 mislocalization.
Endogenous STIM1 Function Is Impaired in RTN4-KO Cells
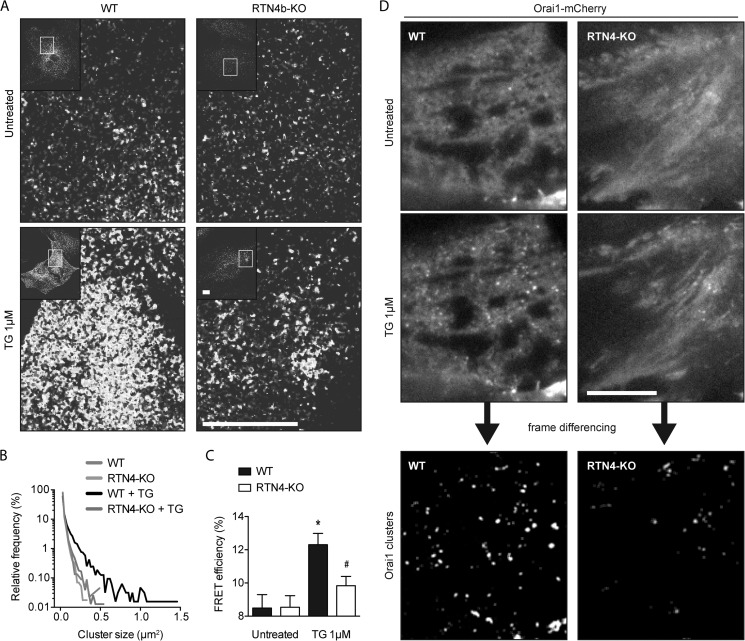
To avoid potential pitfalls or artifacts associated with overexpression of tagged STIM1 molecules, we used a variety of methods to directly or indirectly investigate the function of endogenous STIM1. Direct visualization of endogenous STIM1 remains a challenge, potentially due to low protein levels and the compact nature of STIM1 under resting conditions. On that account, when distribution of endogenous STIM1 was examined by confocal microscopy, contrary to the obvious ER-localized staining observed with STIM1 overexpression, a weak diffuse staining pattern was observed under resting conditions in both WT and RTN4-KO cells (Fig. 9A, top panels). Despite the limited resolution, TG induced clustering of endogenous STIM1 was readily observed in WT MEFs (Fig. 9A, bottom left panel). Reflective of previous results, endogenous STIM1 clustering occurred to a lesser extent in RTN4-KO MEFs (Fig. 9A, bottom right panel). These changes were also mirrored by quantitative analysis of the size of STIM1 clusters (Fig. 9B).
FIGURE 9.
Endogenous STIM1 function is defective in RTN4-KO MEFs. A, confocal images of untreated or 1 μm TG-treated WT and RTN4-KO MEFs fixed and immunostained for endogenous STIM1. Scale bars, 20 μm. B, relative frequency distribution of STIM1 cluster size derived from images acquired in A using ImageJ particle analysis tool. C, Orai1-Orai1 FRET efficiency in fixed WT and RTN4-KO MEFs before and after store depletion. Transfected cells were either left untreated or incubated in Ca2+-free solution with 1 μm TG for 10 min and analyzed for FRET. 10 cells were analyzed in each experimental condition. Data are presented as mean ± S.E. of three independent experiments. *, p < 0.05 compared with untreated WT MEFs, #, p < 0.05 compared with treated WT MEFs; two-way ANOVA followed by Tukey's post hoc test. D, live cell imaging of Orai1-mCherry clustering in WT and RTN4-KO MEFs by TIRFM. Orai1-mCherry-positive cells were imaged in TIRF mode before and after treatment with 1 μm TG in the absence of extracellular Ca2+. Frame differencing was used to highlight the visual appearance of Orai1 clusters induced by TG.
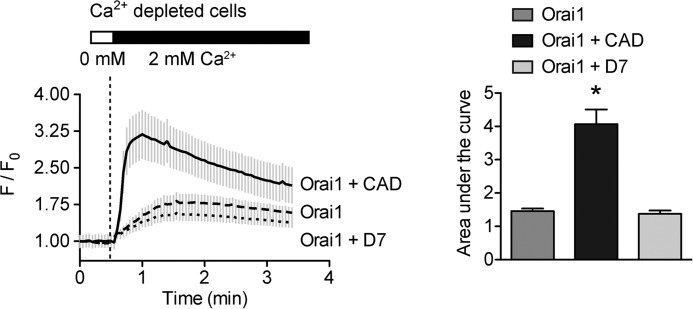
To strengthen these findings, endogenous STIM1 function was also investigated indirectly via FRET and TRIFM using measurements collected with Orai1 overexpression. Although baseline FRET, between overexpressed Orai1-CFP and Orai1-YFP, was expected to be high (∼8% in both WT and RTN4-KO cells) due to the dimeric state of Orai1 under resting conditions (54, 55), a further increase should arise from endogenous STIM1-driven clustering of Orai1 dimers. This occurred in both cell lines albeit to a significantly lesser extent in RTN4-KO compared with WT cells (Fig. 9C). This impairment of endogenous STIM1 function, reflected by reduced Orai1 clustering, was also apparent when visualized by TIRFM. Frame differencing of images collected before and after TG treatment in WT and RTN4-KO MEFs overexpressing low levels of Orai1-mCherry revealed a substantial difference in endogenous STIM1-induced Orai1 clustering (Fig. 9D). Because STIM1 and subsequent Orai1 clustering become apparent only upon reaching ER-PM junctions and coupling to one another, respectively, these results suggest of defective targeted diffusion of endogenous STIM1 following internal Ca2+ stores depletion in RTN4-KO MEFs. Finally, we would anticipate that bypassing this ER-associated defect should rescue defective SOCE. Indeed transfection of a soluble Orai1-activating domain (14) (CAD-mCherry), but not its truncated/inactive form (D7-mCherry), rescued defective TG-induced SOCE in RTN4-KO cells (Fig 10). Collectively, these data imply that RTN4b supports SOCE by promoting correct STIM1 localization and efficient diffusion on ER tubules to ER-PM junctions and coupling to Orai1 upon activation.
FIGURE 10.
Bypassing defective endogenous STIM1 rescues SOCE in RTN4-KO MEFs. RTN4-KO MEFs transiently overexpress Orai1 alone or in combination with the soluble CAD domain of STIM1 or an inactive form of that domain (referred to here as D7) were depleted of their internal Ca2+ stores and SOCE was measured upon re-addition of extracellular Ca2+. Calcium traces represent the average response of 10 transfected cells from a single experiment. F/F0, change in fluorescence intensity relative to baseline. Areas under the curve were calculated after re-addition of external Ca2+. Data are presented as mean ± S.E. of three independent experiments. *, p < 0.05 compared with WT MEFs, Student's t test.
Loss of ER Tubulation Is Responsible for Defective SOCE
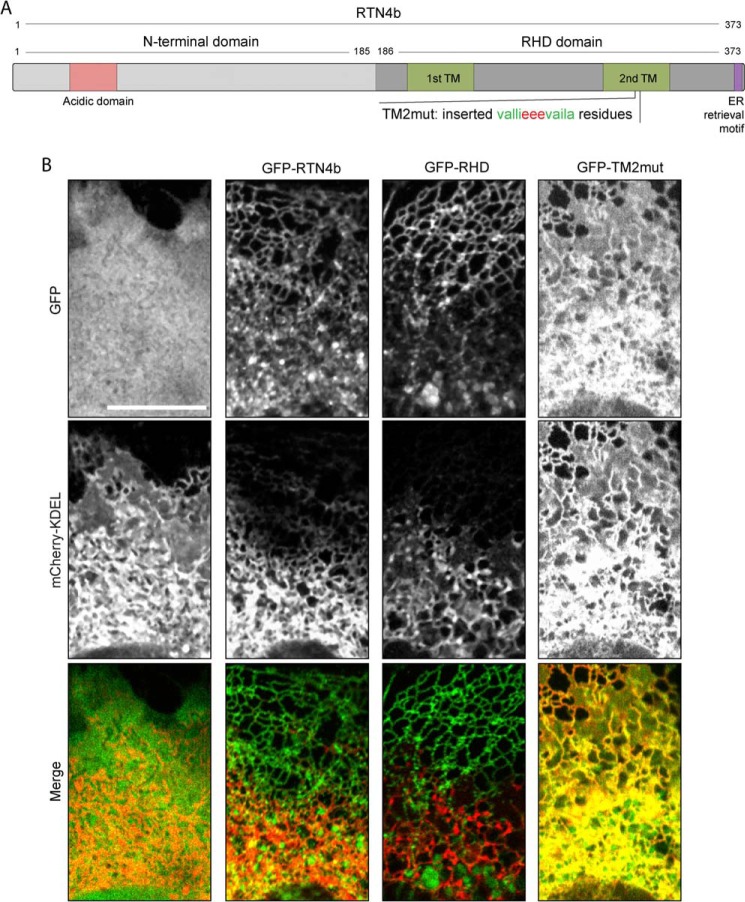
To confirm that loss of ER tubulation is responsible for the diminished SOCE activity in RTN4-KO MEFs, we conducted rescue experiments using co-expression of mCherry-KDEL to highlight ER sheets, in conjunction with either full-length or various mutants of RTN4b tagged with GFP. Full-length RTN4b and the truncation mutant RHD, missing the N-terminal-half of the protein, contain the curvature-inducing RHD. The TM2mut is a modified form of RTN4b retaining proper membrane topology and cellular localization but incapable of inducing membrane curvature (35). This inactivation is achieved through lengthening of the second hairpin of the RHD to penetrate deeper and span both leaflets of the ER membrane. The structures of these various constructs are depicted graphically in Fig 11A. Reconstitution with both full-length GFP-RTN4b and GFP-RHD restored ER tubulation and rescued the ER morphology defects in RTN4-KO cells, whereas GFP did not (Fig 11B). As expected, the expression of GFP-TM2mut in RTN4-KO MEFs failed to restore ER tubulation (Fig 11B, right panels).
FIGURE 11.
Manipulation of ER morphology in RTN4-KO MEFs. A, schematic representation of full length RTN4b, and variants thereof, used in the present work. B, ER morphology of RTN4-KO MEFs transiently overexpressing constructs illustrated in A. RTN4-KO MEFs transiently overexpressing GFP, GFP-RTN4b, GFP-RHD, or GFP-TM2mut, in combination with mCherry-KDEL imaged by confocal microscopy.
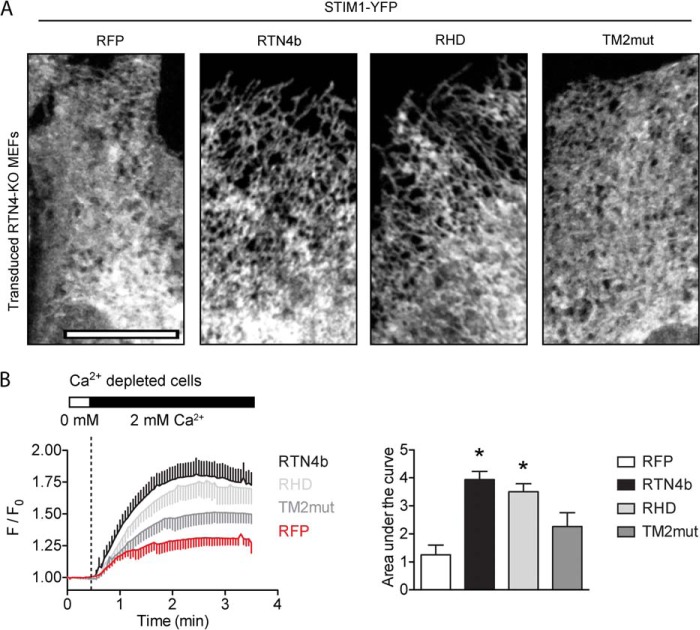
Finally, we examined whether this rescue of ER tubulation also extends to STIM1 distribution and SOCE rescue. For these experiments, lentiviral delivery of RTN4b constructs was used to achieve expressions levels close to physiological and avoid ER stress responses commonly associated with transient overexpression of ER proteins. Endogenous STIM1 distribution was estimated from results obtained with overexpression of low levels of STIM1-YFP. When STIM1-YFP was overexpressed in RTN4-KO MEFs stably expressing untagged RTN4b or RHD (Fig 12A, second and third panels, respectively), a reticulated tubular distribution was observed, similar to that seen in WT MEFs (Fig. 8B, top panels). In contrast, in RTN4-KO MEFs stably expressing RFP or untagged TM2mut (Fig 12A, first and last panels, respectively), the distribution of STIM1-YFP was sheet-enriched and resembled that observed in RTN4-KO MEFs (Fig. 8B, bottom panels). Furthermore, when SOCE was assessed in RTN4-KO MEFs stably expressing full-length RTN4b or RHD (Fig 12B), Ca2+ influx was completely restored to levels observed in WT MEFs (Fig. 5D). This rescue was not observed in cells expressing TM2mut or RFP (Fig 12B). Hence, the loss of ER tubulation is the major factor responsible for the reduction in SOCE in cells lacking RTN4b. Collectively, these data support a critical role for RTNs in Ca2+ homeostasis and demonstrate for the first time that RTN4b, via its ER tubulating actions, is a positive regulator of SOCE.
FIGURE 12.
Restoring ER tubulation rescues defective SOCE in RTN4-KO MEFs. A, STIM1-YFP distribution in RTN4-KO MEFs expressing various RTN4b constructs. Stable cell-lines of RTN4-KO MEFs expressing RFP, RTN4b, RHD, or TM2mut were transiently transfected with STIM1-YFP, and its distribution was visualized using confocal microscopy. B, SOCE in RTN4-KO lentivirally transduced with RFP, RTN4b, RHD, or TM2mut. SOCE assessed by re-addition of extracellular Ca2+ to stores-depleted cells. Calcium traces representing the average response of 25–30 cells from a single experiment. F/F0, change in fluorescence intensity relative to baseline. Areas under the curve were calculated after re-addition of external Ca2+. Data represent the mean ± S.E. of three independent experiments. *, p < 0.05 compared with RTN4-KO MEFs expressing RFP, Student's t test.
DISCUSSION
Although it is presumed that ER structure is critical for SOCE, there is little direct experimental evidence. The present study was carried out to directly assess this hypothesis. Cell lines exhibiting opposing ER morphologies were generated via genetic manipulation of the ER-shaping protein RTN4. The loss of RTN4a/b, and lack of compensation from other RTNs, resulted in remodeling of the ER from a predominantly tubular to a sheet-enriched network. This change in ER structure did not lead to a generalized dysfunction of the ER, as indicated by unaltered triglyceride synthesis, lipid droplet formation and unfolded protein response. The loss of ER tubulation did however suppress SOCE. The associated resistance of RTN4-KO cells to Ca2+ overload-induced cell death emphasized the physiological importance of the diminished SOCE. When investigated at the molecular level, the suppression of SOCE stemmed from STIM1 mislocalization and alteration of its membrane diffusion dynamics due to altered ER structure. We postulate that the transition from a predominantly tubular to a sheet-enriched ER increases the dimensionality for STIM1 diffusion, which in turn significantly reduces the encounter probability of STIM1 molecules and targeting to ER-PM junctions, resulting in diminished STIM1-Orai1 coupling and SOCE. These findings represent the first demonstration of a specific role for RTNs in Ca2+ homeostasis and reveal novel insights into how ER morphology may regulate intracellular signaling.
RTN4-KO Cells Exhibit Altered ER Morphology
Characterization of MEFs showed that primary as well as immortalized cells express abundant levels of RTN4 isoforms. Among these, we detected the RTN4a and b isoforms, with the RTN4b isoform being predominant. In yeast, the two rtn paralogs, rtn1 and rtn2, generate each a single isoform. A triple deletion of both yeast paralogs and an unrelated curvature-inducing protein Yop1 was necessary to observe a loss of ER tubulation and enrichment of ER sheets (25). A different study reported similar changes in ER morphology with the single deletion of rtn1 (27). In mammalian cells, four rtn paralogs can give rise to at least 24 different isoforms. In the human osteosarcoma cell line U2OS, only upon knockdown of isoforms encoded by rtn1, rtn3, and rtn4 together, were the investigators able to observe morphological changes in the ER (56). Given these observations, we were surprised to find altered ER morphology in RTN4-KO cells despite the expression of other RTNs in these cells. Although these cells lack both RTNa and RTN4b, the reintroduction of RTN4b was sufficient to rescue the observed ER and SOCE phenotypes. This suggests that RTN4b is the major isoform that maintains the tubular ER in MEFs. As to why this isoform is preferred over the others, it is unlikely that it is in direct relation to the basal function of curvature induction as this function is redundant among all RTNs, and the ER morphology defect can be rescued by the reintroduction of a truncated mutant expressing only the common RHD domain of RTN4. Therefore, the answer probably lies within the variable N-terminal region, whose function remains elusive and will require further studies to decipher its role in the functionality of these proteins.
The Structure-Function Relationship of the ER
The evolutionary conservation of the characteristic shapes of organelles suggests an intimate connection between structure and function. Based on this assumption, an alteration to the structure of an organelle could be expected to affect certain functions. This was recently substantiated in an elegant study in mitochondria where it was demonstrated that alteration of the structure of mitochondrial cristae, by depletion of the mitochondria-shaping protein OPA1, destabilizes structure-sensitive protein complexes and consequently leads to diminished mitochondrial respiratory function (57). Similar to this study, we genetically ablated RTN4 to directly assess the impact of the associated structural changes on ER functions. The fact that the ER is a multifunctional organelle that is extremely dynamic and adopts various forms depending on cellular demand is indicative of a strong correlation between structure and function. Therefore, disruption of the predominantly tubular ER network of WT MEFs and conversion to a sheet-enriched network as seen in RTN4-KO MEFs could be expected to severely impact ER functions. However, this was not the case since lipid biosynthesis, assessed via triglyceride synthesis and lipid droplet formation, as well as the UPR signaling were unaltered by structural changes sustained by the organelle. This outcome is in line with a previous study (58) that showed that membrane expansion in response to ER stress occurs through generation of ER sheets, requires UPR signaling, and is driven by lipid biosynthesis. Conversion of ER sheets to tubules via RTN overexpression did not affect these functions nor did it alter the ability of the cells to cope with ER stress. Collectively, these results indicate that certain ER functions are extremely permissive with regards to ER morphology.
However, other ER functions are less permissive to structural changes. When the relationship between ER structure and SOCE was examined we found evidence that ER shape determines the assembly of STIM1-Orai1 complexes and hence SOCE efficiency. We arrived at this conclusion using various techniques (TIRFM, FRET, Ca2+ influx) that assessed, either directly or indirectly, the function of STIM1 in WT and RTN4-KO MEFs. We initially observed that the alterations of ER structure associated with the depletion of RTN4b resulted in attenuated SOCE. Using overexpression of low levels of tagged STIM1 and TIRFM, we found a significant reduction of STIM1 cluster formation in RTN4-KO compared with WT MEFs. Because STIM1 levels were comparable in WT and RTN4-KO cells and bypassing the ER using a soluble form of STIM1 rescued SOCE, such an outcome could be reflective of altered STIM1 diffusion dynamics. To form visible puncta, STIM1 molecules must reach ER-PM junctions (53). Under such circumstances, it appears that a lower amount of STIM1 molecules are reaching these sites in RTN4-KO MEFs. These TIRF data are supported by direct detection of endogenous STIM1 using immunofluorescence before and after ER Ca2+ depletion, where fewer STIM1 clusters were detected in RTN4-KO relative to WT MEFs. Endogenous STIM1 dysfunction in RTN4-KO MEFs was also observed using Orai1-Orai-1 FRET and Orai1 cluster formation by TIRFM. These findings suggest that the extent of ER tubulation is an important determinant of the efficiency of STIM1 translocation to ER-PM junctions. The mode of translocation of STIM1 molecules to ER-PM junctions is through passive diffusion on ER membranes and limited to a 2-μm perimeter (53). Additionally, the encounter probability of a molecule diffusing to a target decreases as dimensionality is increased (7). Hence, whereas in WT MEFs STIM1 can efficiently diffuse to ER-PM junctions on the tubular configuration of the ER network and readily couple to Orai1 resulting in robust Ca2+ influx, in RTN4-KO MEFs the diminished STIM1-Orai1 encounter probability, due to the loss of ER tubulation and the enrichment of ER sheets, appears to be the key mechanism responsible for SOCE dysfunction. Therefore, regulation of the extent of ER tubulation via the modulation of RTNs levels appears to be an important part of how cells regulate ER-PM communication and by extension SOCE. These findings may have broad implications for understanding the dynamic nature of the ER and its relationship to cellular physiology. For instance, alterations in ER morphology, observed during cell division, could be a contributing factor, along with STIM1 phosphorylation (31), Orai1 internalization (59) and microtubule rearrangement (29), to SOCE inhibition observed during that stage of the cell cycle.
Our data provide insights into the structure-function correlation in the ER and demonstrate a new level of regulation of ER functions through structural remodeling of ER elements. Here we demonstrated in a simple cell system that the loss of RTN4b results in ER morphological changes that selectively disrupt certain structure-sensitive ER processes such as SOCE and highlight the importance of RTN4b in Ca2+ homeostasis. Additionally, these findings also raise the possibility that the involvement of RTN4b in SOCE may explain in part certain of the phenotypes observed in RTN4-KO mice (36, 60–62), especially since processes such as inflammatory responses and neural growth are heavily dependent upon Ca2+ signaling (reviewed in Refs. 63, 64).
Footnotes
- ER
- endoplasmic reticulum
- SOCE
- store-operated calcium entry
- RTN
- reticulon
- DAPI
- 4,6-diamidino-2-phenylindole
- LD
- lipid droplets
- TG
- thapsigargin.
REFERENCES
- 1. Goyal U., Blackstone C. (2013) Untangling the web: Mechanisms underlying ER network formation. Biochim. Biophys. Acta 1833, 2492–2498 [DOI] [PMC free article] [PubMed] [Google Scholar]
- 2. Park S. H., Blackstone C. (2010) Further assembly required: construction and dynamics of the endoplasmic reticulum network. EMBO Rep. 11, 515–521 [DOI] [PMC free article] [PubMed] [Google Scholar]
- 3. Shibata Y., Shemesh T., Prinz W. A., Palazzo A. F., Kozlov M. M., Rapoport T. A. (2010) Mechanisms determining the morphology of the peripheral ER. Cell 143, 774–788 [DOI] [PMC free article] [PubMed] [Google Scholar]
- 4. Lee C., Chen L. B. (1988) Dynamic behavior of endoplasmic reticulum in living cells. Cell 54, 37–46 [DOI] [PubMed] [Google Scholar]
- 5. West M., Zurek N., Hoenger A., Voeltz G. K. (2011) A 3D analysis of yeast ER structure reveals how ER domains are organized by membrane curvature. J. Cell Biol. 193, 333–346 [DOI] [PMC free article] [PubMed] [Google Scholar]
- 6. Puhka M., Joensuu M., Vihinen H., Belevich I., Jokitalo E. (2012) Progressive sheet-to-tubule transformation is a general mechanism for endoplasmic reticulum partitioning in dividing mammalian cells. Mol. Biol. Cell 23, 2424–2432 [DOI] [PMC free article] [PubMed] [Google Scholar]
- 7. Berg O. G., von Hippel P. H. (1985) Diffusion-controlled macromolecular interactions. Annu. Rev. Biophys. Biophys. Chem. 14, 131–160 [DOI] [PubMed] [Google Scholar]
- 8. Liou J., Kim M. L., Heo W. D., Jones J. T., Myers J. W., Ferrell J. E., Jr., Meyer T. (2005) STIM is a Ca2+ sensor essential for Ca2+-store-depletion-triggered Ca2+ influx. Curr. Biol. 15, 1235–1241 [DOI] [PMC free article] [PubMed] [Google Scholar]
- 9. Roos J., DiGregorio P. J., Yeromin A. V., Ohlsen K., Lioudyno M., Zhang S., Safrina O., Kozak J. A., Wagner S. L., Cahalan M. D., Veliçelebi G., Stauderman K. A. (2005) STIM1, an essential and conserved component of store-operated Ca2+ channel function. J. Cell Biol. 169, 435–445 [DOI] [PMC free article] [PubMed] [Google Scholar]
- 10. Feske S., Gwack Y., Prakriya M., Srikanth S., Puppel S. H., Tanasa B., Hogan P. G., Lewis R. S., Daly M., Rao A. (2006) A mutation in Orai1 causes immune deficiency by abrogating CRAC channel function. Nature 441, 179–185 [DOI] [PubMed] [Google Scholar]
- 11. Vig M., Peinelt C., Beck A., Koomoa D. L., Rabah D., Koblan-Huberson M., Kraft S., Turner H., Fleig A., Penner R., Kinet J. P. (2006) CRACM1 is a plasma membrane protein essential for store-operated Ca2+ entry. Science 312, 1220–1223 [DOI] [PMC free article] [PubMed] [Google Scholar]
- 12. Zhang S. L., Yeromin A. V., Zhang X. H., Yu Y., Safrina O., Penna A., Roos J., Stauderman K. A., Cahalan M. D. (2006) Genome-wide RNAi screen of Ca(2+) influx identifies genes that regulate Ca(2+) release-activated Ca(2+) channel activity. Proc. Natl. Acad. Sci. U. S. A. 103, 9357–9362 [DOI] [PMC free article] [PubMed] [Google Scholar]
- 13. Soboloff J., Rothberg B. S., Madesh M., Gill D. L. (2012) STIM proteins: dynamic calcium signal transducers. Nat. Rev. Mol. Cell Biol. 13, 549–565 [DOI] [PMC free article] [PubMed] [Google Scholar]
- 14. Park C. Y., Hoover P. J., Mullins F. M., Bachhawat P., Covington E. D., Raunser S., Walz T., Garcia K. C., Dolmetsch R. E., Lewis R. S. (2009) STIM1 clusters and activates CRAC channels via direct binding of a cytosolic domain to Orai1. Cell 136, 876–890 [DOI] [PMC free article] [PubMed] [Google Scholar]
- 15. Yuan J. P., Zeng W., Dorwart M. R., Choi Y. J., Worley P. F., Muallem S. (2009) SOAR and the polybasic STIM1 domains gate and regulate Orai channels. Nature Cell Biol. 11, 337–343 [DOI] [PMC free article] [PubMed] [Google Scholar]
- 16. Muik M., Fahrner M., Derler I., Schindl R., Bergsmann J., Frischauf I., Groschner K., Romanin C. (2009) A Cytosolic Homomerization and a Modulatory Domain within STIM1 C Terminus Determine Coupling to ORAI1 Channels. J. Biol. Chem. 284, 8421–8426 [DOI] [PMC free article] [PubMed] [Google Scholar]
- 17. Parekh A. B., Putney J. W., Jr. (2005) Store-operated calcium channels. Physiol. Rev. 85, 757–810 [DOI] [PubMed] [Google Scholar]
- 18. Chen S., Novick P., Ferro-Novick S. (2013) ER structure and function. Curr. Opin. Cell Biol. 25, 428–433 [DOI] [PMC free article] [PubMed] [Google Scholar]
- 19. Oertle T., Klinger M., Stuermer C. A., Schwab M. E. (2003) A reticular rhapsody: phylogenic evolution and nomenclature of the RTN/Nogo gene family. FASEB J. 17, 1238–1247 [DOI] [PubMed] [Google Scholar]
- 20. Acevedo L., Yu J., Erdjument-Bromage H., Miao R. Q., Kim J. E., Fulton D., Tempst P., Strittmatter S. M., Sessa W. C. (2004) A new role for Nogo as a regulator of vascular remodeling. Nature Med. 10, 382–388 [DOI] [PubMed] [Google Scholar]
- 21. Oertle T., van der Haar M. E., Bandtlow C. E., Robeva A., Burfeind P., Buss A., Huber A. B., Simonen M., Schnell L., Brösamle C., Kaupmann K., Vallon R., Schwab M. E. (2003) Nogo-A inhibits neurite outgrowth and cell spreading with three discrete regions. J. Neurosci. 23, 5393–5406 [DOI] [PMC free article] [PubMed] [Google Scholar]
- 22. van de Velde H. J., Roebroek A. J., Senden N. H., Ramaekers F. C., Van de Ven W. J. (1994) NSP-encoded reticulons, neuroendocrine proteins of a novel gene family associated with membranes of the endoplasmic reticulum. J. Cell Sci. 107, 2403–2416 [DOI] [PubMed] [Google Scholar]
- 23. Iwahashi J., Hamada N., Watanabe H. (2007) Two hydrophobic segments of the RTN1 family determine the ER localization and retention. Biochem. Biophys. Res. Commun. 355, 508–512 [DOI] [PubMed] [Google Scholar]
- 24. Voeltz G. K., Prinz W. A., Shibata Y., Rist J. M., Rapoport T. A. (2006) A class of membrane proteins shaping the tubular endoplasmic reticulum. Cell 124, 573–586 [DOI] [PubMed] [Google Scholar]
- 25. Shibata Y., Voss C., Rist J. M., Hu J., Rapoport T. A., Prinz W. A., Voeltz G. K. (2008) The reticulon and DP1/Yop1p proteins form immobile oligomers in the tubular endoplasmic reticulum. J. Biol. Chem. 283, 18892–18904 [DOI] [PMC free article] [PubMed] [Google Scholar]
- 26. Hu J., Shibata Y., Voss C., Shemesh T., Li Z., Coughlin M., Kozlov M. M., Rapoport T. A., Prinz W. A. (2008) Membrane proteins of the endoplasmic reticulum induce high-curvature tubules. Science 319, 1247–1250 [DOI] [PubMed] [Google Scholar]
- 27. De Craene J. O., Coleman J., Estrada de Martin P., Pypaert M., Anderson S., Yates J. R., 3rd, Ferro-Novick S., Novick P. (2006) Rtn1p is involved in structuring the cortical endoplasmic reticulum. Mol. Biol. Cell 17, 3009–3020 [DOI] [PMC free article] [PubMed] [Google Scholar]
- 28. Smyth J. T., DeHaven W. I., Bird G. S., Putney J. W., Jr. (2007) Role of the microtubule cytoskeleton in the function of the store-operated Ca2+ channel activator STIM1. J. Cell Sci. 120, 3762–3771 [DOI] [PMC free article] [PubMed] [Google Scholar]
- 29. Russa A. D., Ishikita N., Masu K., Akutsu H., Saino T., Satoh Y. (2008) Microtubule remodeling mediates the inhibition of store-operated calcium entry (SOCE) during mitosis in COS-7 cells. Arch. Histol. Cytol. 71, 249–263 [DOI] [PubMed] [Google Scholar]
- 30. Terasaki M., Chen L. B., Fujiwara K. (1986) Microtubules and the endoplasmic reticulum are highly interdependent structures. J. Cell Biol. 103, 1557–1568 [DOI] [PMC free article] [PubMed] [Google Scholar]
- 31. Smyth J. T., Petranka J. G., Boyles R. R., DeHaven W. I., Fukushima M., Johnson K. L., Williams J. G., Putney J. W., Jr. (2009) Phosphorylation of STIM1 underlies suppression of store-operated calcium entry during mitosis. Nature Cell Biol. 11, 1465–1472 [DOI] [PMC free article] [PubMed] [Google Scholar]
- 32. Volpi M., Berlin R. D. (1988) Intracellular elevations of free calcium induced by activation of histamine H1 receptors in interphase and mitotic HeLa cells: hormone signal transduction is altered during mitosis. J. Cell Biol. 107, 2533–2539 [DOI] [PMC free article] [PubMed] [Google Scholar]
- 33. Lu L., Ladinsky M. S., Kirchhausen T. (2009) Cisternal organization of the endoplasmic reticulum during mitosis. Mol. Biol. Cell 20, 3471–3480 [DOI] [PMC free article] [PubMed] [Google Scholar]
- 34. McCullough S., Lucocq J. (2005) Endoplasmic reticulum positioning and partitioning in mitotic HeLa cells. J. Anat. 206, 415–425 [DOI] [PMC free article] [PubMed] [Google Scholar]
- 35. Zurek N., Sparks L., Voeltz G. (2011) Reticulon short hairpin transmembrane domains are used to shape ER tubules. Traffic 12, 28–41 [DOI] [PMC free article] [PubMed] [Google Scholar]
- 36. Yu J., Fernández-Hernando C., Suarez Y., Schleicher M., Hao Z., Wright P. L., DiLorenzo A., Kyriakides T. R., Sessa W. C. (2009) Reticulon 4B (Nogo-B) is necessary for macrophage infiltration and tissue repair. Proc. Natl. Acad. Sci. U. S. A. 106, 17511–17516 [DOI] [PMC free article] [PubMed] [Google Scholar]
- 37. Zheng B., Ho C., Li S., Keirstead H., Steward O., Tessier-Lavigne M. (2003) Lack of enhanced spinal regeneration in Nogo-deficient mice. Neuron 38, 213–224 [DOI] [PubMed] [Google Scholar]
- 38. Xu Y., Melia T. J., Toomre D. K. (2011) Using light to see and control membrane traffic. Curr. Opin. Chem. Biol. 15, 822–830 [DOI] [PubMed] [Google Scholar]
- 39. Xu Y., Rubin B. R., Orme C. M., Karpikov A., Yu C., Bogan J. S., Toomre D. K. (2011) Dual-mode of insulin action controls GLUT4 vesicle exocytosis. J. Cell Biol. 193, 643–653 [DOI] [PMC free article] [PubMed] [Google Scholar]
- 40. Verkhratsky A. (2007) Calcium and cell death. Subcell Biochem. 45, 465–480 [DOI] [PubMed] [Google Scholar]
- 41. Flourakis M., Lehen'kyi V., Beck B., Raphaël M., Vandenberghe M., Abeele F. V., Roudbaraki M., Lepage G., Mauroy B., Romanin C., Shuba Y., Skryma R., Prevarskaya N. (2010) Orai1 contributes to the establishment of an apoptosis-resistant phenotype in prostate cancer cells. Cell Death Dis. 1, e75. [DOI] [PMC free article] [PubMed] [Google Scholar]
- 42. Kim K. D., Srikanth S., Yee M. K., Mock D. C., Lawson G. W., Gwack Y. (2011) ORAI1 deficiency impairs activated T cell death and enhances T cell survival. J. Immunol. 187, 3620–3630 [DOI] [PMC free article] [PubMed] [Google Scholar]
- 43. Liu H., Jia X., Luo Z., Guan H., Jiang H., Li X., Yan M. (2012) Inhibition of store-operated Ca(2+) channels prevent ethanol-induced intracellular Ca(2+) increase and cell injury in a human hepatoma cell line. Toxicol. Lett. 208, 254–261 [DOI] [PubMed] [Google Scholar]
- 44. Pigozzi D., Tombal B., Ducret T., Vacher P., Gailly P. (2004) Role of store-dependent influx of Ca2+ and efflux of K+ in apoptosis of CHO cells. Cell Calcium 36, 421–430 [DOI] [PubMed] [Google Scholar]
- 45. Sun S., Li W., Zhang H., Zha L., Xue Y., Wu X., Zou F. (2012) Requirement for store-operated calcium entry in sodium butyrate-induced apoptosis in human colon cancer cells. Biosci. Rep. 32, 83–90 [DOI] [PubMed] [Google Scholar]
- 46. Furuya Y., Lundmo P., Short A. D., Gill D. L., Isaacs J. T. (1994) The role of calcium, pH, and cell proliferation in the programmed (apoptotic) death of androgen-independent prostatic cancer cells induced by thapsigargin. Cancer Res. 54, 6167–6175 [PubMed] [Google Scholar]
- 47. Jiang S., Chow S. C., Nicotera P., Orrenius S. (1994) Intracellular Ca2+ signals activate apoptosis in thymocytes: studies using the Ca(2+)-ATPase inhibitor thapsigargin. Exp. Cell Res. 212, 84–92 [DOI] [PubMed] [Google Scholar]
- 48. Norberg E., Gogvadze V., Ott M., Horn M., Uhlén P., Orrenius S., Zhivotovsky B. (2008) An increase in intracellular Ca2+ is required for the activation of mitochondrial calpain to release AIF during cell death. Cell Death Differ 15, 1857–1864 [DOI] [PubMed] [Google Scholar]
- 49. Seo S. R., Seo J. T. (2009) Calcium overload is essential for the acceleration of staurosporine-induced cell death following neuronal differentiation in PC12 cells. Exp. Mol. Med. 41, 269–276 [DOI] [PMC free article] [PubMed] [Google Scholar]
- 50. Vaca L. (2010) SOCIC: the store-operated calcium influx complex. Cell Calcium 47, 199–209 [DOI] [PubMed] [Google Scholar]
- 51. Pozo-Guisado E., Campbell D. G., Deak M., Alvarez-Barrientos A., Morrice N. A., Alvarez I. S., Alessi D. R., Martín-Romero F. J. (2010) Phosphorylation of STIM1 at ERK1/2 target sites modulates store-operated calcium entry. J. Cell Sci. 123, 3084–3093 [DOI] [PubMed] [Google Scholar]
- 52. Grigoriev I., Gouveia S. M., van der Vaart B., Demmers J., Smyth J. T., Honnappa S., Splinter D., Steinmetz M. O., Putney J. W., Jr., Hoogenraad C. C., Akhmanova A. (2008) STIM1 is a MT-plus-end-tracking protein involved in remodeling of the ER. Curr. Biol. 18, 177–182 [DOI] [PMC free article] [PubMed] [Google Scholar]
- 53. Liou J., Fivaz M., Inoue T., Meyer T. (2007) Live-cell imaging reveals sequential oligomerization and local plasma membrane targeting of stromal interaction molecule 1 after Ca2+ store depletion. Proc. Natl. Acad. Sci. U. S. A. 104, 9301–9306 [DOI] [PMC free article] [PubMed] [Google Scholar]
- 54. Gwack Y., Srikanth S., Feske S., Cruz-Guilloty F., Oh-hora M., Neems D. S., Hogan P. G., Rao A. (2007) Biochemical and functional characterization of Orai proteins. J. Biol. Chem. 282, 16232–16243 [DOI] [PubMed] [Google Scholar]
- 55. Penna A., Demuro A., Yeromin A. V., Zhang S. L., Safrina O., Parker I., Cahalan M. D. (2008) The CRAC channel consists of a tetramer formed by Stim-induced dimerization of Orai dimers. Nature 456, 116–120 [DOI] [PMC free article] [PubMed] [Google Scholar]
- 56. Anderson D. J., Hetzer M. W. (2008) Reshaping of the endoplasmic reticulum limits the rate for nuclear envelope formation. J. Cell Biol. 182, 911–924 [DOI] [PMC free article] [PubMed] [Google Scholar]
- 57. Cogliati S., Frezza C., Soriano M. E., Varanita T., Quintana-Cabrera R., Corrado M., Cipolat S., Costa V., Casarin A., Gomes L. C., Perales-Clemente E., Salviati L., Fernandez-Silva P., Enriquez J. A., Scorrano L. (2013) Mitochondrial cristae shape determines respiratory chain supercomplexes assembly and respiratory efficiency. Cell 155, 160–171 [DOI] [PMC free article] [PubMed] [Google Scholar]
- 58. Schuck S., Prinz W. A., Thorn K. S., Voss C., Walter P. (2009) Membrane expansion alleviates endoplasmic reticulum stress independently of the unfolded protein response. J. Cell Biol. 187, 525–536 [DOI] [PMC free article] [PubMed] [Google Scholar]
- 59. Yu F., Sun L., Machaca K. (2009) Orai1 internalization and STIM1 clustering inhibition modulate SOCE inactivation during meiosis. Proc. Natl. Acad. Sci. U. S. A. 106, 17401–17406 [DOI] [PMC free article] [PubMed] [Google Scholar]
- 60. Simonen M., Pedersen V., Weinmann O., Schnell L., Buss A., Ledermann B., Christ F., Sansig G., van der Putten H., Schwab M. E. (2003) Systemic deletion of the myelin-associated outgrowth inhibitor Nogo-A improves regenerative and plastic responses after spinal cord injury. Neuron 38, 201–211 [DOI] [PubMed] [Google Scholar]
- 61. Di Lorenzo A., Manes T. D., Davalos A., Wright P. L., Sessa W. C. (2011) Endothelial reticulon-4B (Nogo-B) regulates ICAM-1-mediated leukocyte transmigration and acute inflammation. Blood 117, 2284–2295 [DOI] [PMC free article] [PubMed] [Google Scholar]
- 62. Cafferty W. B., Strittmatter S. M. (2006) The Nogo-Nogo receptor pathway limits a spectrum of adult CNS axonal growth. J. Neurosci. 26, 12242–12250 [DOI] [PMC free article] [PubMed] [Google Scholar]
- 63. Tojima T., Hines J. H., Henley J. R., Kamiguchi H. (2011) Second messengers and membrane trafficking direct and organize growth cone steering. Nat. Rev. Neurosci. 12, 191–203 [DOI] [PMC free article] [PubMed] [Google Scholar]
- 64. Parekh A. B. (2010) Store-operated CRAC channels: function in health and disease. Nat Rev. Drug Discov. 9, 399–410 [DOI] [PubMed] [Google Scholar]
- 65. Lehner R., Vance D. E. (1999) Cloning and expression of a cDNA encoding hepatic microsomal lipase that mobilizes stored triacylglycerol. Biochem. J. 343, 1–10 [PMC free article] [PubMed] [Google Scholar]


