Abstract
Background
RE1-silencing transcription factor (REST), a neuronal repressor gene, regulates neuronal stem cell differentiation. Ewing sarcoma may originate from neural crest cells. We investigated whether REST plays a role in the growth of this tumor.
Methods
REST expression was determined by Western blot and Reverse transcription-PCR in 3 human Ewing sarcoma cell lines and 7 patient tumor samples. The role of REST in tumor growth and tumor vascular morphology was determined using a Ewing sarcoma xenograft model. Immunofluorescent staining, Hypoxyprobe and TUNEL assays were performed to investigate the impact of REST on pericyte marker expression, hypoxia, and apoptosis in vivo.
Results
High levels of REST were expressed in all 3 human Ewing sarcoma cell lines and in 6 of the 7 patient tumor samples. Over-expression of EWS-FLI-1 in human mesenchymal stem cells and human neural progenitor cells increased REST expression. Inhibition of EWS-FLI-1 using small interfering (si) RNA decreased REST expression in human Ewing sarcoma cells. Inhibition of REST did not affect EWS-FLI-1, but significantly suppressed tumor growth in vivo, reduced the tumor vessel pericyte markers α-SMA and desmin, increased hypoxia and apoptosis in tumor tissues and decreased the expression of DLL4 and Hes1.
Conclusions
Inhibition of REST suppressed tumor growth, inhibited pericyte marker expression, and increased tumor hypoxia and apoptosis. As tumor vessel function has been linked to tumor growth and metastases, REST may be a new therapeutic target for Ewing sarcoma.
Keywords: EWS-FLI-1, REST, Ewing sarcoma, tumor growth, tumor vasculature
Introduction
Ewing sarcoma is the second most common malignant bone tumor in children and young adults, with the lung being the most common site of metastasis. The survival rates for patients with metastatic disease have not improved in over 20 years 1–3. Understanding the biology of this tumor is critical to identify of new therapeutic targets. The origin of Ewing sarcoma is still controversial. However, a number of data supports it is origin of neural crest 4–6. Therefore, genes that control neuronal stem cell differentiation may play a role in tumorigenesis of Ewing sarcoma.
RE1-silencing transcription factor (REST) is a neuronal repressor gene that regulates neuronal stem cell differentiation 7, 8. Recent studies have demonstrated that REST also has a multi-functional role in the regulation of non-neurogenic cells 9, 10. In tumor growth, REST has a dual function depending on the cellular context. Previous studies have indicated that REST is an oncogene for medulloblastoma, a pediatric brain tumor 11. REST expression is elevated in samples from patients with medulloblastoma and in tumor cell lines 12. Abnormal expression of REST and Myc in neural progenitor cells has been shown to induce cerebellar tumors by blocking neuronal differentiation 13. However, the role of REST in Ewing sarcoma, which may originate from neural crest and share neural marker features 14, has not been elucidated .
In this study, we demonstrated that EWS-FLI-1, the hallmark fusion protein of Ewing sarcoma, regulates REST expression. Ewing sarcoma patient samples and cell lines expressed high levels of REST. Inhibition of EWS-FLI-1 resulted in decreased REST expression. The inhibition of REST did not affect EWS-FLI-1 levels, but did result in suppressed tumor growth, decreased tumor vessel pericyte marker expression, and increased tumor hypoxia and apoptosis. Our previous studies indicated that the Notch pathway, specifically DLL4 and Hes1, is critical in the regulation of vessel pericyte formation15. Here we further showed that inhibition of REST reduced DLL4 and Hes1 expression. These results suggested that REST is a potential new therapeutic target for treatment of Ewing sarcoma.
Materials and Methods
Cell lines
TC71 and A4573 human Ewing sarcoma cell lines were authenticated by short terminal repeat fingerprinting in the core facility. SK-ES human Ewing sarcoma cells, human mesenchymal stem cells (hMSC), human normal osteoblasts, Daoy human medulloblastoma cells, and SAOS-2 human osteosarcoma cells were purchased from the American Type Culture Collection (Manassas, VA). Human neural progenitor cells(HNP) were purchased from Lonza Walkerville, Inc. (Walkerville, MD). The cells were maintained in the medium according to the company’s instructions. All of the cells were mycoplasma free as determined with the MycoAlert Mycoplasma Detection Kit.
Patient samples and Reverse Transcription-PCR
Seven tumor specimens from Ewing sarcoma patients were obtained from The University of Texas MD Anderson Cancer Center (Houston, TX) and Memorial Sloan-Kettering Cancer Center (New York, NY) with the approval of the institutional review boards. RNA was extracted from human tissue samples using the RNeasy Lipid Tissue Mini Kit (Qiagen, Valencia, CA) 16. cDNA was synthesized using the Reverse Transcription System (Promega, Madison, WI). The products were amplified by polymerase chain reaction (PCR) using specific primers for REST (sense, 5′-GGATGTGGCTGGAAAGAAAA-3′; antisense, 5-GCTGTCAACTTCCAGCTTCC-3′) and EWS-FLI-1 (sense, 5′-GCCTCCTATGCAGCTCAGTC-3′; antisense, 5-GGTTGTAACCCCCTGTGCTA-3′). The 18S primers (Ambion, Austin, TX) were used as internal controls.
Plasmids and the siREST stable transfected cell line
Plasmid pG5-EWS-FLI-1 was constructed by subcloning EWS-FLI-1 cDNA into the pG5- FL2 backbone plasmid at the EcoRI and HindIII sites, and the fragment was verified by sequencing. hMSC or HNP cells were transfected with pG5-EWS-FLI-1 or a control plasmid ; the protein or RNA was extracted from the cells 48h after transfection. The pSilencer 2.1-U6 hygro small interfering RNA (siRNA) expression vector was purchased from Ambion. siRNA expression vectors targeting human REST (siREST) or EWS-FLI-1 (siEWS-FLI-1) were constructed according to the manufacturer’s instructions. All inserts were verified by DNA sequencing. TC71 cells were transfected with siREST or scrambled siRNA as siControl , various clones were selected in hygromycin B, and several stable transfected clones were tested for REST expression by Western blotting. Stable transfected cells were cultured in medium with 400 μg of hygromycin B per ml.
Western blotting
Cells were cultured in 100-mm dishes. Cell lysate was collected in 48h after transfection The protein (100 μg) was loaded onto an 10% SDS-polyacrylamide gel. Specific protein bands were detected with anti-human REST (Millipore, Temecula, CA) and β-actin (Sigma-Aldrich, St. Louis, MO) antibodies. Densitometric analysis was performed, and the values were normalized with β-actin loading control.
Animal experiments
4 to 5-week-old athymic (T-cell deficient) nude mice were purchased from the National Cancer Institute. The mice were maintained in a specific pathogen-free animal facility approved by the American Association for Accreditation of Laboratory Animal Care. The animal experiment protocol was approved by the Institutional Animal Care and Use Committee of MD Anderson Cancer Center. TC71–siControl and TC71–siREST Ewing sarcoma cells in mid-log-growth phase were harvested by trypsinization. Cell suspensions (2 × 10⁶ cells in 0.1 ml of Hanks solution) were injected subcutaneously into the nude mice. Tumors were measured twice a week with a caliper, and diameters were recorded. Tumor volume was calculated by the formula a2b/2, where a and b are the two largest diameters. The tumor tissue was collected for immunohistochemical analysis and terminal deoxynucleotidyl transferase-mediated dUTP nick end labeling (TUNEL) assay.
Immunofluorescence staining
Frozen tumor sections were fixed with acetone and chloroform. The sections were incubated with rat anti-mouse CD31 antibody (BD Biosciences, San Diego, CA), desmin or α-smooth muscle actin (α-SMA) antibody (Abcam, Inc., Cambridge, MA), or DLL4 or vascular endothelial growth factor (VEGF) antibody (Santa Cruz Biotechnology, Santa Cruz, CA). Anti-cyanine 5 (anti-Cy5) was used as the secondary antibody. For double fluorescence staining, the sections were first incubated with CD31 and Cy5 and then with α-SMA and Cy3 antibodies. All sections were analyzed by confocal microscopy(Carl Zeiss MicroImaging, Inc.). Relative expression was quantified in at least five different microscopy fields from different samples using Simple PCI software (Hamamatsu, Sewickley, PA), and average expression was calculated.
Hypoxyprobe-1 assay
The Hypoxyprobe-1 (pimonidazole HCl) kit was purchased from HPI, Inc. (Burlington, MA). Hypoxyprobe was reconstituted in PBS buffer at a final concentration of 7 mg/ml. Mice were injected with 200 μl of Hypoxyprobe solution and sacrificed two and a half hours later. Tumor tissues were collected for immunofluorescent staining using anti-pimonidazole monoclonal antibody.
TUNEL assay
Apoptotic cells were quantified by the TUNEL assay. TUNEL staining in frozen tumor tissues was done according to the manufacturer’s instructions. The green fluorescence of apoptotic cells was detected using a fluorescence microscope. The average number of apoptotic cells in control and TC71–siREST tumors was calculated by counting the number of TUNEL-positive cells in five random microscopic fields from different samples.
Statistical analysis
A two-tailed Student's t test was used to statistically evaluate all experimental results. P < 0.05 was considered statistically significant.
Results
Expression of REST in Ewing sarcoma cell lines and patient samples
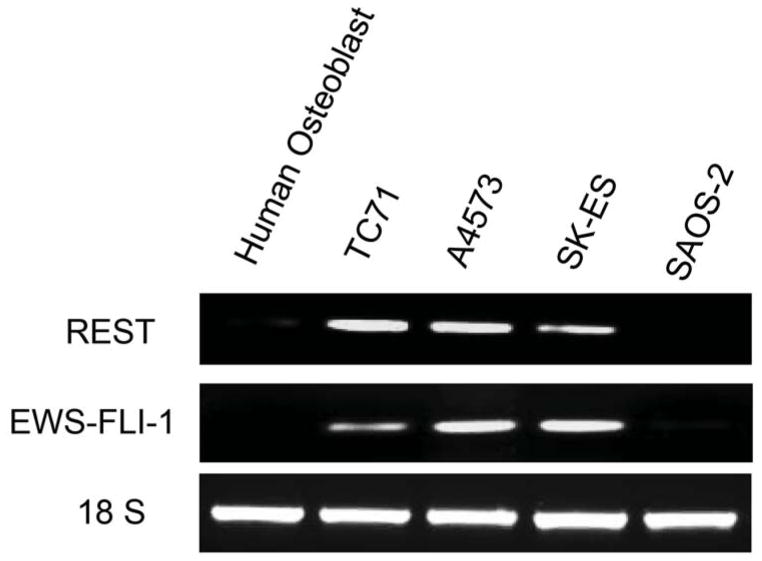
Three different human Ewing sarcoma cell lines were analyzed for REST expression in both RNA and protein levels (Fig.1 A and B). TC71, A4573, and SK-ES human Ewing sarcoma cells expressed both REST and EWS-FLI-1 RNA(Fig. 1A). By contrast, normal human osteoblasts and human osteosarcoma cells (SAOS-2) did not express either REST or EWS-FLI-1 (Fig. 1A). Western blot analysis (Fig. 1B) confirmed that TC71, A4573, and SK-ES expressed high levels of REST protein. Daoy human medulloblastoma cells, which overexpress REST, served as the positive control. SAOS-LM7 osteosarcoma cells, which were derived from SAOS-2, did not expressed REST. To investigate whether REST was also expressed in Ewing sarcoma patient tumors, total RNA was extracted from seven different patient tumor samples and analyzed by RT-PCR. Six of the seven patient samples expressed REST (Fig. 1C). These data demonstrated that REST is expressed both in human Ewing sarcoma cell lines and in patient tumor samples but not in normal bone cells or SAOS osteosarcoma cells.
Figure 1. Expression of REST in human Ewing sarcoma cell lines and patient tumor samples.


A. REST and EWS-FLI-1 expression levels were determined by RT-PCR in TC71, A4573, and SK-ES cells; normal human osteoblasts and SAOS-2 human osteosarcoma cells. The 18S primer was used as the internal control.
B. REST protein expression in TC71, A4573, SK-ES Ewing sarcoma cells and SAOS-LM7 osteosarcoma cells was examined by Western blot. Daoy human medulloblastoma cells served as the positive control. β-Actin was used as the internal control.
C. REST expression was detected by RT-PCR in seven Ewing sarcoma patient tumor samples. The18S primer was used as the internal control.
EWS-FLI-1 regulates REST expression
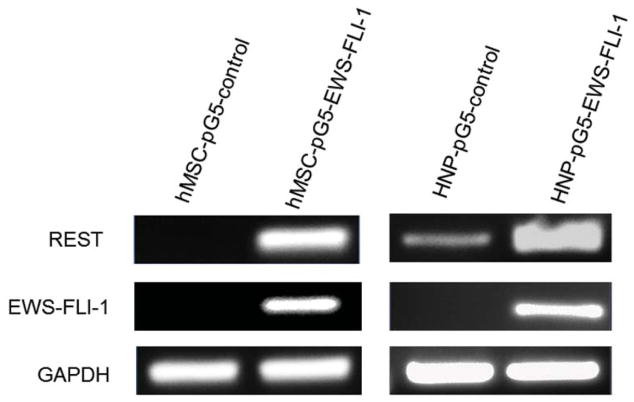
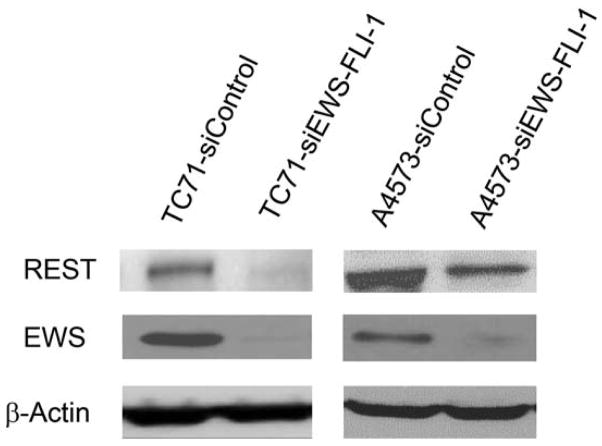
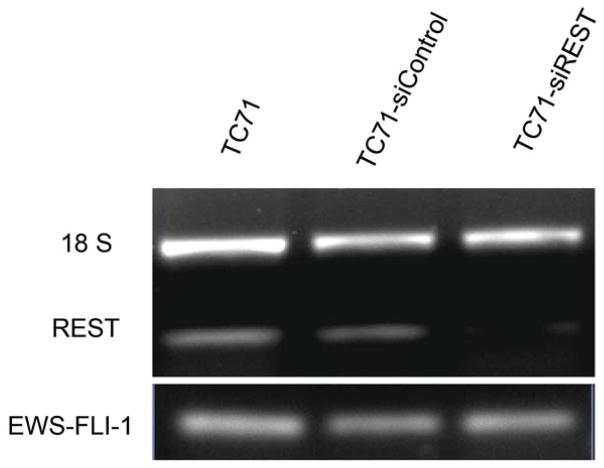
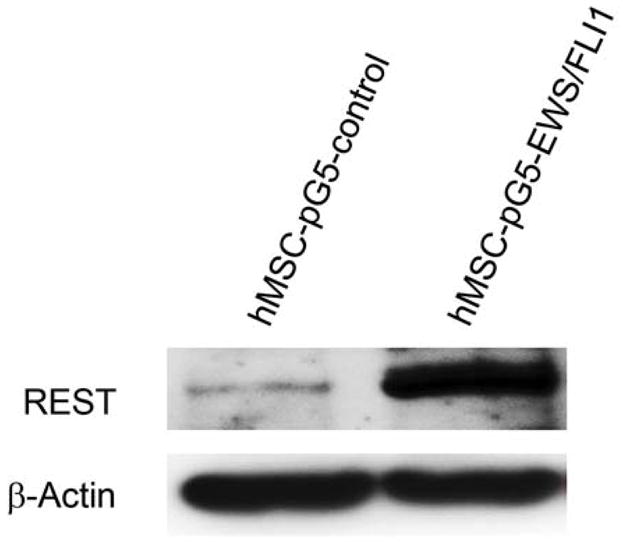
The expression of the EWS-FLI-1 fusion protein is the hallmark of Ewing sarcoma. To confirm the link between EWS-FLI-1 expression and REST expression (Fig. 1A), hMSC or human neural progenitor cells (HNP) were transfected with pG5-EWS-FLI-1 or a control vector. As shown in Fig. 2A, both EWS-FLI-1 and REST expression levels were elevated in the cells after transfection with pG5-EWS-FLI-1 but not after transfection with the control vector. REST protein levels were also increased in EWS-FLI-1-transfected hMSC cells (Fig. 2B). To determine whether inhibition of EWS-FLI-1 inhibits REST expression, we transfected two different human Ewing sarcoma cell lines TC71 cells and A4573 with the siEWS-FLI-1 vector or siControl vectors. EWS-FLI-1 expression was down-regulated in both TC71 and A4573–si-EWS-FLI-1 cell lines. REST expression was also decreased in these cells compared with that in control transfected cells (Fig. 2 C). Different transfection efficiency of siEWS-FLI-1 induced different down-regulation levels of REST between two cell lines. By contrast, transfection of TC71 cells with siREST did not affect EWS-FLI-1 expression (Fig. 2D). These results indicate that EWS-FLI-1 regulates REST expression and that REST may be one of the downstream genes targeted by EWS-FLI-1.
Figure 2. EWS-FLI-1 regulated REST expression in hMSC, HNP and TC71 cells.
A. hMSC (left panel) and HNP( right panel) cells were transfected with pG5-EWS-FLI-1 or a control plasmid. REST and EWS-FLI-1 expression levels were determined by RT-PCR. GAPDH was used as the internal control.
B. hMSC were transfected with pG5-EWS-FLI-1 or a control plasmid. REST protein expression was detected by Western blot. β-Actin was used as the internal control.
C. TC71 and A4573 human Ewing sarcoma cells were transfected with siEWS-FLI-1 or siControl vector. EWS and REST protein levels were determined by Western blot. β-Actin was used as the internal control.
D. TC71 cells were transfected with siREST or the siControl vector. EWS-FLI-1 and REST levels were determined by RT-PCR. The 18S primer was used as the internal control.
Inhibition of REST reduced TC71 tumor growth in vivo
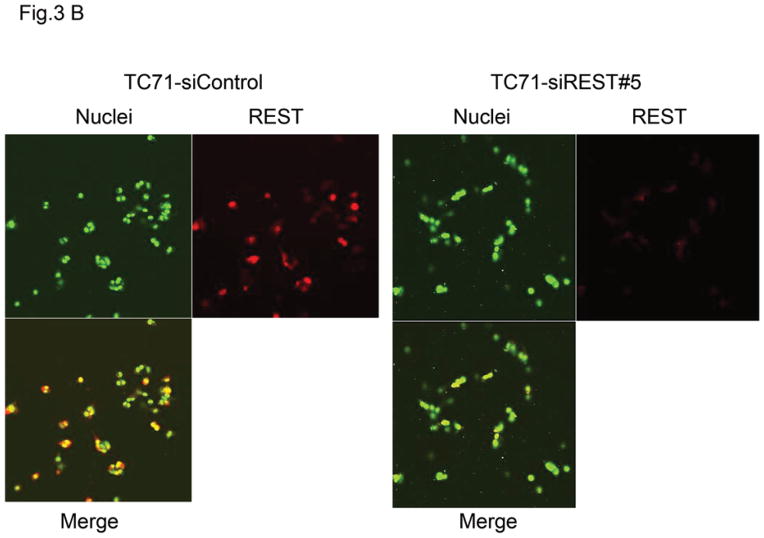
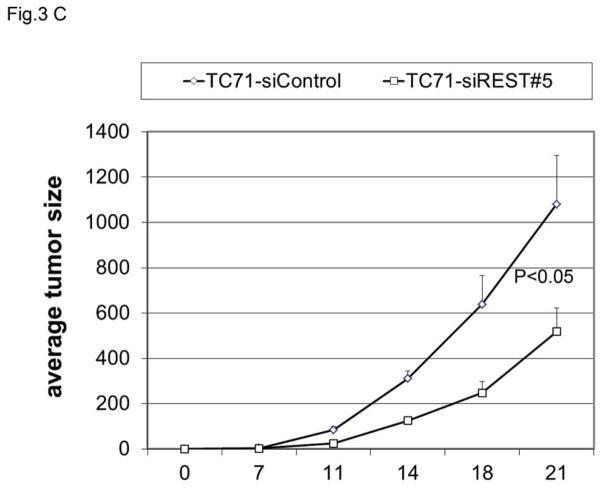
To determine whether REST expression contributes to tumor growth, TC71 cells were transfected with siREST, and selected clones were analyzed using Western blotting. REST expression levels in TC71–siREST clone #5 and clone #8 cells were reduced by 70% and 60%, respectively (Fig. 3A). We used clone #5 in our in vivo experiments. Immunofluorescent staining confirmed that REST expression was inhibited in TC71–siREST clone #5 cells compared with that in TC71–siControl cells (Fig. 3B). TC71-siREST clone #5 cells were then injected into nude mice. Tumor growth and average tumor size in animals injected with clone #5 cells were significantly decreased compared to those in animals injected with control-transfected cells (Fig. 3C). These results suggest that inhibition of REST suppressed tumor growth.
Figure 3. Effect of REST inhibition on tumor growth in vivo.
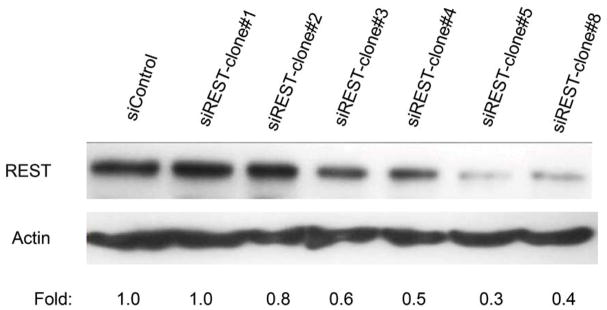
A. TC71 cells were transfected with siREST or the siControl vector. Transfected cell clones were screened for REST protein levels by Western blot. Relative REST protein expression levels were determined by densitometry and adjusted by β-actin.
B. REST expression (red) was examined by immunofluorescent staining in TC71–siREST clone #5 and TC71–siControl cells. Cell nuclei were stained by Sytox Green.
C. TC71–siREST#5 cells or siControl cells were subcutaneously injected into nude mice (n=10). Tumor size was measured twice a week, and average tumor size was calculated (bar: standard error). The difference in tumor size between the two cell types was statistically significant (P<0.05).
Inhibition of REST decreased pericyte marker expression in tumor tissue
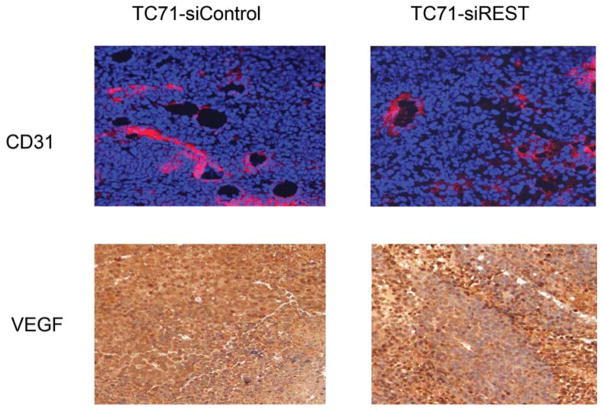
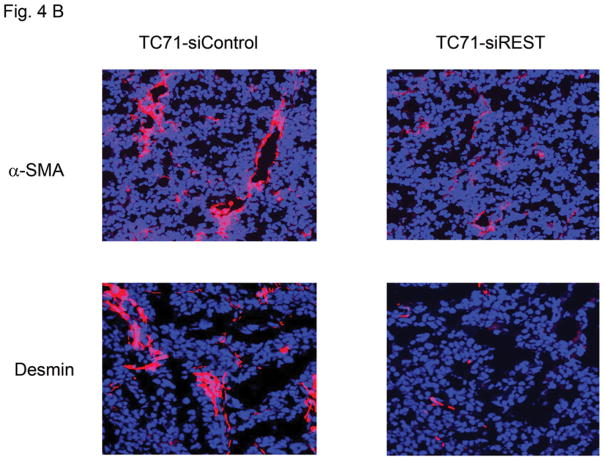
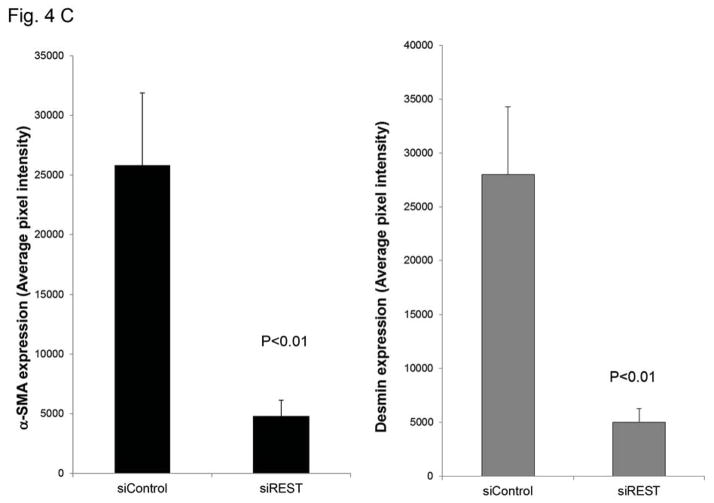
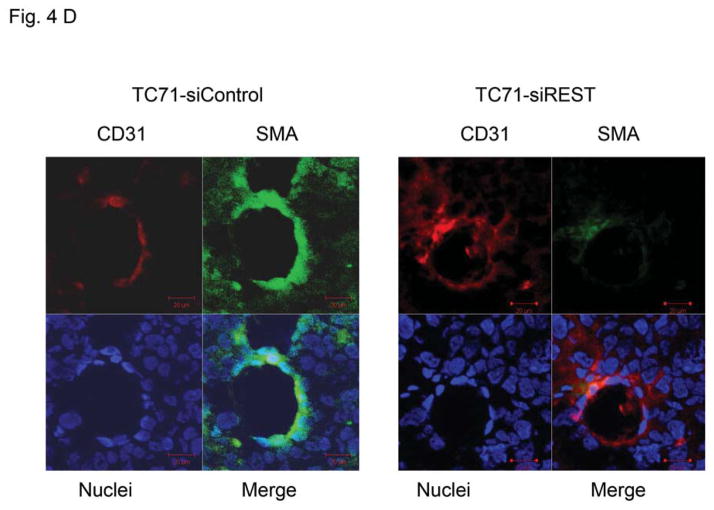
Tumor growth requires oxygen, which is delivered to tumor cells by tumor vessels. Blood vessels consist of both endothelial cells and pericytes. We therefore investigated the role of REST in the formation of tumor vessel endothelial cells and pericytes. The expression of endothelial marker CD31 was not changed in TC71–siREST clone #5 tumor tissues (Fig. 4A). VEGF expression in TC71–siREST tumors was also not different from that in control tumors (Fig. 4A). However, the expression levels of pericyte markers α-SMA and desmin were both lower in TC71–siREST tumors than their expression levels in control tumors (Fig. 4B). Quantitative data confirmed that inhibition of REST significantly reduced expression of both α-SMA and desmin in tumor tissues (Fig. 4C). Co-localization staining showed that expression of α-SMA, but not CD31, was reduced in TC71–siREST tumors (Fig. 4D). These results indicate that inhibition of REST decreased pericyte coverage of tumor vessels but not the number of tumor vessels. The lack of pericyte support may affect the functioning of the tumor vessels and, in turn, tumor growth.
Figure 4. Inhibition of REST reduced vessel pericyte marker Desmin and α-SMA expression but not the expression of CD31 or VEGF in tumor tissues.
A. CD31 and VEGF were detected by immunofluorescent and immunohistochemical staining in TC71–siREST and siControl tumors, respectively.
B. Tumors were analyzed for the pericyte markers α-SMA and desmin (red) by immunofluorescent staining.
C. α-SMA and desmin expression levels were quantified by Simple PCI software in at least five random microscope fields from different samples, and group averages were calculated. The differences in expression levels between the two groups were statistically significant (P< 0.01).
D. Double immunofluorescent staining for CD31 (red) and α-SMA (green) was performed in TC71–siREST clone#5 and TC71–siControl tumor samples. α-SMA, but not CD31, expression was lower in TC71–siREST clone#5 tumor tissues than that in TC71–siControl tumor tissues.
Blockade of REST induced tumor hypoxia and apoptosis
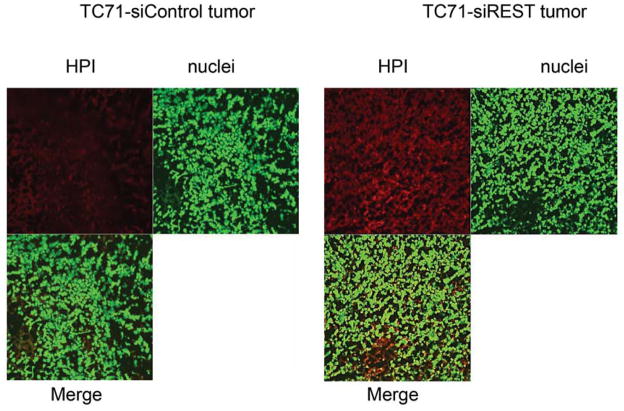
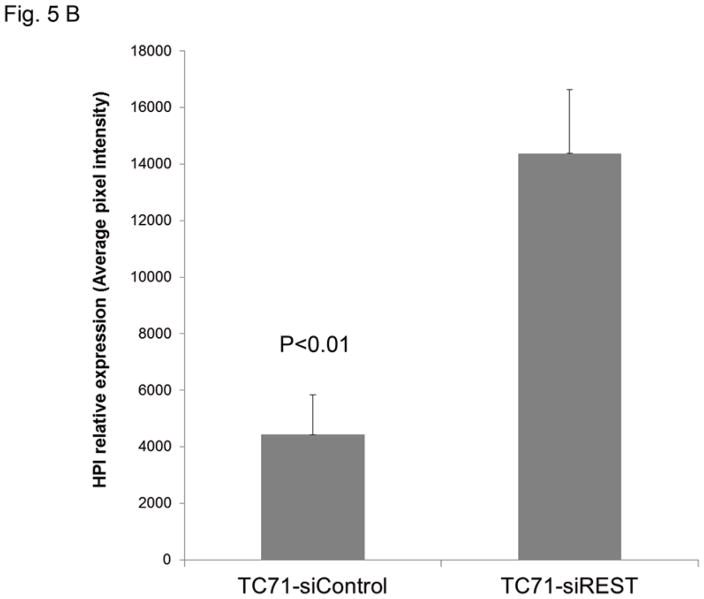
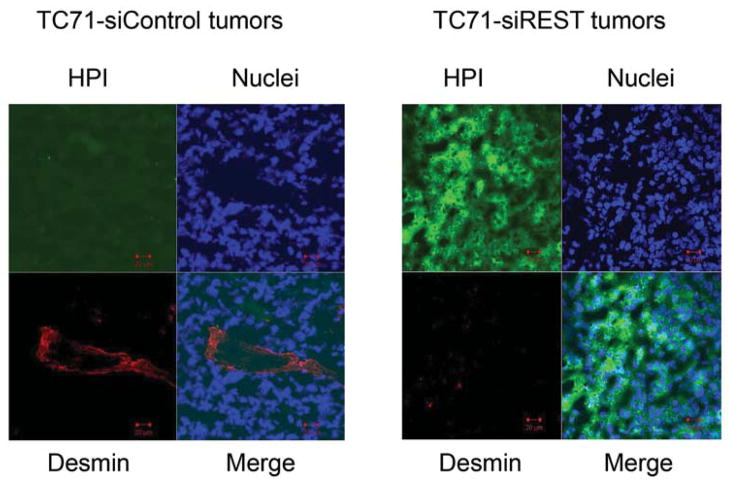
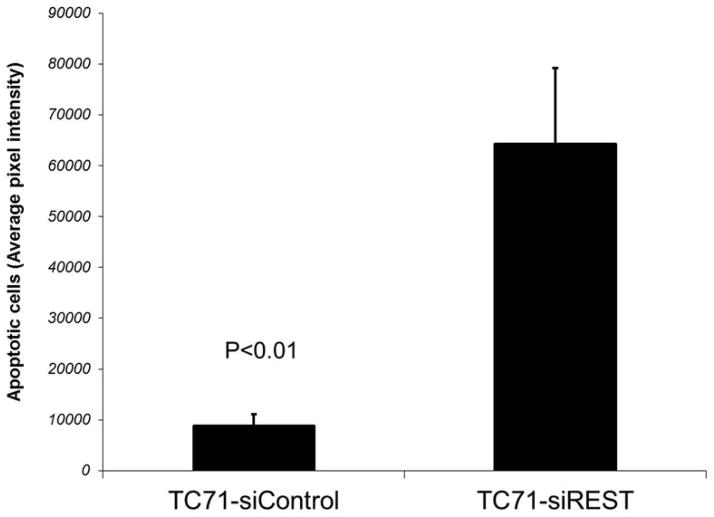
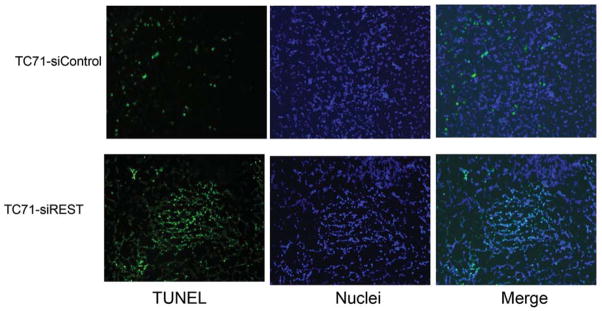
To determine whether decreased pericyte coverage correlates with increased tumor hypoxia, the tumor sections were analyzed by immunofluorescent staining using hypoxia probe HPI. Increased HPI expression was observed in TC71–siREST tumor samples (Fig. 5A). Furthermore, quantitative data confirmed that inhibition of REST correlated with increased hypoxia in the tumor tissues (Fig. 5B; P<0.01). To investigate the correlation between pericyte marker expression and hypoxia, double staining of desmin and HPI was performed. Decreased desmin expression and increased hypoxia (Fig. 5C), as well as increased apoptosis measured by TUNEL assay (Fig. 5D, E), were seen in TC71–siREST tumor samples compared to control tumor samples. These results suggest that inhibition of REST may decrease tumor growth by altering tumor vessel morphology, which leads to increased tumor hypoxia and apoptosis.
Figure 5. Suppression of REST increased hypoxia and apoptosis in TC71 tumor tissues.
A. Hypoxyprobe (HPI) was injected into mice 150 min before sacrifice. Tumor tissues were analyzed using anti-hypoxyprobe antibody to detect HPI expression (red) in TC71–siREST and TC71–siControl tumors.
B. HPI expression was quantified by microscopy software Simple PCI in at least five random microscopy fields from different samples, and averages were calculated. The difference between the two groups was statistically significant (P<0.01).
C. HPI (green) and desmin (red) double immunofluorescent staining was performed. HPI expression levels were higher and desmin expression levels were lower in TC71–siREST tumor samples than those in TC71–siControl samples.
D. TUNEL assay was performed to detect apoptotic cells (green) in TC71–siREST and TC71-siControl tumor samples.
E. Apoptotic cells were quantified by Simple PCI in at least five random microscopy fields, and group averages were calculated. The difference between the two groups was statistically significant (P<0.01).
Suppression of REST reduced DLL4 and Hes1 expression in TC71 tumors
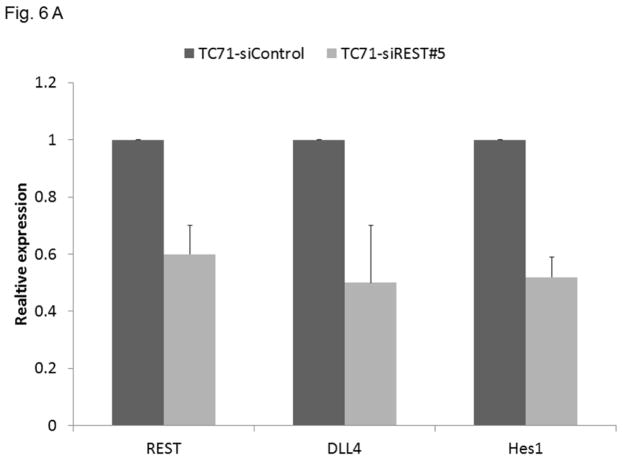
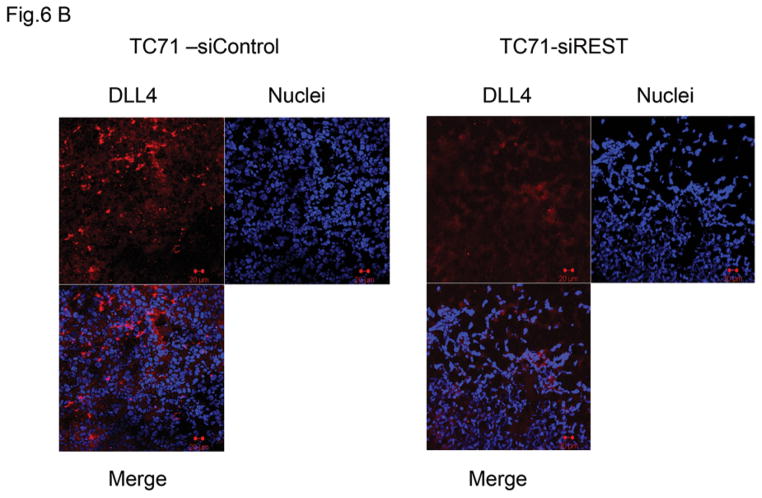
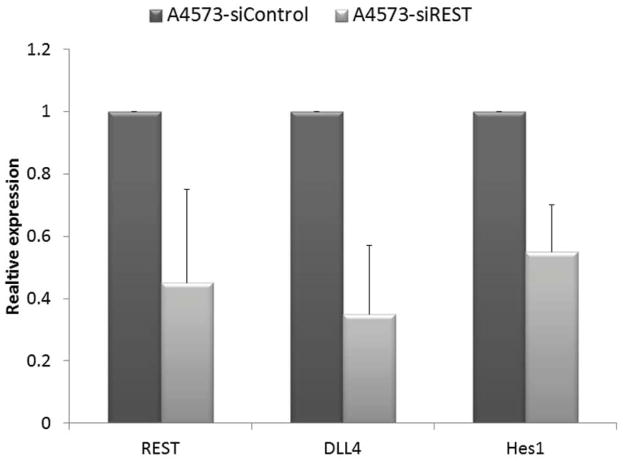
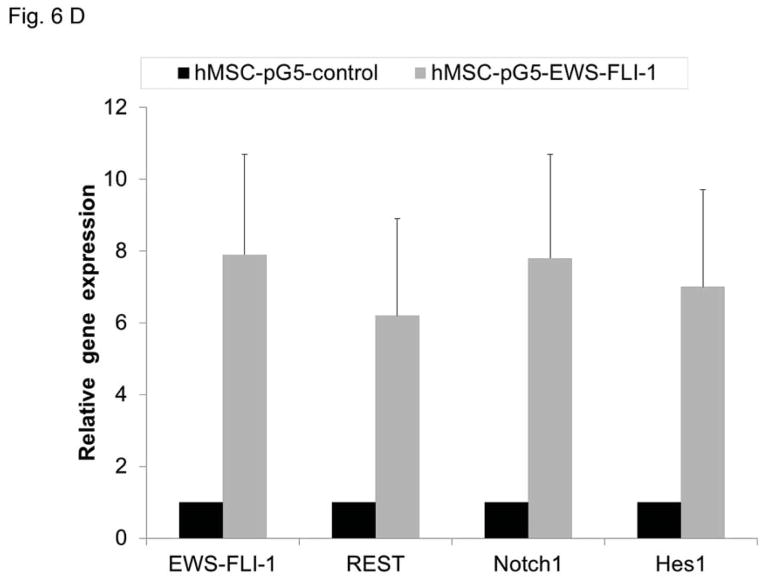
Our previous studies demonstrated that the Notch pathway , specifically DLL4, play a critical role in tumor vessel pericyte coverage 15. Inhibition of DLL4 resulted in decreased pericyte marker expression in Ewing tumors in vivo, changed tumor vessel morphology, and increased tumor hypoxia. Since pericyte levels were significantly decreased in siREST tumors, we next investigated whether inhibition of REST affects DLL4 and Hes1, one of the downstream effectors of the DLL4-Notch signaling pathway. Both DLL4 and Hes1 expressions were reduced in TC71–siREST cells (Fig. 6A). Immunofluorescent staining (Fig. 6B) showed that DLL 4 expression was lower in TC71–siREST tumor tissues than that in siControl tumors. The Ewing sarcoma cell line A4573 was also tested. The results indicated that inhibition of REST suppressed DLL4 and Hes1 expression in both TC71 and A4573 cells (Fig. 6C). In order to confirm the link between EWS-FLI-1 and the Notch signaling pathway, hMSC were transfected with pG5-EWS-FLI-1 or the control plasmid. EWS-FLI-1, REST, Notch1, and Hes1 expression levels were all higher following transfection with pG5-EWS-FLI-1 than those following transfection with the pG5-control (Fig. 6D). These data suggest that down-regulation of REST inhibited expression of both DLL4 and Hes1, in agreement with our previous findings that pericyte marker expression and tumor vascular pericyte coverage in Ewing sarcoma are controlled by DLL4 and Hes1 15, 17.
Figure 6. Inhibition of REST suppressed DLL4 and Hes1 expression in TC71 and A4573 cells, EWS-FLI-1 up-regulated REST, Notch1, and Hes1 expression in hMSC.
A. RNA was extracted from TC71–siREST#5 or TC71–siControl cells. REST, DLL4 and Hes1 levels were quantified by real-time PCR, and the mean for three independent experiments was calculated. Bars represent standard deviations.
B. DLL4 expression (red) was examined by immunofluorescent staining in TC71–siREST and TC71–siControl tumor tissues.
C. REST, DLL4 and Hes1 expressions were determined by real-time PCR in A4573-siREST and A4573-siControl cells. The averages for three independent experiments were determined. The difference between the two cell types was statistically significant (P < 0.01). The bar represents standard deviation.
D. hMSC were transfected with pG5-EWS-FLI-1 or pG5-control vector. EWS-FLI-1, REST, Notch1 and Hes1 expression levels were detected by real-time PCR in these cells.
Discussion
Ewing sarcoma is a poorly differentiated small round cell tumor with expression of the neural cell markers S-100, synaptophysin, neural-specific enolase, and CD57 1, 18. We investigated the role of the neuronal repressor gene REST in Ewing sarcoma to improve the understanding of biology of this tumor. This study is the first to demonstrate that high levels of REST are expressed in Ewing sarcoma cell lines and patient tumor samples, and the expression of REST is correlated with EWS-FLI-1, the hallmark fusion protein in Ewing sarcoma. We further demonstrated EWS-FLI-1 regulates REST expression. The transfection of EWS-FLI-1 into hMSC, where REST is not expressed, induced REST mRNA and protein production. In order to determine whether this regulation is also functional in neural cells, the human neural progenitor(HNP) cells were used. The results were confirmed using HNP cells.
Preliminary experiments investigating the interaction between EWS-FLI-1 and the REST promoter using CHIP assay indicated that EWS-FLI-1 may bind to the REST promoter (data not shown), suggesting that EWS-FLI-1 directly regulates REST expression. However, further studies are needed to confirm these findings.
Inhibition of EWS-FLI-1 expression in TC71 and A4573 cells resulted in reduction of REST protein expression (Fig. 2C). By contrast, altering the expression of REST in TC71 cells had no effect on EWS-FLI-1 expression. Taken together, these results indicate that REST is a downstream target of EWS-FLI-1. While EWS-FLI-1 is known to control the expression of many other genes, our data show for the first time that REST is regulated by EWS-FLI-1. Therefore, REST overexpression may contribute to the pathogenesis of Ewing sarcoma. The importance of REST to the growth and development of Ewing sarcoma was demonstrated by creating TC71–siREST tumor cell clones, injecting these cells into nude mice, and comparing their growth in vivo to that of siControl transfected cells. Inhibition of REST resulted in significant decreased tumor growth (Fig. 3). Since we found no alteration of EWS-FLI-1 in TC71–siREST cells, the decreased tumor growth was not secondary to the down-regulation of EWS-FLI-1, which has previously been reported 19. We also determined the role of REST on cell proliferation in vitro and in vivo. The results indicated that inhibition of REST did not significantly inhibit in vitro cell growth(data not shown), therefore reduction in tumor growth by REST inhibition does not appear to be due to a direct effect on tumor cell proliferation. We previously demonstrated that Ewing sarcoma is a vascular rich tumor and that interference with vascular formation and tumor vessel expansion severely retards tumor growth and metastasis to the lung 15, 17. We further demonstrated that VGEF165 and DLL4 are critical mediators of Ewing tumor vascular development and that pericytes play an important role in maintaining tumor oxygenation and tumor vessel blood flow. Here we investigated whether the inhibition of REST affected tumor vessel characteristics and function. Neither CD31 nor VEGF expression were altered in TC71–siREST tumors (Fig. 4A). However, there was a significant decrease in tumor vessel pericyte coverage. These findings suggest that tumor vessel morphology was altered in tumors where REST expression was inhibited. Pericyte coverage of these vessels was severely compromised (Fig. 4D). This decrease in tumor vessel pericyte coverage correlated with increased tumor hypoxia and tumor cell apoptosis (Fig. 5). Pericytes are important for vascular stabilization, contribute to efficient vascular blood flow, and prevent vascular leakage 21. Decreased pericyte coverage results in decreased vascular proficiency, characterized by increased vessel leakiness and decreased tumor perfusion, resulting in tumor hypoxia. Our results confirmed that decreased numbers of pericytes surrounding the tumor vasculature result in increased hypoxia and apoptosis. These results suggests that REST controls pericyte coverage of tumor vessels and inhibition of REST leads to decreased pericyte coverage and poor tumor perfusion, which results in increased hypoxia and tumor cell apoptosis.
We previously determined that the Notch pathway, specifically DLL4, regulates the differentiation of pericytes from bone marrow cells in Ewing sarcoma 15. We demonstrated that DLL4 plays a crucial role in the formation of the pericyte layer surrounding tumor vessels and in the tumor vessel expansion required for the growth. This pathway controlling pericyte development involves Hes1, one of the downstream effectors of the DLL4 pathway 17. In this study, DLL4 and Hes1 levels were significantly reduced following the inhibition of REST (Fig. 6), confirming the correlation between the DLL4-Notch signaling pathway and vascular pericyte coverage. We are the first to show that REST and EWS-FLI-1 (Fig. 6D) activate the DLL4-Notch pathway in Ewing sarcoma.
In summary, the data presented here support the hypothesis that REST, a neuronal repressor gene, is up-regulated by EWS-FLI-1 in Ewing sarcoma and that the increased REST expression contributes to the growth of the tumor. Our findings suggest that REST is involved in tumor vascular expansion through a mechanism involving DLL4 and Hes1. Suppression of REST resulted in inhibition of tumor growth, decreased levels of tumor vessel pericytes, increased hypoxia and apoptosis. The findings that REST controls the formation of tumor vessels, vascular morphology and function is novel. The results support our hypothesis that EWS-FLI-1, which is responsible for the malignant phenotype of Ewing sarcoma, controls the development of tumor vessels as well as the tumor vessel morphology. This regulation of tumor vasculature by EWS-FLI-1 is mediated in part by REST. Targeting of angiogenic pathways and disruption of the development of functional tumor vessels inhibited Ewing sarcoma growth in several mouse xenograft models 17, 22, 23. A recent preliminary clinical trial indicated that the addition of low-dose anti-angiogenic chemotherapy to standard multi-agent chemotherapy may add therapeutic benefit for patients with newly diagnosed metastatic Ewing sarcoma in the lung 24. Taken together these data suggest that REST may be a potential therapeutic target for Ewing sarcoma.
Acknowledgments
This work was supported by the National Institutes of Health grant CA 103986 and core grant CA106672.
We thank Dr. Vidya Gopalakrishnan for helpful suggestions and Ms. Jeanette Quimby for manuscript preparation.
Footnotes
Conflict of interest disclosures: All authors declare no financial disclosure.
References
- 1.Riggi N, Stamenkovic I. The Biology of Ewing sarcoma. Cancer Lett. 2007;254:1–10. doi: 10.1016/j.canlet.2006.12.009. [DOI] [PubMed] [Google Scholar]
- 2.Barker LM, Pendergrass TW, Sanders JE, Hawkins DS. Survival after recurrence of Ewing's sarcoma family of tumors. J Clin Oncol. 2005;23:4354–4362. doi: 10.1200/JCO.2005.05.105. [DOI] [PubMed] [Google Scholar]
- 3.Miser JS, Krailo MD, Tarbell NJ, et al. Treatment of metastatic Ewing's sarcoma or primitive neuroectodermal tumor of bone: evaluation of combination ifosfamide and etoposide--a Children's Cancer Group and Pediatric Oncology Group study. J Clin Oncol. 2004;22:2873–2876. doi: 10.1200/JCO.2004.01.041. [DOI] [PubMed] [Google Scholar]
- 4.Rorie CJ, Thomas VD, Chen P, Pierce HH, O'Bryan JP, Weissman BE. The Ews/Fli-1 fusion gene switches the differentiation program of neuroblastomas to Ewing sarcoma/peripheral primitive neuroectodermal tumors. Cancer Res. 2004;64:1266–1277. doi: 10.1158/0008-5472.can-03-3274. [DOI] [PubMed] [Google Scholar]
- 5.von Levetzow C, Jiang X, Gwye Y, et al. Modeling initiation of Ewing sarcoma in human neural crest cells. PLoS One. 2011;6:e19305. doi: 10.1371/journal.pone.0019305. [DOI] [PMC free article] [PubMed] [Google Scholar]
- 6.Hu-Lieskovan S, Zhang J, Wu L, Shimada H, Schofield DE, Triche TJ. EWS-FLI1 fusion protein up-regulates critical genes in neural crest development and is responsible for the observed phenotype of Ewing's family of tumors. Cancer Res. 2005;65:4633–4644. doi: 10.1158/0008-5472.CAN-04-2857. [DOI] [PubMed] [Google Scholar]
- 7.Singh SK, Kagalwala MN, Parker-Thornburg J, Adams H, Majumder S. REST maintains self-renewal and pluripotency of embryonic stem cells. Nature. 2008;453:223–227. doi: 10.1038/nature06863. [DOI] [PMC free article] [PubMed] [Google Scholar]
- 8.Gopalakrishnan V. REST and the RESTless: in stem cells and beyond. Future Neurol. 2009;4:317–329. doi: 10.2217/fnl.09.1. [DOI] [PMC free article] [PubMed] [Google Scholar]
- 9.Bruce AW, Donaldson IJ, Wood IC, et al. Genome-wide analysis of repressor element 1 silencing transcription factor/neuron-restrictive silencing factor (REST/NRSF) target genes. Proc Natl Acad Sci U S A. 2004;101:10458–10463. doi: 10.1073/pnas.0401827101. [DOI] [PMC free article] [PubMed] [Google Scholar]
- 10.Belyaev ND, Wood IC, Bruce AW, Street M, Trinh JB, Buckley NJ. Distinct RE-1 silencing transcription factor-containing complexes interact with different target genes. J Biol Chem. 2004;279:556–561. doi: 10.1074/jbc.M310353200. [DOI] [PubMed] [Google Scholar]
- 11.Gulino A, Arcella A, Giangaspero F. Pathological and molecular heterogeneity of medulloblastoma. Curr Opin Oncol. 2008;20:668–675. doi: 10.1097/CCO.0b013e32831369f4. [DOI] [PubMed] [Google Scholar]
- 12.Lawinger P, Venugopal R, Guo ZS, et al. The neuronal repressor REST/NRSF is an essential regulator in medulloblastoma cells. Nat Med. 2000;6:826–831. doi: 10.1038/77565. [DOI] [PubMed] [Google Scholar]
- 13.Su X, Gopalakrishnan V, Stearns D, et al. Abnormal expression of REST/NRSF and Myc in neural stem/progenitor cells causes cerebellar tumors by blocking neuronal differentiation. Mol Cell Biol. 2006;26:1666–1678. doi: 10.1128/MCB.26.5.1666-1678.2006. [DOI] [PMC free article] [PubMed] [Google Scholar]
- 14.Thiele CJ. Biology of pediatric peripheral neuroectodermal tumors. Cancer Metastasis Rev. 1991;10:311–319. doi: 10.1007/BF00554793. [DOI] [PubMed] [Google Scholar]
- 15.Stewart KS, Zhou Z, Zweidler-McKay P, Kleinerman ES. Delta-like ligand 4-Notch signaling regulates bone marrow-derived pericyte/vascular smooth muscle cell formation. Blood. 2011;117:719–726. doi: 10.1182/blood-2010-05-284869. [DOI] [PMC free article] [PubMed] [Google Scholar]
- 16.Morales-Arias J, Meyers PA, Bolontrade MF, et al. Expression of granulocyte-colony-stimulating factor and its receptor in human Ewing sarcoma cells and patient tumor specimens: potential consequences of granulocyte-colony-stimulating factor administration. Cancer. 2007;110:1568–1577. doi: 10.1002/cncr.22964. [DOI] [PubMed] [Google Scholar]
- 17.Schadler KL, Zweidler-McKay PA, Guan H, Kleinerman ES. Delta-like ligand 4 plays a critical role in pericyte/vascular smooth muscle cell formation during vasculogenesis and tumor vessel expansion in Ewing's sarcoma. Clin Cancer Res. 2010;16:848–856. doi: 10.1158/1078-0432.CCR-09-1299. [DOI] [PMC free article] [PubMed] [Google Scholar]
- 18.Riggi N, Cironi L, Suva ML, Stamenkovic I. Sarcomas: genetics, signalling, and cellular origins. Part 1: The fellowship of TET. J Pathol. 2007;213:4–20. doi: 10.1002/path.2209. [DOI] [PubMed] [Google Scholar]
- 19.Chansky HA, Barahmand-Pour F, Mei Q, et al. Targeting of EWS/FLI-1 by RNA interference attenuates the tumor phenotype of Ewing's sarcoma cells in vitro. J Orthop Res. 2004;22:910–917. doi: 10.1016/j.orthres.2003.12.008. [DOI] [PubMed] [Google Scholar]
- 20.Hirschi KK, D'Amore PA. Pericytes in the microvasculature. Cardiovascular Research. 1996;32:687–698. [PubMed] [Google Scholar]
- 21.Song S, Ewald AJ, Stallcup W, Werb Z, Bergers G. PDGFR beta+ perivascular progenitor cells in tumous regulate pericyte differentiation and vascular survival. Nature Cell Biology. 2005;7:870–879. doi: 10.1038/ncb1288. [DOI] [PMC free article] [PubMed] [Google Scholar]
- 22.Ackermann M, Morse B, VD, Carvajal I, Konerding M. Anti-VEGFR2 and anti-IGF-1R-Adnectins inhibit Ewing's sarcoma A673-xenograft growth and normalize tumor vascular architecture. Angiogenesis. 2012;15:685–695. doi: 10.1007/s10456-012-9294-9. [DOI] [PubMed] [Google Scholar]
- 23.DuBois S, Marina N, Glade-Bender J. Angiogenesis and vascular targeting in Ewing sarcoma: a review of preclinical and clinical data. Cancer. 2010;116:749–757. doi: 10.1002/cncr.24844. [DOI] [PMC free article] [PubMed] [Google Scholar]
- 24.Felgenhauer J, Nieder M, Krailo M, et al. A pilot study of low-dose anti-angiogenic chemotherapy in combination with standard multiagent chemotherapy for patients with newly diagnosed metastatic Ewing sarcoma family of tumors: A Children's Oncology Group (COG) Phase II study NCT00061893. Pediatric Blood Cancer. 2012 doi: 10.1002/pbc.24328. [DOI] [PMC free article] [PubMed] [Google Scholar]


