Abstract
Background
Transforming Growth Factor-beta (TGFβ) signaling regulates a myriad of biological processes during embryogenesis, in the adult, and during the manifestation of disease. TGFβ signaling is propagated through one of three TGFβ ligands interacting with Type I and Type II receptors, and Type III co-receptors. Although TGFβ signaling is regulated partly by the combinatorial expression patterns of TGFβ receptors and ligands, a comprehensive gene expression analysis has not been published.
Results
Here we report the embryonic mRNA expression patterns in chicken embryos of the canonical TGFβ ligands (TGFB1, TGFB2, and TGFB3) and receptors (TGFBR1, TGFBR2, TGFBR3), plus the Activin A receptor, type 1 (ACVR1) and co receptor Endoglin (ENG) that also transduce TGFβ signaling.
Conclusions
TGFB ligands and receptors show dynamic and frequently overlapping expression patterns in numerous embryonic cell layers and structures. Integrating expression information identifies combinations of ligands and receptors that are involved in specific developmental processes including somitogenesis, cardiogenesis and vasculogenesis.
Keywords: Chicken, Gallus gallus, in situ Hybridization, Transforming Growth Factor Beta
INTRODUCTION
Transforming growth factor-β (TGFβ) signaling regulates diverse biological processes throughout embryonic development and postnatal life, and during the manifestation of human disease (1–4). TGFβ signaling is transduced via the interaction of one of three TGFβ ligands (TGFβ1, TGFβ2, or TGFβ3) with the type II trans-membrane receptor serine/threonine kinase TGFβR2, resulting in the assembly of a tetra-heteromeric receptor complex consisting of two type II receptors and two type I receptors (typically TGFβRI). The constitutively active kinase activity of the type II receptor phosphorylates the type I receptor, activating its kinase activity. In some contexts, TGFβ ligands can also signal through the type I receptor ACVR1 (5). Binding of TGFβ ligands is facilitated through interactions with accessory proteins (Type III receptors) that include TGFβR3 (6) and ENG (7).
Alterations of TGFβ signaling in mice frequently results in embryonic lethality due to defects in multiple organ systems. Depending upon genetic background, ablation of TGFB1 leads to weaning-age lethality due to autoimmune disease (8) or mid gestation lethality from defects in yolk sac vasculogenesis and hematopoiesis (9). TGFBR2 ablation leads to similar defects in the vasculature of the yolk sac and placenta (10) and deletion of TGFBR1 or TGFBR2 leads to developmental defects in the lymphatic network (11). Defects observed following a TGFβ2 deletion involve many major organ systems including cardiac, lung, skeletal, urogenital tract, inner ear and eye (12,13). TGFβ3 ablation leads to soft palate, lung and heart defects (14–16). Defects following TGFBR3 ablation involve angiogenesis and heart development (17,18).
Mechanisms regulating TGFβ signaling are complex, and include control of ligand activity, regulation of ligand binding to receptor, modulation of the intracellular signaling pathway, and the combinatorial expression of specific ligands and receptors. A number of early reports described the expression of some TGFβ pathway components in embryonic tissues using radiolabeled section in situ hybridization (19–22). More recently the whole mount ISH expression patterns of ENG (23) and TGFB2 (24) have been described in developing chicken embryos. However, a comprehensive expression analysis has not been described in any species. Here we report the mRNA expression patterns of the canonical TGFB ligands and receptors plus ACVR1 and ENG, from gastrula stages through embryonic day 4 of development in the white leghorn chicken, Gallus gallus domesticus.
RESULTS AND DISCUSSION
The TGFβ ligand and receptor genes in chicken
Table I shows the gene IDs and genomic locations of genes coding for the three TGFβ ligands (TGFB1, TGFB2, and TGFB3), the three canonical TGFβ receptors (TGFBR1, TGFBR2, TGFBR3), plus ACVR1 and ENG. The chicken TGFB1 gene was originally called TGFB4, although it is now clear that the chicken genome contains three canonical TGFB ligand genes that are orthologs of the three ligand genes identified in other species (Halper et al., 2004).
Table I.
| Gene Symbol | Gene Name* | Also Known As | Entrez GeneID | Genomic Location |
|---|---|---|---|---|
| TGFB1 | Transforming growth factor Beta 1 | CED, LAP, DPD1, TGFbeta, Latency-associated peptide | 100873 157 |
Unknown** |
| TGFB2 | Transforming growth factor beta 2 | G-TSF, Cetemin, Polyergin, BSC01 cell growth inhibitor, TGF-beta2 | 421352 | Ch3: 20,477,096-20,539,801 |
| TGFB3 | Transforming growth factor beta 3 | ARVD, FLJ16461 | 396438 | Ch5: 40,871,283-40,879,235 |
| TGFBR1 | Transforming growth factor beta, receptor I | ALK5, AAT5, MMSE, SKR5, LDS1A, LDS2A, TGFR-1, ACVRLK4 | 374094 | Ch2: 57,071,487-57,104,459 |
| TGFBR2 | Transforming growth factor beta, receptor II | AAT3, LDS1B, LDS2B, MFS2, TAAD2, RIIC | 396399 | Ch2: 39,810,472-39,873,178 |
| TGFBR3 | Transforming growth factor beta, receptor III | Betaglycan, BGCAN | 374251 | Ch8: 15,046,473-15,153,887 |
| ACVR1 | Activin A receptor, type I | ALK2, ACVR1A, ACVRLK2, SKR1, ACTR1, TSR1, | 395246 | Ch7: 37,895,212-37,907,942 |
| ENG | Endoglin | END, HHT1, ORW, CD105 | 771557 | Ch7: 5,509,400-5,517,845 |
Official Gene names as assigned by the Chicken Gene Nomenclature Committee (27).
Gene model not present in the Gallus_gallus-4.0 genome assembly.
TGFB ligand and receptor expression in HH stages 4–12 chicken embryos
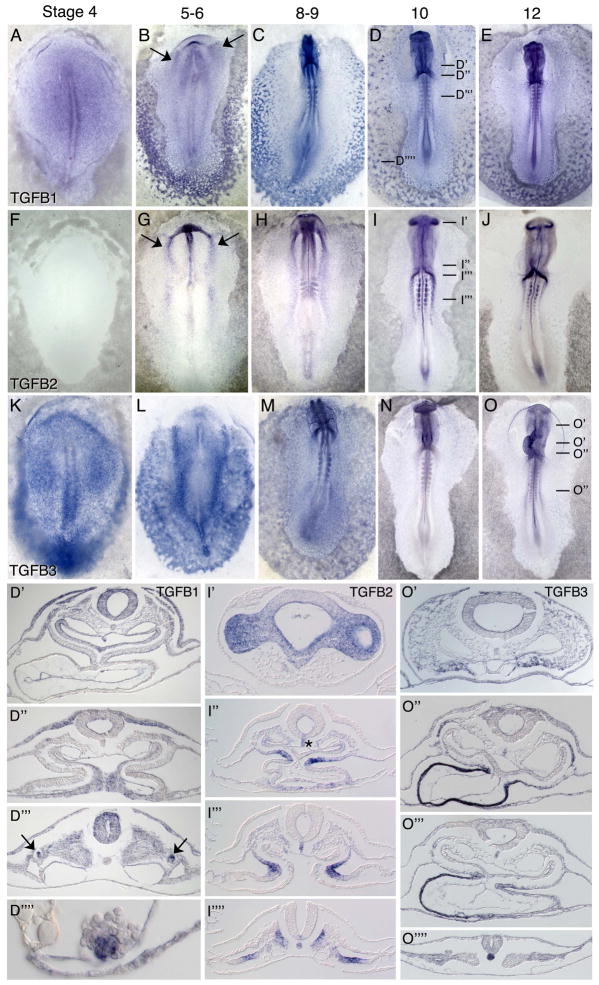
TGFB ligand mRNAs show differential localization during the first three days of embryo development. At mid gastrula stages (HH stages 3–4), TGFB1 is expressed throughout the epiblast and in the primitive streak and mesoderm, with increased expression along the posterior and lateral borders of the embryonic and extraembryonic regions (Figure 1A). TGFB3 shows similar though stronger expression (Figure 1K), particularly in the primitive streak and lateral mesoderm. TGFB2 mRNAs are not detected (Figure 1F). At stages 5–6, TGFB1 is expressed in the cardiogenic anterior lateral mesoderm (Figure 1B, arrows), the paraxial mesoderm anterior to Hensen’s node, the neuroectoderm and the blood islands (Figure 1B). TGFB2 expression is first detected at late gastrula stages in the anterior and posterior lateral mesoderm, in the head fold and in the notochord (Figure 1G). In the anterior lateral mesoderm, TGFB2 transcripts are detected medial to TGFB1 expression in the heart forming mesoderm (arrows in Figures 1B, G). At stage 6, TGFB3 is expressed weakly throughout the epiblast with higher levels laterally, and robustly in the posterior and anterior lateral embryonic and extraembryonic mesoderm (Figure 1L). By stage 8, TGFB3 transcripts are detected in the anterior ectoderm underlying the head process, in endothelial cells near the head, in the neural folds, anterior lateral cardiogenic mesoderm, and somites (Figure 1M). More posteriorly, expression is observed in the intermediate and lateral mesoderm, and in the hematopoietic cells of the blood islands. Lower expression levels of TGFB3 are also observed in the cranial neural crest, and in ventral head mesenchyme that will form the anterior-most outflow tract region of the forming heart, and the lateral somatic and splanchnic mesoderm. At stages 8–10, TGFB1 is expressed broadly at low levels, and at higher levels in the somites, notochord, vascular endothelium and the neural tube and ectoderm (Figure 1C). By stage 10–12 TGFB1 is expressed at higher levels in the non-neural ectoderm, dorsal neural tube and neural crest, endothelial cells including the endocardium, the foregut, dorsal aspects of somites, the nephric ducts, and in a subset of blood island cells (Figures 1D, D′–D″″, 1E). At stages 8–9, TGFB2 expression is observed in the lateral mesoderm, notochord, optic cups and the second heart field (1H). By stages 10–12 staining remains in the optic vesicles and notochord with expanded expression in the ventromedial aspects of the more rostral somites corresponding to the forming sclerotomes (Figures 1I–J, 1I′–I″″). TGFB2 transcripts are also localized to the dorsal mesocardium at the level of the heart (Figure 1I″), and more posteriorly in the splanchnic mesoderm. (Figure 1I″″). By stages 10–12, TGFB3 expression is restricted to the head mesenchyme, the bulbus cordis and greater curvature of the myocardium, and in the notochord (Figure 1N, 1O, 1O′–O″″). Low-level expression is evident in endothelial cells of the embryonic vasculature, while somewhat higher expression levels are observed in extraembryonic endothelial cells including blood island endothelium. Expression within the hematopoietic cells of the blood islands is diminished.
Figure 1.
mRNA expression patterns of TGFB ligands in HH stage 4–12 chicken embryos. TGFB1 (A–E, D′–D″″) shows widespread low to moderate expression in the epiblast, primitive streak and mesoderm, with higher expression in a subset of mesoderm and ectodermal cells. TGFB2 (F–J, I′-I″″) shows more localized expression in the notochord and medial portion of the precardiac mesoderm, in the optic vesicles, notochord and neural tube floor plate, forming sclerotomes and dorsal mesocardium. TGFB3 (K–O, O′-O″″) shows widespread expression in the lateral embryonic and extraembryonic mesoderm including the forming blood islands, the notochord and myocardium, and weaker expression in the head mesenchyme, and vascular endothelial cells. Arrows in (B) and (G) indicate expression in the heart forming region mesoderm. Arrows in (D‴) point to the nephric ducts. Asterisk on (I″) indicates expression in the notochord and neural tube floor plate.
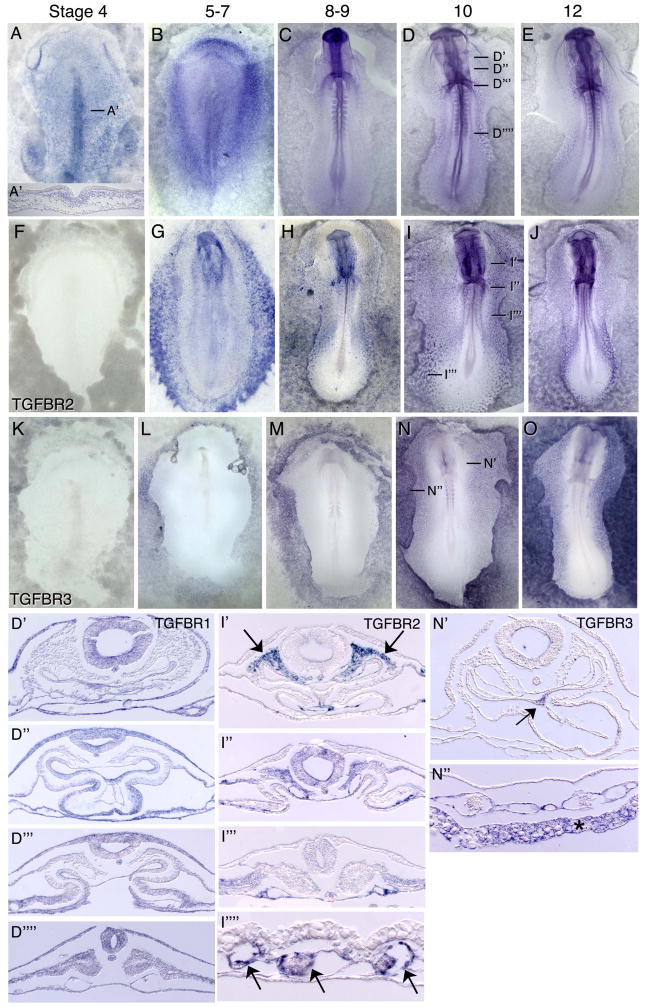
At stages 4–6, TGFBR1 mRNA is detected at low levels in the epiblast and more robustly in the newly ingressed and lateral mesoderm (Figure 2A, A″, B). TGFBR2 is expressed at undetectable levels (Figure 2F), while TGFBR3 is very weakly expressed in the extraembryonic mesoderm (Figure 2K). Between stages 8–12, TGFBR1 becomes broadly expressed at low levels, with somewhat higher expression detected in the floor of the gut, the heart forming mesoderm and the myocardium, the dorsal aspects of the somites, the ectoderm, and the notochord and neural tube (Figure 2C–E, D″–D″″).
Figure 2.
mRNA expression patterns of TGFB receptors in HH stage 4–12 chicken embryos. TGFBR1 (A–E, A′, D′–D″″) is broadly expressed at low levels, with higher early expression in the primitive streak and lateral mesoderm. Later expression is observed in the floor of the gut, the heart forming mesoderm and the myocardium, the dorsal aspects of the somites, the ectoderm, and the notochord and neural tube. TGFBR2 (F–J, I–I″″) expression is observed in head mesenchyme, endothelial cells including the endocardium, and in the head mesenchyme. TGFBR3 (K–O, N′–N″) is expressed in the floor of the foregut, in lateral embryonic and extraembryonic endothelial cells, and in the yolky cells of the extraembryonic endoderm. Arrows in (I′) indicate expression in the head mesenchyme; arrows in (I″″) point to expression in blood island endothelial cells. Arrow in (N′) points to expression in the midline of the foregut endoderm. Asterisk in (N″) indicates expression in the yolky extraembryonic endoderm.
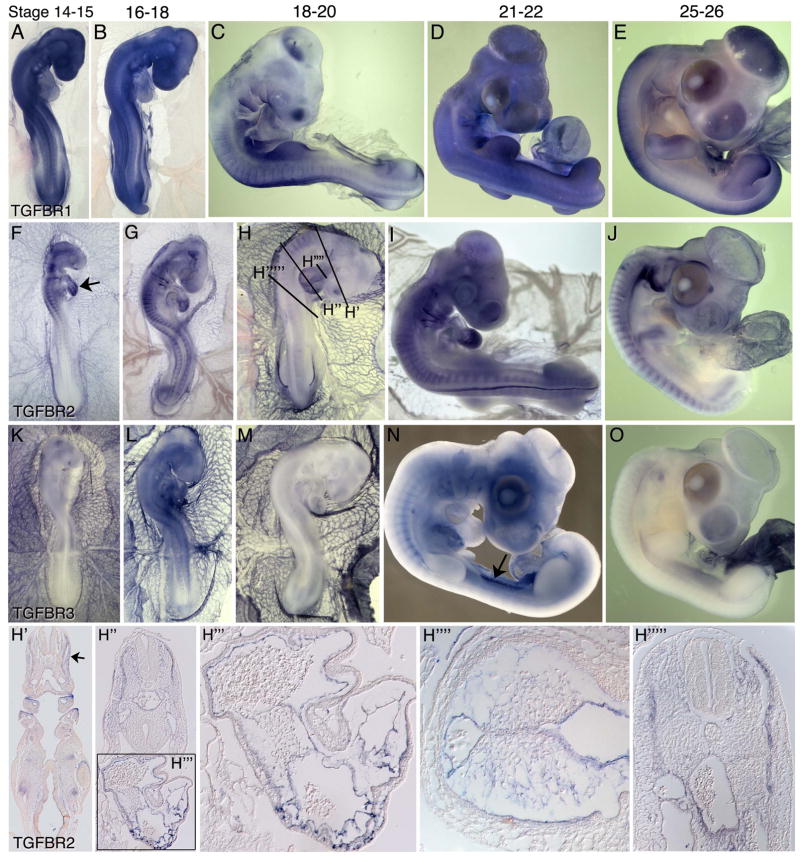
At stage 7, TGFBR2 is detected anteriorly in the extraembryonic endoderm and paraxial mesoderm, and moderately in the anterior lateral and posterior lateral mesoderm (Figure 2G). Expression is also detected in the extraembryonic mesoderm. By stage 8–9, TGFBR2 is strongly expressed in endothelial cells of the forming embryonic and extraembryonic vasculature, but not in the hematopoietic cells of the blood islands (Figure 2H). At stages 10–12, TGFBR2 transcripts are detected in the head mesenchyme, endocardium, and somatic mesoderm and robustly in endothelial cells (Figure 2I, J, I″–I″″, arrow). TGFBR3 transcripts are detected beginning at stages 5–6 in the yolky extraembryonic endodermal cells (Figure 2L). Between stages 8–12, TGFBR3 expression is evident in the lateral embryonic and extraembryonic endothelial cells, and in the extraembryonic yolky endoderm (Figures 2M, N, N″–N″, O). TGFBR3 transcripts are also detected in the floor of the foregut beginning at stage 9 (Figures 2N′, arrow).
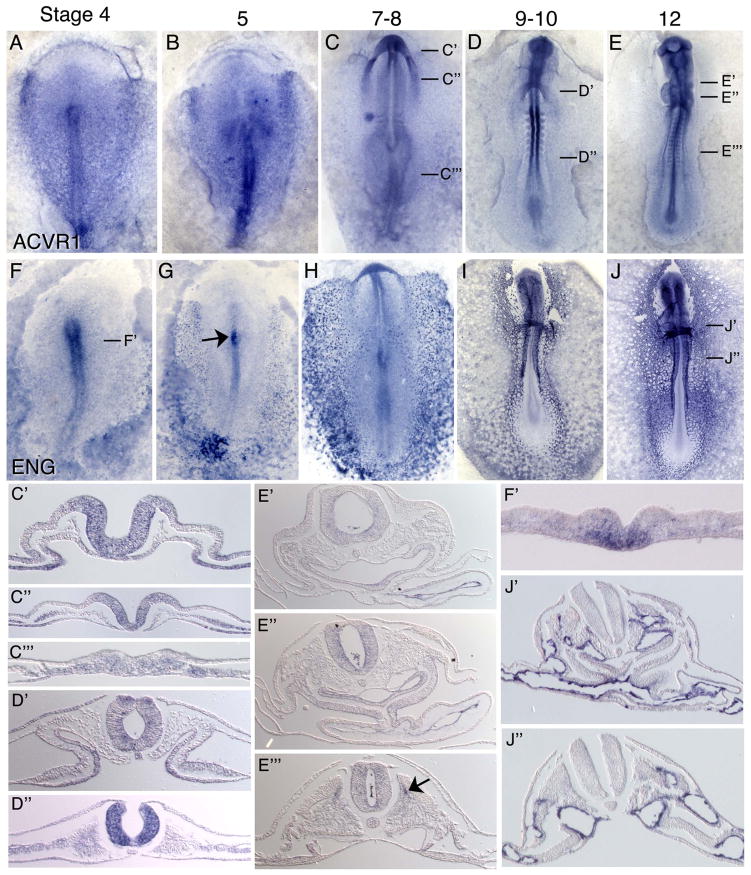
ACVR1, another Type I receptor known to transduce TGFβ signaling (5), is expressed at stage 4 in the primitive streak including Hensen’s node, in the area pellucida and throughout the mesoderm (Figure 3A). At stage 5, ACVR1 transcripts are detected in the primitive streak and throughout the mesoderm, with higher expression in the mesoderm adjacent to Hensen’s node and in the anterior-lateral cardiogenic mesoderm (Figure 3B). Broad mesodermal expression persists at stage 8, with higher expression levels in the heart-forming regions and in the anterior neural folds (Figure 3C, C″–C‴). Expression is also evident in the lateral endoderm. Between stages 9–12, ACVR1 expression becomes pronounced in the neural tube, nephric ducts, and endocardium and generally throughout the lateral mesoderm (Figures 3D, D′–D″, E, E′–E‴). Localized expression is also evident in the medial aspect of the myotome (Figure 3E‴, arrow). Weak expression is also detected in vasculature.
Figure 3.
mRNA expression pattern of TGFB Type I Receptor ACVR1, and the Type III receptor Endoglin. ACVRI is expressed broadly at early stages with higher expression in the primitive streak and anterior-lateral mesoderm and endoderm, and later in the neural tube, endocardium and DML (A–E, C′–E‴). Endoglin (F–J, F′–J″) is enriched in the primitive streak and early mesoderm, and is later robustly expressed in all vascular endothelial cells. Arrow in (G) indicates expression in notochord cells emerging from Hensen’s node. Arrow in (E‴) indicates expression in the medial myotome.
The expression pattern of ENG between stages 4–13 has been previously reported (23). Our ISH analysis shows similar though stronger expression patterns at several stages. At stage 4, ENG expression is observed in the ventral primitive streak, with higher expression anteriorly (Figure 3F, F′), and in the lateral and extraembryonic mesoderm. From stages 5–8, expression in the primitive streak becomes restricted to the newly formed notochord cells emerging from Hensen’s node, in the blood islands and in individual nascent endothelial cells of the lateral and extraembryonic mesoderm (Figure 3G, H). By stages 10–12, ENG is strongly expressed in all endothelial cells of the embryonic vasculature and endocardium, and at reduced levels in extraembryonic endothelial cells (Fig 3I, J, J′, J″).
TGFB ligand and receptor expression from stages 14 to 25
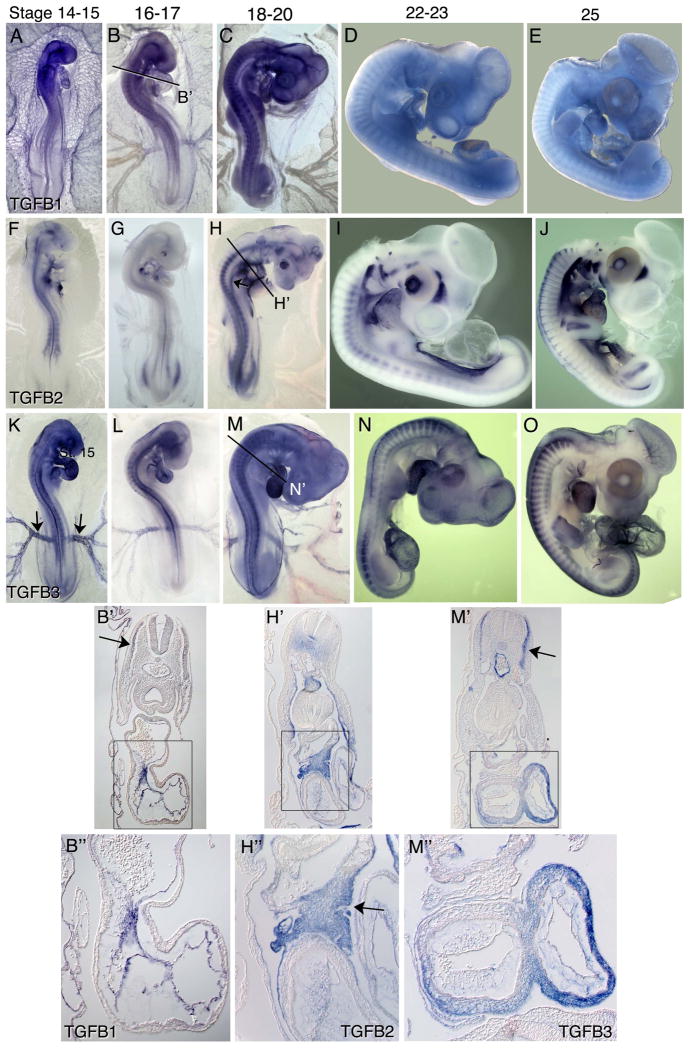
Between stages 14 and 25, expression patterns of TGFB ligands and receptors highlight important functions in the development of multiple organ systems. At stages 14–16, TGFB1 is expressed throughout the vasculature including the endocardium and blood island endothelium (Figure 4A, B, B′, B″). At stages 18–20, TGFB1expression declines in the vasculature but is retained in the endocardium. Expression is observed in the myotomes and weakly in the nephric ducts (Figure 4B′, C). At stages 14–18, TGFB2 transcripts are detected in notochord and surrounding sclerotomal cells, the neural tube floor plate, the proepicardium (4F, arrow), and in the mesocardium dorsal to the heart (second heart field) and in the anterior gut (Figure 4F–H, H′, H″). TGFB2 expression is also evident in the endocardium and vascular endothelial cells of the great vessels, in the dorsomedial lip of the dermatome (DML) and in the limb bud primordia. Finally, TGFB2 transcripts are evident in the lining of the coelom arising from the somatopleure (Figure 4H′). At stages 23–26, TGFB1 transcripts are broadly expressed at moderate levels, with higher levels detected in a subset of hematopoietic cells residing in the extraembryonic vasculature and in the allantois (Figure 4D, E). At these stages, TGFB2 transcripts are robustly expressed in the head mesenchyme dorsal to the eye, in the retina, the pharyngeal arches, the ear, the epicardium, ventral aspects of the somatopleure adjacent the coelom and in the gonadal ridges (Figure 4I, J). By stage 26, TGFB2 expression persists in the ear, retina and head mesenchyme adjacent to the eye, in the second heart field and in the epicardium. Strong expression is also evident in the cartilage condensations of bone forming regions in the limb buds (Figure 4J), limb girdle and ribs (Figure 4J).
Figure 4.
mRNA expression patterns of TGFB ligands in HH stage 14–26 chicken embryos. TGFB1 (A–E, B′–B″) is enriched in the embryonic and extra embryonic vasculature, somites and endocardium. TGFB2 (F–J, H′–H″) is expressed in a numerous cell types and developing organs, including the notochord, surrounding sclerotome, proepicardium (arrow in (F)), body wall, dorsal mesocardium, aortic vascular endothelial cells pharyngeal arches, gonadal ridges and chondrogenic condensations of forming bones (arrows in (J)). TGFB3 (K–O, M′–M″) shows enriched expression in the endothelium of the aorta and vitelline arteries (arrows in (K)), the myocardium, myotomes, limb buds and allantois. Arrows in (B′) and (M′) indicate expression in the myotome. Arrow in (H′) points to expression in the aorta; arrow in (H″) points to expression in the proepicardium.
At stage 15–20, TGFB3 is expressed in the myocardium and in endothelial cells of the major vessels, including the aorta and vitelline arteries (Figure 4K, arrows), in the myotome, around the eye and in the pharyngeal arches (Figure 4K–M, M′, M″). These expression patterns persist through stage 26. Beginning around stage 20, TGFB3 expression also becomes evident in the limb buds and in the allantois, as well as the forming muscles of the body wall (Figure 4N–O).
Between stages 15–26, TGFBR1 is broadly expressed at low to moderate levels, with higher expression in the myotome, ventral neural tube, nasal placodes and limb buds (Figure 5A–E). At similar stages, TGFBR2 transcripts are detected in all embryonic and extraembryonic vascular endothelial cells and in pharyngeal arch mesoderm (Figure 5F–J). TGFBR2 transcripts are evident throughout the endocardium (Figure 5F, arrow), including regions of the AV canal and outflow tract where some endocardial cells have begun to undergo an epithelial to mesenchymal transition (EMT) to form the cardiac cushion precursors to the valves (Figure 5G, H, H′–H″″). Beginning around stage 18, TGFBR2 expression becomes specifically downregulated in the endocardium where EMT is occurring. Expression is undetectable in the mesenchymal cushion cells. In other embryo regions, TGFBR2 expression is detected in the forming allantois, head mesenchyme, and in the mesoderm between the dermatome and the ectoderm (Figure 5J). Expression is also evident in the ventral wall of the aorta in the region where hematopoietic stem cells arise (Figure 5H, H‴″). From stages 15–26, TGFBR3 transcripts are detected at low to moderate levels in the endocardium and robustly in endothelial cells of the extraembryonic vasculature (figure 5K–O). Expression is also evident in the liver and mesonephros (Figure 5N, arrow).
Figure 5.
mRNA expression of TGFB receptors in HH stage 14–26 chicken embryos. TGFBR1 (A–E) shows widespread moderate expression, with higher levels in the somites, limb buds and endocardium. TGFBR2 (F–J, H′–H″‴) is expressed in all vascular endothelial cells including the endocardium, and in the head mesenchyme, allantois, cells adjacent to the myotome, and in the ventral wall of the aorta in the AGM region. TGFBR3 (K–O) transcripts are detected in the endocardium and robustly in extraembryonic vascular endothelial cells, in the liver and mesonephros. Arrow in (F) indicates robust TGFBR2 expression in the endocardium. Arrow in (N) indicates TGFBR3 expression in the Mesonephros.
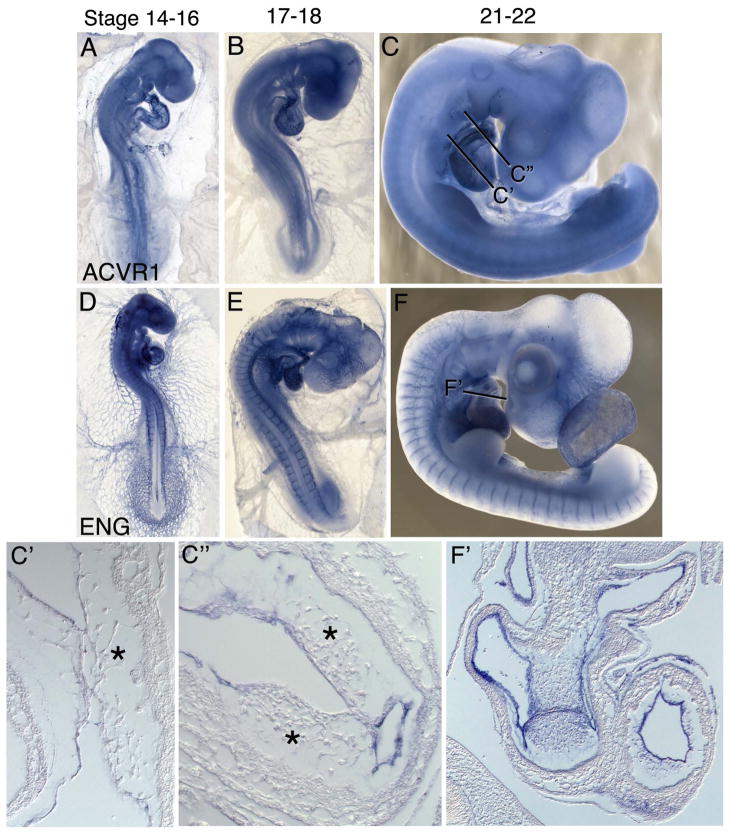
ACVR1 shows broad moderate expression between stages 15–22, with higher transcript levels detected in the endocardium (Figure 6A–C). Within the atrioventricular canal and outflow tract, ACVR1 expression is specifically downregulated in the endocardium and mesenchymal cells (asterisk) at the site of EMT (Figure 6C, C′,C″). Adjacent regions of the endocardium not undergoing EMT retain ACVRI expression. At these stages ENG is strongly expressed in all embryonic and extraembryonic vascular endothelial cells, including throughout the endocardium (Figure 6D–F, F′).
Figure 6.
mRNA expression patterns ACVR1 and ENG in HH stage 15–22 embryos. ACVR1 (A–C, C′, C″) shows low-level broad expression and higher transcript levels in the endocardium. ENG is expressed in all vascular endothelial cells (D–F, F′). Asterisks in (C′) and (C″) indicate cardiac cushion mesenchyme.
Expression Summary
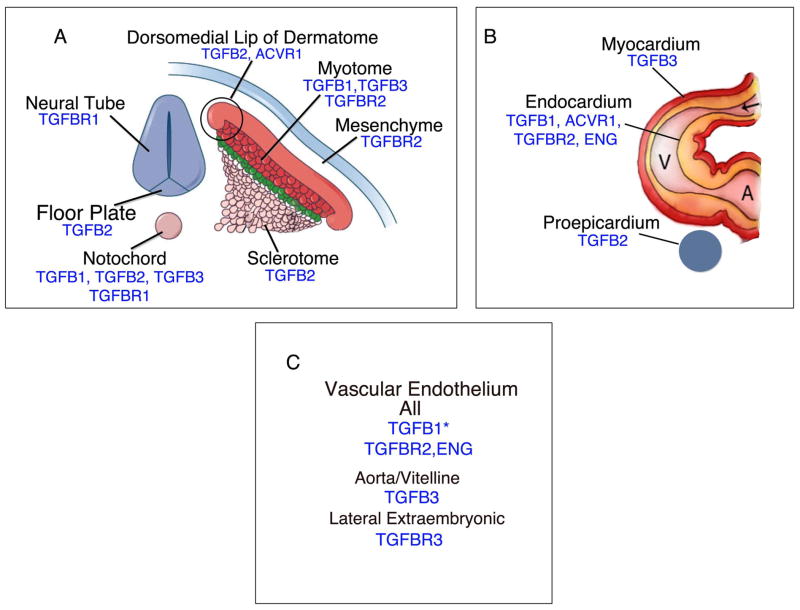
Through the detailed analyses above, embryo regions were identified that show expression of several TGFB ligands and receptors in the same or adjacent tissues (Table 2). Along the embryo axis at HH stages 14–26 (Figure 7A), the ligands TGFB1 and TGFB3 are expressed in the myotomes. TGFB2 is expressed in the DML where cells move from the dermatome to form the epaxial myotome, and in the medial portion of the myotome. TGFB2 is also expressed in the sclerotome. The receptor TGFBR2 is expressed in the myotome, and from stages 15–20 in the mesenchyme between the ectoderm and dermatome. ACVR1 expression was also detected in the DML and in the cells just below it in the myotome. The notochord expresses the three TGFB ligands plus the receptor TGFBR1. The adjacent neural tube floor plate also expresses TGFB2, and the neural tube expresses variable levels of TGFBR1. These expression patterns suggest important functions of TGFB signaling in patterning of these embryonic structures. Additional image are available on the GEISHA chicken gene expression database website at http://geisha.arizona.edu.
Table 2.
TGFB Ligand and Receptor Expression Summary
| ANATOMICAL LOCATION | LIGANDS | RECEPTORS | ||||||
|---|---|---|---|---|---|---|---|---|
| TGFB1 | TGFB2 | TGFB3 | TGFBR1 | TGFBR2 | TGFBR3 | ACVR1 | ENG | |
| Early Embryo | ||||||||
| Area Opaca | 3–7 | |||||||
| Epiblast | 3–7 | 3–6 | 3–6 | 3–7 | ||||
| Primitive Streak | 3–4 | 3–4 | 4–6 | 4–8 | ||||
| Early Mesoderm | 3–7 | 3–7 | 3–6 | 4–6 | 4 | |||
| Early Endoderm | 4–7 | 5–12 | 4 | |||||
| Mesoderm | ||||||||
| Extraembryonic | 4–25 | 3–12 | 7 | 4–26 | 4–25 | |||
| Intermediate | 10 | 8–9 | 9–12 | |||||
| Metanephros | 24 | 15–26 | ||||||
| Lateral | 6–7 | 6–10 | 8 | 4–6 | 7 | 6–12 | 4–8 | |
| Somatic Mesoderm | ||||||||
| Somites--Epithelial | 8–10 | 8–10 | 8–12 | 8–10 | ||||
| Sclerotome | 10–26 | |||||||
| Myotome | 14–25 | 15–26 | 15–25 | 14–25 | ||||
| Dermatome | 14–18 | 15–26 | 14–25 | |||||
| Notochord | 8–20 | 6–26 | 10–12 | 8–12 | 5–8 | |||
| Blood Islands | 6–16 | 8–12 | 5–8 | |||||
| Pharyngeal Arches | 23–26 | 15–25 | 14–26 | |||||
| Head Mesenchyme | 12–26 | 9–12 | 10–26 | |||||
| Aorta | 15–26 | 15–26 | ||||||
| Vascular Endothelium | 9–16 | 14–18 | 10–26 | 8–26 | 8–26 | 9–12 | 10–22 | |
| Vitelline Artery Endothelium | 14–16 | 14–26 | 8–26 | 15–22 | ||||
| Gonadal Ridge | 14–26 | |||||||
| Limb | 20–26 | 15–26 | ||||||
| Chondrogenic Condensations | 14–26 | |||||||
| Heart | ||||||||
| Sinus Venosis | ||||||||
| Endocardium | 10–25 | 15–26 | 10–26 | 15–26 | 10–22 | |||
| Second Heart Field | 7–26 | |||||||
| Myocardium | 8–26 | 8–12 | ||||||
| Outflow Tract | 15–26 | 15–22 | ||||||
| Proepicardium/Epicardium | 14–26 | |||||||
| Ectoderm | ||||||||
| Neural Ectoderm/Neural Tube | 4–12 | 8–10 | 8–26 | 9–12 | ||||
| Non Neural Ectoderm | 10–12 | |||||||
| Neural Crest | 10–12 | 10–12 | ||||||
| Neural Tube Floor Plate | 12–20 | |||||||
| Otic Placode/Ear | 18–26 | |||||||
| Optic Cups | 9–13 | |||||||
| Lens | 16–26 | |||||||
| Retina | 10–12;23–26 | |||||||
| Allantois | 23–26 | 20–26 | 15–26 | |||||
| Endoderm | ||||||||
| Foregut | 10–12 | 9 | ||||||
Expression is shown at the indicated Hamburger-Hamilton stages of development.
Figure 7.
Illustrations showing TGFB ligand and receptor expression along the embryonic axis and body wall (A), in the heart (B), and blood vessels (C). Figure 7A adapted from Figure 11.22 in Gilbert et al (26).
Consistent with the well-documented role of TGFB signaling during cardiovascular development, several TGFB ligands and receptors are expressed in and near the heart (Figure 7B) and in the vascular endothelium (Figure 7C). The TGFB ligands are expressed in strikingly complementary patterns in and near the heart (Figure 4, B″, H″, M″). TGFB1 is localized to the endocardium, TGFB2 is expressed in the proepicardium and forming epicardium (not shown), and TGFB3 is expressed in the myocardium. Although TGFB receptors were not detected in the proepicardium/epicardium or myocardium, the endocardium expresses ACVR1, TGFBR2 and ENG. At the sites of endocardial cushion formation in the AV canal and outflow tract where endocardial cells were undergoing EMT and forming the cushion mesenchyme, ACVR1 and TGFBR2 are downregulated in the endocardium and in cushion mesenchyme cells (Figure 5H‴,H″″; Figure 6C′,C″). The vascular endothelium expresses TGFBR2 and ENG at all stages and TGFB1 until stages 15–17. TGFB3 expression is localized to the aorta and vitelline arteries. Finally, although TGFBR1 and ACVR1 were not detected in many locations showing expression of a Type II and or Type III receptor, prolonged embryo staining revealed that TGFBR1 is broadly expressed at low levels. Alternatively, it is possible that an additional Type I receptor(s) is responsible for transducing TGFβ signaling.
EXPERIMENTAL PROCEDURES
Embryo collection and In situ hybridization
Fertile chicken eggs (HyLine, Iowa; not a commercially available source) were incubated in a humidified incubator at 37.5°C for 0.5 to 5 days. Embryos were collected into chilled chick saline (123 mM NaCl), removed from the vitelline membrane and cleaned of yolk. Extra-embryonic membranes and large body cavities (brain vesicles, atria, allantois, eye) were opened to minimize trapping of the in situ reagents. Embryos were fixed overnight at 4°C in freshly prepared 4% paraformaldehyde. cDNA templates for generating all antisense RNA probes were obtained by RT-PCR using pooled RNA from embryos between HH stages 4–30. Primer sequences were designed based upon the mRNA sequence in the NCBI database. The sequence 5′-AATTAACCCTCACTAAAGG-3, corresponding to the T3 DNA polymerase binding site, was added to the 5′ end of each reverse primer. The following primers were used: TGFB1 (844nt): Forward, 5′-TGCCACTCGCAAACATCTACG-3′, Reverse, 5′-GCAACTCAAACAGGGTCTTAGC. TGFB2 (775nt): Forward, 5′CGGCGATGGAGAAAAATGC-3′, Reverse, ATGTAGTAGAGGATGGTGAGGGC-3′. TGFB3 (743nt): Forward, 5′GGGCGATGGAGAAAAATGC, Reverse, 5′-ATGTAGTAGAGGATGGTGAGGGGC-3′. TGFBR1 (855nt): Forward, 5′-TATGGCGTTACGGGGCACTC-3′, Reverse, 5′TGTTCGTGATAATCTGACACCAACC-3′. TGFBR2 (1026nt): Forward, 5′-GGAAAAGAAGGATGATGGGGG-3′, Reverse, 5′-TCTCCAACACCGTTACAGCGAG-3′. TGFBR3 (703nt): Forward, 5′-GGATACCTACAACCAAAAAGAGCG-3′, Reverse, 5′-TTGACAGGGCTACATCAGCACTGC-3′. ACVR1 (838nt): 5′-GCTTGTGGAGTGTGTAGGAAAGGG-3′, Reverse, GGCTGTTAGTCTTGCTGATGGATTC-3′. ENG (991nt): Forward, CCCAGACAGCAGCAAAACAATC-3′, Reverse, 5′-CCTTCACTTCCAAAACCTTCTCG-3′. Embryo processing, antisense RNA probe preparation and whole mount in situ hybridizations were performed as described (25). A detailed ISH protocol is available for download at http://geisha.arizona.edu.
Bullet Points.
Expression patterns of the TGFB ligands and receptors were examined in chicken embryos during the first four days of development.
TGFB ligands and receptors show dynamic and frequently overlapping expression patterns in numerous embryonic cell layers and structures.
Integrating expression information identifies combinations of ligands and receptors that are involved in specific developmental processes including somitogenesis, cardiogenesis and vasculogenesis.
Acknowledgments
Grant Sponsor: NIH P41HD064559
We thank Tom Doetschman and Mohamad Azhar for helpful discussions. This study was supported by NIH grant HD064559 to PBA.
Abbreviations
- DML
Dorsomedial lip of the dermatome
- EMT
Epithelial-mesenchymal transition
- TGFB
Transforming Growth Factor Beta
References
- 1.Conway SJ, Doetschman T, Azhar M. The inter-relationship of periostin, TGF beta, and BMP in heart valve development and valvular heart diseases. TheScientificWorldJournal. 2011;11:1509–1524. doi: 10.1100/tsw.2011.132. [DOI] [PMC free article] [PubMed] [Google Scholar]
- 2.Massague J. TGFbeta signalling in context. Nat Rev Mol Cell Biol. 2012;13:616–630. doi: 10.1038/nrm3434. [DOI] [PMC free article] [PubMed] [Google Scholar]
- 3.Doetschman T, Barnett JV, Runyan RB, Camenisch TD, Heimark RL, Granzier HL, Conway SJ, Azhar M. Transforming growth factor beta signaling in adult cardiovascular diseases and repair. Cell Tissue Res. 2012;347:203–223. doi: 10.1007/s00441-011-1241-3. [DOI] [PMC free article] [PubMed] [Google Scholar]
- 4.Azhar M, Runyan RB, Gard C, Sanford LP, Miller ML, Andringa A, Pawlowski S, Rajan S, Doetschman T. Ligand-specific function of transforming growth factor beta in epithelial-mesenchymal transition in heart development. Dev Dyn. 2009;238:431–442. doi: 10.1002/dvdy.21854. [DOI] [PMC free article] [PubMed] [Google Scholar]
- 5.Daly AC, Randall RA, Hill CS. Transforming growth factor beta-induced Smad1/5 phosphorylation in epithelial cells is mediated by novel receptor complexes and is essential for anchorage-independent growth. Mol Cell Biol. 2008;28:6889–6902. doi: 10.1128/MCB.01192-08. [DOI] [PMC free article] [PubMed] [Google Scholar]
- 6.Lopez-Casillas F, Wrana JL, Massague J. Betaglycan presents ligand to the TGF beta signaling receptor. Cell. 1993;73:1435–1444. doi: 10.1016/0092-8674(93)90368-z. [DOI] [PubMed] [Google Scholar]
- 7.Cheifetz S, Bellon T, Cales C, Vera S, Bernabeu C, Massague J, Letarte M. Endoglin is a component of the transforming growth factor-beta receptor system in human endothelial cells. J Biol Chem. 1992;267:19027–19030. [PubMed] [Google Scholar]
- 8.Shull MM, Ormsby I, Kier AB, Pawlowski S, Diebold RJ, Yin M, Allen R, Sidman C, Proetzel G, Calvin D, et al. Targeted disruption of the mouse transforming growth factor-beta 1 gene results in multifocal inflammatory disease. Nature. 1992;359:693–699. doi: 10.1038/359693a0. [DOI] [PMC free article] [PubMed] [Google Scholar]
- 9.Martin JS, Dickson MC, Cousins FM, Kulkarni AB, Karlsson S, Akhurst RJ. Analysis of homozygous TGF beta 1 null mouse embryos demonstrates defects in yolk sac vasculogenesis and hematopoiesis. Ann N Y Acad Sci. 1995;752:300–308. doi: 10.1111/j.1749-6632.1995.tb17439.x. [DOI] [PubMed] [Google Scholar]
- 10.Oshima M, Oshima H, Taketo MM. TGF-beta receptor type II deficiency results in defects of yolk sac hematopoiesis and vasculogenesis. Dev Biol. 1996;179:297–302. doi: 10.1006/dbio.1996.0259. [DOI] [PubMed] [Google Scholar]
- 11.James JM, Nalbandian A, Mukouyama YS. TGFbeta signaling is required for sprouting lymphangiogenesis during lymphatic network development in the skin. Development. 2013;140:3903–3914. doi: 10.1242/dev.095026. [DOI] [PMC free article] [PubMed] [Google Scholar]
- 12.Sanford LP, Ormsby I, Gittenberger-de GAC, Sariola H, Friedman R, Boivin GP, Cardell EL, Doetschman T. TGFbeta2 knockout mice have multiple developmental defects that are non-overlapping with other TGFbeta knockout phenotypes. Development. 1997;124:2659–2670. doi: 10.1242/dev.124.13.2659. [DOI] [PMC free article] [PubMed] [Google Scholar]
- 13.Bartram U, Molin DG, Wisse LJ, Mohamad A, Sanford LP, Doetschman T, Speer CP, Poelmann RE, Gittenberger-de Groot AC. Double-outlet right ventricle and overriding tricuspid valve reflect disturbances of looping, myocardialization, endocardial cushion differentiation, and apoptosis in TGF-beta(2)-knockout mice. Circulation. 2001;103:2745–2752. doi: 10.1161/01.cir.103.22.2745. [DOI] [PubMed] [Google Scholar]
- 14.Azhar M, Schultz JE, Grupp I, Dorn GW, Meneton P, Molin DG, Gittenberger-de Groot AC, Doetschman T. Transforming growth factor beta in cardiovascular development and function. Cytokine Growth Factor Rev. 2003;14:391–407. doi: 10.1016/s1359-6101(03)00044-3. [DOI] [PMC free article] [PubMed] [Google Scholar]
- 15.Proetzel G, Pawlowski SA, Wiles MV, Yin M, Boivin GP, Howles PN, Ding J, Ferguson MW, Doetschman T. Transforming growth factor-beta 3 is required for secondary palate fusion. Nat Genet. 1995;11:409–414. doi: 10.1038/ng1295-409. [DOI] [PMC free article] [PubMed] [Google Scholar]
- 16.Kaartinen V, Voncken JW, Shuler C, Warburton D, Bu D, Heisterkamp N, Groffen J. Abnormal lung development and cleft palate in mice lacking TGF-beta 3 indicates defects of epithelial-mesenchymal interaction. Nat Genet. 1995;11:415–421. doi: 10.1038/ng1295-415. [DOI] [PubMed] [Google Scholar]
- 17.Stenvers KL, Tursky ML, Harder KW, Kountouri N, Amatayakul-Chantler S, Grail D, Small C, Weinberg RA, Sizeland AM, Zhu HJ. Heart and liver defects and reduced transforming growth factor beta2 sensitivity in transforming growth factor beta type III receptor-deficient embryos. Mol Cell Biol. 2003;23:4371–4385. doi: 10.1128/MCB.23.12.4371-4385.2003. [DOI] [PMC free article] [PubMed] [Google Scholar]
- 18.Compton LA, Potash DA, Brown CB, Barnett JV. Coronary vessel development is dependent on the type III transforming growth factor beta receptor. Circ Res. 2007;101:784–791. doi: 10.1161/CIRCRESAHA.107.152082. [DOI] [PubMed] [Google Scholar]
- 19.Schmid P, Cox D, Bilbe G, Maier R, McMaster GK. Differential expression of TGF beta 1, beta 2 and beta 3 genes during mouse embryogenesis. Development. 1991;111:117–130. doi: 10.1242/dev.111.1.117. [DOI] [PubMed] [Google Scholar]
- 20.Millan FA, Denhez F, Kondaiah P, Akhurst RJ. Embryonic gene expression patterns of TGF beta 1, beta 2 and beta 3 suggest different developmental functions in vivo. Development. 1991;111:131–143. doi: 10.1242/dev.111.1.131. [DOI] [PubMed] [Google Scholar]
- 21.Pelton RW, Dickinson ME, Moses HL, Hogan BL. In situ hybridization analysis of TGF beta 3 RNA expression during mouse development: comparative studies with TGF beta 1 and beta 2. Development. 1990;110:609–620. doi: 10.1242/dev.110.2.609. [DOI] [PubMed] [Google Scholar]
- 22.Dickson MC, Slager HG, Duffie E, Mummery CL, Akhurst RJ. RNA and protein localisations of TGF beta 2 in the early mouse embryo suggest an involvement in cardiac development. Development. 1993;117:625–639. doi: 10.1242/dev.117.2.625. [DOI] [PubMed] [Google Scholar]
- 23.Alev C, McIntyre BA, Ota K, Sheng G. Dynamic expression of Endoglin, a TGF-beta co-receptor, during pre-circulation vascular development in chick. Int J Dev Biol. 2010;54:737–742. doi: 10.1387/ijdb.092962ca. [DOI] [PubMed] [Google Scholar]
- 24.Yamagishi T, Ando K, Nakamura H, Nakajima Y. Expression of the Tgfbeta2 gene during chick embryogenesis. Anat Rec (Hoboken) 2012;295:257–267. doi: 10.1002/ar.22400. [DOI] [PubMed] [Google Scholar]
- 25.Antin PB, Pier M, Sesepasara T, Yatskievych TA, Darnell DK. Embryonic expression of the chicken Kruppel-like (KLF) transcription factor gene family. Dev Dyn. 2010;239:1879–1887. doi: 10.1002/dvdy.22318. [DOI] [PMC free article] [PubMed] [Google Scholar]
- 26.Gilbert S. Developmental Biology. 9. Sinaur Associates; Sundeland, MA: 2010. [Google Scholar]
- 27.Burt DW, Carre W, Fell M, Law AS, Antin PB, Maglott DR, Weber JA, Schmidt CJ, Burgess SC, McCarthy FM. The Chicken Gene Nomenclature Committee report. BMC genomics. 2009;10(Suppl 2):S5. doi: 10.1186/1471-2164-10-S2-S5. [DOI] [PMC free article] [PubMed] [Google Scholar]


