

Abstract
Fluorescence anisotropy in the near-infrared (NIR) spectral range is challenging because of the lack of appropriate NIR fluorescent labels. We have evaluated polymethine fluorescent dyes to identify a leading candidate for NIR anisotropy applications. The NIR dye LS601 demonstrated low fluorescence anisotropy values (r) as a result of its relatively long fluorescent lifetime 1.3 ns. The r value of LS601 unbound and coupled to biological macromolecules was found to have a sufficient dynamic range from 0.24 to 0.37, demonstrating the feasibility of fluorescence anisotropy in the NIR. The viability of fluorescence anisotropy using a NIR label was demonstrated by characterization of dye-protein conjugates. These results open the door to a number of applications in drug discovery, fluorescence anisotropy imaging and contrast agent development.
Keywords: conjugation, cyanine dyes, fluorescence anisotropy, fluorescence lifetime, near-infrared region
1. Introduction
Fluorescence anisotropy is an optical technique widely utilized in biochemistry and drug discovery.[1] The popularity of fluorescence anisotropy in biomedical research stems from several well-recognized factors including homogeneity of assays, insensitivity to concentration artifacts, absence of radioactivity, and automation of measurements. Anisotropy (r), measured according to Equation (1), provides unique information describing the dynamic behavior of molecules, including molecular orientation, energy migration, and rotational diffusion:
| (1) |
where I∥ is the intensity of the fluorescence emission parallel to the vertically polarized light and I⊥ is the intensity of the fluorescence emission perpendicular to the vertically polarized light.
Due to the high versatility of fluorescence anisotropy, and the availability of highly automated polarizers, stable detectors and excitation sources, the method has found widespread uses in high-throughput screening of drug candidates,[2, 3] the evaluation of protein–protein and protein–DNA interactions,[3–6] protease activities,[7–10] cell signaling pathways,[11, 12] probing of the cellular microenvironment,[13, 14] 2D and 3D imaging,[15–19] and qualitative control of conjugation.[20] However, the vast majority of fluorescent probes utilized in fluorescence polarization techniques have excitation and emission only in the visible range 400–600 nm.[21, 22] Fluorophores with longer wavelengths have been reported, but largely limited to the Cy5 class of probes emitting in the red part of the spectra at 600–700 nm.[12,23, 24]
Near-infrared (NIR) probes which absorb and emit light within the range from 700–900 nm have several benefits in biological studies, including reduced interference from endogenous fluorophores and lowered hindrance from light scattering encountered with screening.[25] Despite these obvious benefits, no significant efforts have been made to utilize these probes in polarization assays.
Such low interest is attributable to the less than ideal anisotropy behaviour of NIR dyes stemming from the fluorophores elongated structures and short fluorescence lifetime (below 1.0 ns). These factors lead to large anisotropy for a free dye (above 0.2 units),[26] significantly reducing the dynamic range and resulting in a small assay window.[27] Furthermore, commercially available NIR probes, such as Cy7 and IR800CW, have relatively long linkers. This leads to incomplete immobilization of the fluorescent probe on the macromolecule of interest and, therefore, to higher local mobility—“wobbling”—of the fluorophore (“propeller effect”).[1] Fluorophore “wobbling” contributes to the dynamic disorder of the complex, complicates polarization assay analysis and requires introducing additional parameters to anisotropy calculations[28] which are difficult to obtain experimentally.
To address these problems we have evaluated a number of NIR dyes, both commercially available and synthesized in our laboratory, with the ultimate goals of identifying a dye for fluorescence anisotropy in the NIR spectral range and demonstrating the feasibility of NIR anisotropy as an analytical tool. Through our study we have selected a dye with low anisotropy in a free (non-bound) state. The utility of fluorescence anisotropy has been demonstrated, further verifying conjugation between the dye and proteins of interest and showing the potential of NIR anisotropy in analytical applications.
2. Results and Discussion
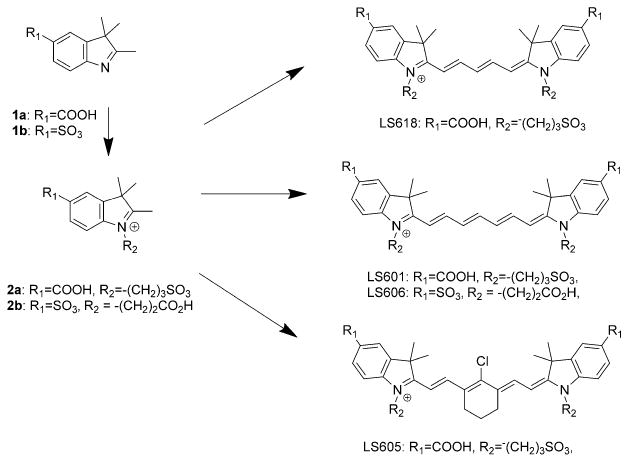
The primary goal of this study was to identify a dye for fluorescence anisotropy in the NIR spectral range while concurrently demonstrating the feasibility of NIR anisotropy as an analytical tool. This requires an understanding of general structure–activity relationships between the NIR dyes' structures and their corresponding anisotropy values. The investigated dyes were structurally similar (Figure 1), sharing a polymethine platform which has proven to be an excellent scaffold for the synthesis of a large number of fluorescence probes with tuned optical, chemical and biological properties.[29–33]
Figure 1.

NIR dyes used in this study for fluorescence anisotropy screening.
The synthesized compounds were homologous to previously published dyes,[34, 35] with some important structural changes to improve their water solubility. Specifically, we replaced butane sulfonates with shorter and more hydrophilic propane sulfonates to prepare the dyes LS601, LS605 and LS618. This change required an optimization of the synthetic procedure to improve yield and minimize difficulties associated with its ensuing purification of the product. In our general procedure (see Scheme 1 in the Experimental Section), the corresponding indole was pre-activated (such as 2a for the synthesis of LS601, Scheme 2 in the Experimental Section) with sodium acetate providing intermediate 2a'. The Vilsmeier–Haack reagent (for example, acetylated aniline hydrochloride 3 prepared according to ref. [36]) was subsequently added to the reaction mixture in refluxed methanol, providing excellent yield, up to 98%, of the product. Having this modified procedure in hand, we were able to synthesize dyes in pure form (>95 area%, by LC).
Scheme 1.
General synthesis of NIR polymethine dyes.
Scheme 2.

Synthesis of LS601.
2.1. Fluorescence Anisotropy Assay Window of NIR Dyes
The representative dyes, synthesized in our lab and obtained from commercial sources, were selected from three categories: i) indole-pentamethines (LS618), ii) indole-heptamethines (HITC, DTTC, LS601, LS605, LS606) and iii) benzeindole-heptamethines (cypate and ADS800AT). The major difference between the studied categories of dyes, and critical for anisotropy measurements, was the length of the electronic conjugation in the fluorophore. The first group is exemplified by LS618, which has the shortest electron conjugation among the studied dyes, with absorption/emission in the far-red range of the spectra (abs/em. 663/684 nm, Table 1). Extending the chromophore to a heptamethine skeleton led to a bathochromic shift of ∼100 nm (abs/em. 755/782 in LS601) in accordance to the particle-in-a-box principle (Kuhn rule).[37] Replacement of the indole of LS601 with benz[e]indole (as in cypate and ADS800AT) further increases conjugation, leading to longer wavelengths of absorption and emission (for cypate 796/817 nm) by ∼30 nm. The six-member ring in the chain and a weakly electron-withdrawing chlorine at the central carbon of the cyanine chain (meso position) caused a 40 nm shift toward a longer wavelength, as previously observed for a variety of heptamethine dyes.[38] The effect of either electron-donating/withdrawing substituents on the indole rings para to nitrogen had negligible impact on the dyes' optical properties, providing almost identical absorption and emission spectra (compare LS601 with carboxylic groups and LS606 with sulfonates).
Table 1.
Photophysical properties of NIR and red-emitting dyes, and anisotropy measurements.
| Dye | MW [g mol−1][a] | λabs/λem [nm][b] | ε [m−1cm−1][b] | Φ[b] | τ [ns][b] | χ2[b] | rmin [e] |
|---|---|---|---|---|---|---|---|
| LS618 | 686 | 663/684 | 182000 | 0.17 | 1.51[d] | 1.13 | 0.140 ±0.002 |
| HITC | 536 | 750/781 | 141000 | 0.47 | 1.35 | 1.28 | 0.190 ±0.020 |
| LS606 | 684 | 766/799 | 89000 | 0.30 | 1.39 | 1.07 | 0.242 ±0.006 |
| LS601 | 712 | 769/800 | 161000 | 0.20 | 1.30 | 1.08 | 0.244 ±0.020 |
| DTTCP | 596 | 771/800 | 197000 | 0.64 | 1.49 | 1.11 | 0.186±0.010[f] |
| Cypate | 625 | 796/817 | 237000 | 0.13 | 0.87 | 1.09 | 0.316±0.005[f] |
| LS605 | 786 | 809/827 | 169000 | 0.05 | 0.86 | 1.07 | 0.303 ±0.008 |
| ADS800AT | 656 | 827/856 | 203000 | 0.02 | 0.61[d] | 1.08 | 0.286 ±0.029[f] |
MW of fluorophores only, with no counter ions.
λabs: Absorption maximum, λem: emission maximum, ε: molar absorptivity at the λabs, Φ: fluorescence quantum yield, all measured in DMSO;
τ: fluorescence lifetime, χ2: goodness of fit, measured in DMSO for a two-exponential fit, unless indicated, the major component fraction contribution >96%.
From three-exponential fit: LS618 τ1 = 1.06 ns (33%), τ2 = 1.73 ns (66%); ADS800AT: τ1 = 0.53 ns (85%), τ2 = 1.15 (13%).
rmin: fluorescence anisotropy of free dyes measured in water, unless otherwise indicated.
Recorded in 20% DMSO/water because of limited solubility in pure water.
The fluorescence lifetime of the studied dyes followed a generally observed trend, decreasing from 1.5 ns for dyes with shorter conjugation (LS618) to less than 0.6 ns for those with longer wavelengths. The trend has been attributed to a higher probability of non-radiative relaxation from the excited to the ground state via the conical intersection mechanism,[39,40] which is facilitated by a low gap between two states in the NIR range. This phenomenon, known as the low-energy-gap law,[41–43] states that radiationless transitions at longer wavelengths within the same class of dyes increases due to vibrational overlaps between the ground and excited states resulting in the decrease in quantum yield and fluorescence lifetime. The decrease of fluorescence lifetime can be considered as a rationale for the increase of free fluorescence anisotropy (rmin) of NIR dyes, since fluorescence anisotropy is inversely proportional to the rate of fluorophore rotational correlation time in solution as given by the Perrin relationship [Eq. (2)]. This relationship is illustrated by Figure 2, which shows a simulation of free anisotropy as a function of fluorescence lifetime for three different molecular rotations: fast (θ = 1 ns), medium (θ = 10 ns) and slow (θ = 50 ns). Clearly, fluorescence dyes with short fluorescence lifetimes (<1.5 ns) are expected to demonstrate larger free anisotropy values than molecules with significantly longer lifetimes:
Figure 2.
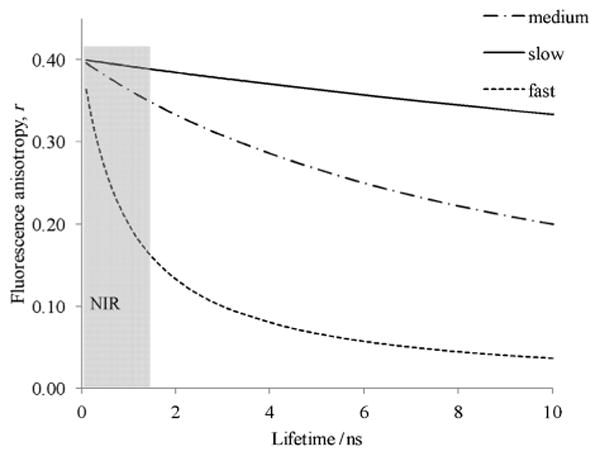
Simulation of fluorescence anisotropy as a function of fluorescence lifetime from Equation (2). Anisotropies of fluorophores with fast (θ = 1 ns), medium (θ = 10 ns) and slow (θ = 50 ns) rotational correlation times are shown. The limiting anisotropy was set to the theoretical maximum value for random movement r0 = 0.4. The grey area corresponds to typical NIR dyes with short fluorescence lifetimes (< 1.5 ns).
| (2) |
where r0 is the limiting anisotropy (= 0.4 as an ensemble average for one-photon excitation[44] for the ideal fluorophore), τ is the fluorescence lifetime, and θ is the rotational correlation time of the fluorophore.
A range or fluorescence-anisotropy values (assay window) of the dyes indicate whether they might be suitable in anisotropy applications. The upper limit, known as the limiting anisotropy r0, is measured in the immobile state, usually in glycerol at 0°C. The theoretical maximum of this value for one-photon excitation does not depend on the nature of the fluorophore and is equal to 0.4.[1] The lower limit of the anisotropy value, rmin, corresponds to dyes in the non-bound form and depends on the nature of the dye, all other conditions being equal. Larger values for rmin is the major limitation for the utility of NIR dyes in such assays, and therefore the preference should be given to dyes with low initial anisotropy. Experimentally measured rmin of the studied NIR dyes in aqueous solutions [either in pure water or in 20% DMSO/water (DMSO: dimethyl sulfoxide) to prevent aggregation] were all ≥0.17 (Table 1), much higher than those of visible dyes such as fluorescein (rmin = 0.021).[45] Such relatively high rmin narrows the assay window and explains low previous interest in NIR dyes with respect to anisotropy studies.
2.2. Dye LS601 as a NIR Fluorescent Anisotropy Label
Herein, we demonstrate that properly selected NIR dyes have the potential to be successfully utilized in anisotropy studies. To create a suitable NIR fluorophore for anisotropy applications, three criteria must be met: i) the fluorescence lifetime of the NIR dye must allow for appreciable rotation to provide a reasonable anisotropy change; ii) the dye must be conjugated such that local probe mobility is minimized; and iii) the dye must undergo facile conjugation under conditions appropriate for attachment to biologically relevant macromolecules (in aqueous buffers). In this regard, DTTCP and LS606, with relatively long fluorescence lifetimes might not be suitable, as the dye is either not functionalizable (DTTCP) or is expected to provide a considerable rotation “propeller effect” due to the presence of a flexible chain between the fluorophore and the macromolecule of interest (LS606).
LS601 seems to satisfy all three criteria and presents itself as an excellent label for NIR fluorescence anisotropy. Compared to benzindole dyes, LS601 showed an appreciable fluorescence lifetime and relatively low rmin value in the non-bound form. The anisotropy of the dye was independent of the excitation and emission wavelength (Figure 3), providing additional benefits such as flexibility in measurements. The presence of the carboxylic groups allowed for synthesis of the NHS ester in high yield. The placement of the activatable (via NHS ester) carboxylic acid functionality as part of the dyes' core limited the degree of freedom and ensured minimal local motion. In addition, the presence of two sulfate and carboxylic groups rendered LS601 highly water soluble, presenting a significant advantage for labelling solvent-sensitive biological macromolecules.
Figure 3.
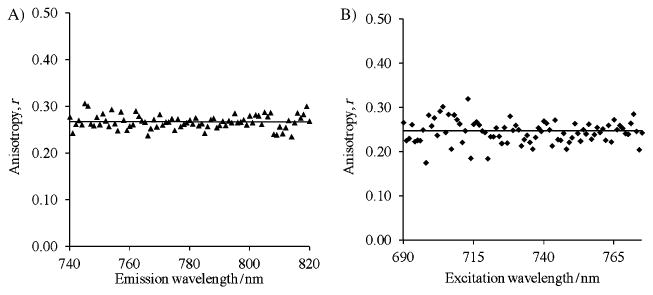
Fluorescence anisotropy of LS601 in water at 20°C: A) Fluorescence anisotropy emission scan 740–820 nm, ex. 710 nm and B) fluorescence anisotropy excitation scan 690–785 nm, em. 800 nm.. The graphs show that the fluorescence anisotropy of LS601 is independent of the wavelength of excitation and emission.
2.3. Application of NIR Anisotropy for Quality Control of Conjugation to Macromolecules
We applied anisotropy to analyze the products of conjugation reactions between a NIR dye and macromolecules. NIR labels conjugated to polypeptides, antibodies and nanoparticles are often used in optical imaging of live animals due to the high penetration of NIR photons through biological tissue accompanied by low levels of scattering.[46]
An activated NHS form of LS601 was conjugated to lysozyme (Lz), bovine serum albumin (BSA) and immunoglobulin G (IgG)—selected because of their varying sizes. Non-activated highly hydrophilic dyes are generally not bound by proteins as we have demonstrated with other hydrophilic dyes and BSA.[47] In addition, binding of NIR dyes to protein binding sites typically leads to displacement of the absorption maximum as a result of the change in the microenvironment,[30, 48] which has not been observed in this study (not shown).
The conjugation of LS601 to proteins was confirmed by sodium dodecyl sulfate polyacrylamide gel electrophoresis (SDS-PAGE, Figure 4). Free dyes LS601 and LS601-NHS appear near 1 kDa (the bottom of the gel), as expected. Single-chain protein conjugates, such as BSA (Figure 4A) and lysozyme (Figure 4B) showed bands corresponding to the appropriate molecular weight. In contrast, the multichain protein IgG (Figure 4A) showed bands corresponding to the heavy (MW ∼ 50000) and light chains (MW ∼ 25000), and a pattern often seen due to partially reduced IgG.[49]
Figure 4.

SDS-PAGE of LS601–protein conjugates; ex/em: 769/780. A) From left to right: LS601–BSA conjugate (two lanes), LS601–NHS ester, LS601, fluorescent ladder, LS601–NHS ester, LS601-IgG (two lanes). B) From left to right: fluorescent ladder, LS601–lysozyme fraction 1, LS601–lysozyme fraction 2.
As expected, conjugation of the dye to macromolecules caused an appreciable increase in r (Figure 5). Interestingly, the anisotropy value of the largest conjugate IgG–LS601 was similar to that of the smallest conjugate lysozyme–LS601, although the classic theory of fluorescence anisotropy predicts the increase of r with the increase of the molecular weight of spherically shaped macromolecules. The observed non-classical relationship between anisotropy and molecular weight can be explained by the difference in rotation for irregularly shaped proteins.[50]
Figure 5.

Average fluorescence anisotropy values for LS601–protein conjugates in water 20°C and glycerol 0°C; em/ex: 740/780 nm. The error bars represent standard deviation over eight measurements.
Having established that fluorescence anisotropy undergoes noticeable change upon conjugation of LS601 to proteins, we utilized this method as an analytical tool to verify the completeness of the conjugation reaction and to validate the purity of the product. Since the anisotropy function is directly additive,[1] any presence of a free dye should decrease the anisotropy value. Indeed, the anisotropy of the second fraction in LS601–lysozyme after column purification provided a considerably lower value (r = 0.28) than the first fraction (r = 0.31). The lower anisotropy was attributed to the presence of the free dye, which was validated by SDS-PAGE, showing a more intense band corresponding to the free dye in fraction 2 as compared to fraction 1 (Figure 4B). These experiments clearly demonstrated the feasibility of NIR fluorescence anisotropy as a valuable tool in biochemical analysis.
Experimental Section
Materials
The solvents DMSO (spectrophotometric grade) and high-purity water (18.2 MΩ) were used throughout the study. Bovine serum albumin (BSA, grade agarose gel electrophoresis, 99%), immunoglobulin G (IgG), lysozymes (Lz) were purchased from commercial sources. The dyes HITC (Exiton), ICG (Sigma–Aldrich), DTTC perchlorate (DTTCP, Sigma–Aldrich), and ADS800AT (American Dye Source Inc.) were used without purification. The NIR dye cypate was prepared as reported previously.[31,51,52] LS601, LS605, LS606, and LS618 and the conjugates of BSA–LS601, IgG–LS601 and Lysozyme–LS601, were synthesized, purified, and characterized (see Synthesis subsection).
Optical Measurements
UV/Vis spectra of the samples were recorded on a Beckman Coulter DU 640 UV/Vis spectrophotometer. Steady-state fluorescence spectra, fluorescence lifetime and anisotropy were recorded on a Fluorolog-3 spectrofluorometer (Horiba Jobin Yvon, Inc.). The photophysical data (steady-state absorption, fluorescence) and lifetime were obtained in DMSO and water. The fluorescence quantum yields of the samples were measured using indocyanine green (ICG) as a standard.[53] The fluorescence lifetime of the dyes was determined using the time-correlated single photon counting (TCSPC) technique with a NanoLed 700 or 773 nm excitation source, as described previously.[30]
Fluorescence Anisotropy
The study was conducted in L-format with automated Glan-Thompson polarizing prisms controlled by the FluorEssence software (Horiba). The anisotropy values for each dye and dye conjugate were determined at relatively low concentrations with absorption below 0.2 a.u. to avoid aggregation of the dye or agglomeration of the proteins. For single-point measurements, the excitation was set 10–15 nm below the absorption maxima, and the emission 10–15 nm above the fluorescence maxima. Slits were set to 5 nm and integrating time to 0.5 sec. Each single-point measurement was conducted in quadruplicates at T = 20°C in 1×1 cm2 quartz cuvettes using a temperature-controlled cuvette holder in conjunction with a circulating water bath. The alignment of the polarizers was checked daily by recording the anisotropy of a Ludox-40 (Sigma–Aldrich) suspension in water (ex/em. 750/750 nm). Ideal alignment of the instrument suggests the anisotropy degree of this suspension is close to 1.0. The measured anisotropy of Ludox in our experiments was consistently > 0.960, with a standard deviation σ < 0.03, indicating that accurate polarization readings can be obtained using the spectrophotometer in the NIR range. The individual components IVV, IHH, IVH and IHV were collected in quadruplicates for each sample, and the anisotropy of the sample was calculated as defined in Equation (3). Anisotropy excitation spectra and emission spectra were recorded with the parameters indicated in the text.
| (3) |
where IVV and IHH are the intensities of the fluorescence emission parallel to the vertically and horizontally polarized light and IVH and IHV are the intensities the fluorescence emission perpendicular to the vertically polarized light.
Synthesis
2,3,3-Trimethyl-3H-indole-5-carboxylic acid 1a
We added 4-hydrazinobenzoic acid (30 mmol), sodium acetate (60 mmol), and isopropylmethyl ketone (43 mmol) to glacial acetic acid (30 mL) (Scheme 1). The mixture was stirred at room temperature for 30 min and then heated at reflux for 5 h. After cooling to room temperature, the solvent was removed under vacuum, and methanol (2 mL) was added to the residue. The redissolved residue was triturated with water (30 mL) to give 1a as a yellow/brown solid. Yield: 3.33 g, 55%. 1HNMR (CDCl3, 400 MHz): δ = 8.12–8.13 (d, 1H, J = 10.44 Hz), 8.03 (s, 1H), 7.61–7.63 (d, 1H, J = 8.60 Hz), 2.35 (s, 3H), 1.35 ppm (s, 6H).
2,3,3-Trimethyl-3H-indole-5-sulfonic acid 1b
was prepared as a potassium salt according to the ref. [54].
3-(5-Carboxy-2,3,3-trimethyl-3H-indol-1-ium-1-yl)propane-1-sul-fonate 2a
The indole 1a (5.0 mmol) and 1,3-propanesultone (7.6 mmol) were suspended in 1,2-dichlorobenzene (8 mL) and heated with stirring at 110°C with a closed teflon cap for 24 h. The mixture was cooled to room temperature, ether was added and the precipitate collected by filtration and washed with ether to give 2a as a brown/yellow solid which was used without further purification. Yield: 0.91 g, 56%.
3-(2,3,3-Trimethyl-5-sulfo-3H-indol-1-ium-1-yl)propanoate 2b
The indole 1b (5.0 mmol) and 3-bromopropionic acid (7.6 mmol) were suspended in 1,2-dichlorobenzene (8 mL) and heated with stirring at 110°C with a closed teflon cap for 24 h. The mixture was cooled to room temperature, ether was added and the precipitate collected by filtration and washed with ether to give 2a as a yellow/brown solid which was used without further purification. Yield: 0.27 g, 78%.
General Synthesis of NIR Dyes
A solution of acetic anhydride (0.057 mL) in methylene chloride (DCM, 0.5 mL) was added dropwise to a suspension of the appropriate aniline hydrochloride (0.29 mmol) and N,N-diisopropylethylamine (DIEA, 0.11 mL) in DCM (2 mL) at 0°C (Scheme 1). The mixture was allowed to react at room temperature with stirring for 3 h. Subsequently, a solution of 2 (0.61 mmol) and sodium acetate (0.125 g) was prepared in methanol (8 mL), stirred for 30 min, and left at room temperature for 2.5 h. The aniline solution was concentrated, dissolved in methanol (1.0 mL) and added slowly to the refluxing solution of indole. The reaction mixture was refluxed for 24 h, cooled and precipitated with ether. Precipitation from methanol with ether was repeated three times to give the product as a powder.
LS601
Indolium 2a was reacted with N-(5-anilino-2–4-pentadienylidene)aniline hydrochloride (Sigma–Aldrich) according to the General Synthesis of NIR dyes to give the green powder (98% yield) (Scheme 2). 1HNMR (600 MHz, [D6]DMSO): δ = 8.01 (s, 2H), 7.94 (d, J = 8.2, 2H), 7.89 (m, 2H), 7.71 (dd, J = 17.2, 8.9, 1H), 7.38 (d, J = 7.8, 2H), 6.52 (m, J = 21.7, 11.5, 4H), 4.27–4.19 (m, 4H), 2.58 (t, J = 6.9, 4H), 2.03–1.96 (m, 4H), 1.64 ppm (s, 12H). ESI-MS m/z: 713 [M+].
LS605
Indolium 2a was reacted with N-[(3-(anilinomethylene)-2-chloro-1-cyclohexen-1-yl)methylene]-aniline monohydrochloride (Sigma–Aldrich) according to the General Synthesis of NIR dyes to give a green solid with 29% yield. 1HNMR (600 MHz, [D6]DMSO) δ = 8.27 (d, J = 14.2, 2H), 8.07 (d, J = 1.5, 2H), 7.97 (d, J = 1.6, 2H), 7.51 (d, J = 8.4, 2H), 6.60 (d, J = 13.8, 2H), 4.44–4.34 (m, 4H), 2.58 (d, J = 6.7, 4H), 2.04 (dt, J = 14.0, 6.8, 4H), 1.70 ppm (s, 12H). ESI-MS m/z: 788 [M+].
LS606
Indolium 2b was reacted with N-(5-anilino-2-4-pentadienylidene)aniline hydrochloride according to the General Synthesis of NIR dyes to give with 30% yield as a green solid. 1HNMR (600 MHz, [D6]DMSO): δ = 7.85 (t, J = 13.0, 2H), 7.70 (s, 2H), 7.67 (d, J = 21.0, 1H), 7.61 (d, J = 8.4, 2H), 7.27 (d, J = 8.3, 2H), 6.51 (t, J = 12.5, 2H), 6.35 (d, J = 13.7, 2H), 4.27–4.13 (m, 4H), 2.31 (t, J = 7.1, 4H), 1.60 ppm (s, 12H).
LS618
Indolium 2a was reacted with malonaldehyde bis(phenylimine) monohydrochloride (Sigma–Aldrich) according to the General Synthesis of NIR dyes to give a product with 95% yield as a green. 1HNMR (600 MHz, [D6]DMSO): δ = 8.36 (t, J = 12.8, 2H), 8.03 (s, 2H), 7.93 (d, J = 8.2, 2H), 7.35 (d, J = 8.2, 2H), 6.55 (t, J = 12.3, 1H), 6.43 (d, J = 13.4, 2H), 4.32–4.21 (m, 4H), 2.03–1.96 (m, 4H), 1.68 ppm (s, 12H). ESI-MS m/z: 688 [M+].
LS601-NHS ester
To LS601 (56 mmol), dissolved in DMF (2 mL), we added N-hydroxysuccinamide (120 mmol) and N-(3-dimethylaminopropyl)-N′-ethylcarbodiimide hydrochloride (EDC, 120 mmol) at once, and the reaction mixture was stirred overnight at room temperature. Diethyl ether (10 mL) was added to the reaction mixture to precipitate the product. The obtained precipitate was redissolved in a minimal amount of methanol and further precipitated with ether, precipitation was repeated again to give the desired NHS ester as a green solid (47 mg, 52 mmol, 92% yield). MALDI-MS m/z: 907 [M+, Bis-NHS], 810, [M+, mono-NHS]. ESI-MS m/z: 908 [M+, Bis], 811 [M+, Mono]
Conjugation of LS601 to Proteins
Despite the presence of two reactive functionalities on LS601, the SDS-PAGE analysis of the raw reaction mixtures demonstrated a primary monosubstitution pattern, apparently due to a strong steric hindrance preventing the second NHS group from reacting. Upon completion of the conjugation reaction (4 h) the second NHS ester was hydrolyzed leaving a free carboxylic group on the dye [the typical half-life of NHS ester under the conditions used (0.1 m NaHCO3 buffer) is ∼1 hour[55]].
Labeling Efficiency
Evaluation of the labelling efficiency Rd/p was achieved via UV/Vis absorption measurement of the conjugate in 1X PBS buffer via a standard equation.[56]
Lysozyme–LS601 Conjugate
Lysozyme (Lz) (3.9 mg) from chicken egg white was dissolved in 0.1m NaHCO3 buffer (1 mL) and mixed with a solution of LS601–NHS (1 mg) in 100 μL DMSO. The reaction mixture was left shaking at room temperature for 4 h. The conjugate was purified on a Sephadex G-25 column with 1X PBS buffer. Fractions were evaluated using SDS-PAGE, those containing the product were collected and lyophilized to give 36 mg of product. Labelling efficiency Rd/p ∼ 2.1 dye/Lz, mol/mol.
BSA-LS601 Conjugate
BSA (36 mg) was dissolved in 0.1 m NaHCO3 buffer and mixed with a solution of LS601–NHS (1 mg) in 50 μL DMSO. The reaction mixture was left shaking at room temperature for 4 h. The conjugate was purified on a Sephadex G-25 column with 1X PBS buffer. Fractions were evaluated using SDS-PAGE, those containing the product were collected and lyophilized to give 36 mg of product. Labelling efficiency Rd/p ∼0.81 dye/BSA, mol/mol.
IgG-LS601 Conjugate
IgG from rat serum (reagent grade > 95% by SDS–PAGE) (1 mg) was dissolved in 0.1 m NaHCO3 buffer. LS601–NHS (17 μL of a 1 mg mL−1 solution in DMSO, 3.0 equiv) was added to this mixture and was shaken for 2 h at room temperature. The reaction mixture was purified on a Sephadex G-25 column with 1X PBS buffer containing 2mm NaN3 as an eluent. Fractions were evaluated using SDS–PAGE, those containing the product were collected and lyophilized for storage. The labelling efficiency Rd/p was determined in 1X PBS buffer containing 2mm NaN3, Rd/p∼1.1 dye/IgG, mol/mol.
SDS-PAGE
An SDS-PAGE was run for each conjugate using a Bio-Rad Any KD or 4–20% Mini-PROTEAN TGX Gel according to the manufacturer protocol (Bio-Rad Laboratories). A Precision Plus Protein All Blue Standard, fluorescent at 710 nm, was used as the ladder (Bio-Rad). The gel was imaged using a small animal imaging system, Pearl Imager (Li-COR), with excitation at two different wavelengths, 685 and 785 nm, and emission collected at 710 and 810 nm, correspondingly.
3. Conclusions
Fluorescence anisotropy in the NIR has not been utilized previously due to the short fluorescence lifetime of NIR dyes and the absence of probes capable of restricted local motion in their bound state. To expand the use of this technique into the NIR spectral range, we have evaluated several types of dyes and demonstrated that the dye LS601 has the necessary properties required for use as a label in anisotropy applications. The dye exhibits a relatively long fluorescence lifetime, a short linker to minimize the low local mobility and could be easily conjugated to biomolecules under aqueous conditions.
The anisotropy assay window for LS601 was found to be 0.244 to 0.372, large enough to be measured with satisfactory precision on most commercially available fluorometers equipped with NIR-sensitive detectors and polarizers. The utility of fluorescence anisotropy with LS601 was demonstrated by characterization of dye–protein conjugates with lysozyme, BSA and IgG. The increase of fluorescence anisotropy values for all products suggested a successful conjugation to proteins.
Based upon our results we believe that fluorescence anisotropy in the NIR range will find a number of applications in drug discovery, fluorescence polarization imaging and contrast-agent development.
Acknowledgments
We gratefully acknowledge financial support from the National Institutes of Health: National Cancer Institute R21CA149814, National Heart Lung and Blood Institute as a Program of Excellence in Nanotechnology (HHSN268201000046C) and P50CA094056 from the Washington University Molecular Imaging Center. We thank Dr. Duanwen Shen and Dr. Sharon Bloch for help with the SDS-PAGE techniques.
References
- 1.Jameson DM, Ross JA. Chem Rev. 2010;110:2685–2708. doi: 10.1021/cr900267p. [DOI] [PMC free article] [PubMed] [Google Scholar]
- 2.Owicki JC. J Biomol Screening. 2000;5:297–306. doi: 10.1177/108705710000500501. [DOI] [PubMed] [Google Scholar]
- 3.Smith DS, Eremin SA. Anal Bioanal Chem. 2008;391:1499–1507. doi: 10.1007/s00216-008-1897-z. [DOI] [PubMed] [Google Scholar]
- 4.Pagano JM, Clingman CC, Ryder SP. RNA. 2011;17:14–20. doi: 10.1261/rna.2428111. [DOI] [PMC free article] [PubMed] [Google Scholar]
- 5.Gaudet EA, Huang KS, Zhang Y, Huang W, Mark D, Sportsman JR. J Biomol Screening. 2003;8:164–175. doi: 10.1177/1087057103252309. [DOI] [PubMed] [Google Scholar]
- 6.Sportsman JR, Daijo J, Gaudet EA. Comb Chem High Throughput Screening. 2003;6:195–200. doi: 10.2174/138620703106298374. [DOI] [PubMed] [Google Scholar]
- 7.Cleemann F, Karuso P. Anal Chem. 2008;80:4170–4174. doi: 10.1021/ac7025783. [DOI] [PubMed] [Google Scholar]
- 8.Levine LM, Michener ML, Toth MV, Holwerda BC. Anal Biochem. 1997;247:83–88. doi: 10.1006/abio.1997.2047. [DOI] [PubMed] [Google Scholar]
- 9.Maeda H. Anal Biochem. 1979;92:222–227. doi: 10.1016/0003-2697(79)90649-3. [DOI] [PubMed] [Google Scholar]
- 10.Simeonov A, Bi X, Nikiforov TT. Anal Biochem. 2002;304:193–199. doi: 10.1006/abio.2002.5599. [DOI] [PubMed] [Google Scholar]
- 11.Newman M, Josiah S. J Biomol Screening. 2004;9:525–532. doi: 10.1177/1087057104264597. [DOI] [PubMed] [Google Scholar]
- 12.Turek-Etienne TC, Lei M, Terracciano JS, Langsdorf EF, Bryant RW, Hart RF, Horan AC. J Biomol Screening. 2004;9:52–61. doi: 10.1177/1087057103259346. [DOI] [PubMed] [Google Scholar]
- 13.Zeigler MB, Allen PB, Chiu DT. Biophys J. 2011;100:2846–2851. doi: 10.1016/j.bpj.2011.04.042. [DOI] [PMC free article] [PubMed] [Google Scholar]
- 14.Levitt JA, Chung PH, Kuimova MK, Yahioglu G, Wang Y, Qu J, Suhling K. ChemPhysChem. 2011;12:662–672. doi: 10.1002/cphc.201000782. [DOI] [PubMed] [Google Scholar]
- 15.Davey AM, Walvick RP, Liu Y, Heikal AA, Sheets ED. Biophys J. 2007;92:343–355. doi: 10.1529/biophysj.106.088815. [DOI] [PMC free article] [PubMed] [Google Scholar]
- 16.Gough AH, Taylor DL. J Cell Biol. 1993;121:1095–1107. doi: 10.1083/jcb.121.5.1095. [DOI] [PMC free article] [PubMed] [Google Scholar]
- 17.Levitt JA, Matthews DR, Ameer-Beg SM, Suhling K. Curr Opin Biotechnol. 2009;20:28–36. doi: 10.1016/j.copbio.2009.01.004. [DOI] [PubMed] [Google Scholar]
- 18.Luchowski R, Sarkar P, Bharill S, Laczko G, Borejdo J, Gryczynski Z, Gryczynski I. Appl Opt. 2008;47:6257–6265. doi: 10.1364/ao.47.006257. [DOI] [PubMed] [Google Scholar]
- 19.Pu Y, Wang WB, Das BB, Achilefu S, Alfano RR. Appl Opt. 2008;47:2281–2289. doi: 10.1364/ao.47.002281. [DOI] [PubMed] [Google Scholar]
- 20.Kumar R, Roy I, Ohulchanskyy TY, Goswami LN, Bonoiu AC, Bergey EJ, Tramposch KM, Maitra A, Prasad PN. ACS Nano. 2008;2:449–456. doi: 10.1021/nn700370b. [DOI] [PubMed] [Google Scholar]
- 21.Rusinova E, Tretyachenko-Ladokhina V, Vele OE, Senear DF, Alexander Ross JB. Anal Biochem. 2002;308:18–25. doi: 10.1016/s0003-2697(02)00325-1. [DOI] [PubMed] [Google Scholar]
- 22.Jahnig F. Proc Natl Acad Sci USA. 1979;76:6361–6365. doi: 10.1073/pnas.76.12.6361. [DOI] [PMC free article] [PubMed] [Google Scholar]
- 23.Turek-Etienne TC, Small EC, Soh SC, Xin TA, Gaitonde PV, Barrabee EB, Hart RF, Bryant RW. J Biomol Screening. 2003;8:176–184. doi: 10.1177/1087057103252304. [DOI] [PubMed] [Google Scholar]
- 24.Gerega A, Zolek N, Soltysinski T, Milej D, Sawosz P, Toczylowska B, Liebert A. J Biomed Opt. 2011;16:067010. doi: 10.1117/1.3593386. [DOI] [PubMed] [Google Scholar]
- 25.Hilderbrand SA, Weissleder R. Curr Opin Chem Biol. 2010;14:71–79. doi: 10.1016/j.cbpa.2009.09.029. [DOI] [PubMed] [Google Scholar]
- 26.Rurack K, Spieles M. Anal Chem. 2011;83:1232–1242. doi: 10.1021/ac101329h. [DOI] [PubMed] [Google Scholar]
- 27.Pope AJ, Haupts UM, Moore KJ. Drug Discovery Today. 1999;4:350–362. doi: 10.1016/s1359-6446(99)01340-9. [DOI] [PubMed] [Google Scholar]
- 28.Irving M. Biophys J. 1996;70:1830–1835. doi: 10.1016/S0006-3495(96)79748-5. [DOI] [PMC free article] [PubMed] [Google Scholar]
- 29.Berezin MY, Guo K, Akers W, Northdurft RE, Culver JP, Teng B, Vasalatiy O, Barbacow K, Gandjbakhche A, Griffiths GL, Achilefu S. Biophys J. 2011;100:2063–2072. doi: 10.1016/j.bpj.2011.02.050. [DOI] [PMC free article] [PubMed] [Google Scholar]
- 30.Berezin MY, Lee H, Akers W, Achilefu S. Biophys J. 2007;93:2892–2899. doi: 10.1529/biophysj.107.111609. [DOI] [PMC free article] [PubMed] [Google Scholar]
- 31.Lee H, Berezin MY, Henary M, Strekowski L, Achilefu S. J Photochem Photobiol A. 2008;200:438–444. doi: 10.1016/j.jphotochem.2008.09.008. [DOI] [PMC free article] [PubMed] [Google Scholar]
- 32.Sasaki E, Kojima H, Nishimatsu H, Urano Y, Kikuchi K, Hirata Y, Nagano T. J Am Chem Soc. 2005;127:3684–3685. doi: 10.1021/ja042967z. [DOI] [PubMed] [Google Scholar]
- 33.Kundu K, Knight SF, Willett N, Lee S, Taylor WR, Murthy N. Angew Chem. 2009;121:305–309. doi: 10.1002/anie.200804851. [DOI] [PMC free article] [PubMed] [Google Scholar]; Angew Chem Int Ed. 2009;48:299–303. doi: 10.1002/anie.200804851. [DOI] [PMC free article] [PubMed] [Google Scholar]
- 34.Pham W, Medarova Z, Moore A. Bioconjugate Chem. 2005;16:735–740. doi: 10.1021/bc049700+. [DOI] [PubMed] [Google Scholar]
- 35.Licha K, Riefke B, Ntziachristos V, Becker A, Chance B, Semmler W. Photochem Photobiol. 2000;72:392–398. doi: 10.1562/0031-8655(2000)072<0392:hcdaca>2.0.co;2. [DOI] [PubMed] [Google Scholar]
- 36.Ye Y, Li WP, Anderson CJ, Kao J, Nikiforovich GV, Achilefu S. J Am Chem Soc. 2003;125:7766–7767. doi: 10.1021/ja034186o. [DOI] [PubMed] [Google Scholar]
- 37.Kuhn H. J Chem Phys. 1949;17:1198–1212. [Google Scholar]
- 38.Reynolds GA, Drexhage KH. J Org Chem. 1977;42:885–888. [Google Scholar]
- 39.Levine BG, Martanez TJ. Annu Rev Phys Chem. 2007;58:613–634. doi: 10.1146/annurev.physchem.57.032905.104612. [DOI] [PubMed] [Google Scholar]
- 40.Xu XF, Kahan A, Zilberg S, Haas Y. J Phys Chem A. 2009;113:9779–9791. doi: 10.1021/jp904097k. [DOI] [PubMed] [Google Scholar]
- 41.Englman R, Jortner J. Mol Phys. 1970;18:145–164. [Google Scholar]
- 42.Caspar JV, Kober EM, Sullivan BP, Meyer TJ. J Am Chem Soc. 1982;104:630–632. [Google Scholar]
- 43.Chynwat V, Frank HA. Chem Phys. 1995;194:237–244. [Google Scholar]
- 44.Gryczynski I, Malak H, Lakowicz JR. Chem Phys Lett. 1995;245:30–35. [Google Scholar]
- 45.Szmacinski H, Lakowicz JR. Anal Chem. 2008;80:6260–6266. doi: 10.1021/ac8003055. [DOI] [PMC free article] [PubMed] [Google Scholar]
- 46.Rao J, Dragulescu-Andrasi A, Yao H. Curr Opin Biotechnol. 2007;18:17–25. doi: 10.1016/j.copbio.2007.01.003. [DOI] [PubMed] [Google Scholar]
- 47.Berezin MY, Guo K, Akers W, Livingston J, Solomon M, Lee H, Liang K, Agee A, Achilefu S. Biochemistry. 2011;50:2691–2700. doi: 10.1021/bi2000966. [DOI] [PMC free article] [PubMed] [Google Scholar]
- 48.Berezin MY, Lee H, Akers W, Nikiforovich G, Achilefu S. Photochem Photobiol. 2007;83:1371–1378. doi: 10.1111/j.1751-1097.2007.00173.x. [DOI] [PubMed] [Google Scholar]
- 49.Navratil JS, Watkins SC, Wisnieski JJ, Ahearn JM. J Immunol. 2001;166:3231–3239. doi: 10.4049/jimmunol.166.5.3231. [DOI] [PubMed] [Google Scholar]
- 50.Krishnan VV, Cosman M. J Biomol NMR. 1998;12:177–182. doi: 10.1023/A:1008226330666. [DOI] [PubMed] [Google Scholar]
- 51.Lee H, Mason JC, Achilefu S. J Org Chem. 2006;71:7862–7865. doi: 10.1021/jo061284u. [DOI] [PubMed] [Google Scholar]
- 52.Ye Y, Bloch S, Kao J, Achilefu S. Bioconjugate Chem. 2005;16:51–61. doi: 10.1021/bc049790i. [DOI] [PubMed] [Google Scholar]
- 53.Benson RC, Kues HA. Phys Med Biol. 1978;23:159–163. doi: 10.1088/0031-9155/23/1/017. [DOI] [PubMed] [Google Scholar]
- 54.Oushiki D, Kojima H, Terai T, Arita M, Hanaoka K, Urano Y, Nagano T. J Am Chem Soc. 2010;132:2795–2801. doi: 10.1021/ja910090v. [DOI] [PubMed] [Google Scholar]
- 55.Hermanson GT. Bioconjugate Techniques. Academic Press; San Diego: 1996. [Google Scholar]
- 56.Black KC, Kirkpatrick ND, Troutman TS, Xu L, Vagner J, Gillies RJ, Barton JK, Utzinger U, Romanowski M. Mol Imaging. 2008;7:50–57. [PubMed] [Google Scholar]