Abstract
A mechanistic analysis of the various mass transport and kinetic steps in the microbial desulfurization of dibenzothiophene (DBT) by Rhodococcus erythropolis IGTS8 in a model biphasic (oil-water), small-scale system was performed. The biocatalyst was distributed into three populations, free cells in the aqueous phase, cell aggregates and oil-adhered cells, and the fraction of cells in each population was measured. The power input per volume (P/V) and the impeller tip speed (vtip) were identified as key operating parameters in determining whether the system is mass transport controlled or kinetically controlled. Oil-water DBT mass transport was found to not be limiting under the conditions tested. Experimental results at both the 100 mL and 4L (bioreactor) scales suggest that agitation leading to P/V greater than 10,000 W/ m3 and/or vtip greater than 0.67 m/s is sufficient to overcome the major mass transport limitation in the system, which was the diffusion of DBT within the biocatalyst aggregates.
Keywords: biodesulfurization, dibenzothiophene, Rhodococcus erythropolis IGTS8, rate-limiting step, power input per volume, aggregation
Introduction
Hydrodesulfurization (HDS) is the current industry standard for removing sulfur from fuels derived from crude oil. HDS uses a metal catalyst along with hydrogen gas (H2) at high temperature and pressure to remove sulfur from organo-sulfur compounds and generate H2S gas (Soleimani et al, 2007). One of the major drawbacks of HDS is that certain recalcitrant compounds can sterically hinder the metal catalysts (Soleimani et al, 2007). The most common recalcitrant compounds are dibenzothiophene (DBT) and its alkylated derivatives, such as 4-methyldibenzothiophene (4-DBT) and 4,6-dimethyldibenzothiophene (4,6-DBT) (Soleimani et al, 2007). Biodesulfurization (BDS) is an alternate desulfurization technology that utilizes microbes to remove sulfur from compounds recalcitrant to HDS, and as such, BDS can potentially be used to complement the current HDS infrastructure (Kilbane, 2006).
The majority of BDS biocatalysts use the 4S pathway to convert DBT to 2-hydroxybiphenyl (HBP) and sulfate. Rhodococcus erythropolis IGTS8 was the first strain discovered to be able to convert DBT to HBP via the 4S pathway (Soleimani et al, 2007). This is also the best-characterized BDS strain to date (Gray, 2003 and Kilbane, 2006). This strain is gram-positive and its cell wall contains mycolic acids ranging from 34-50 carbon atoms, which account in part for its hydrophobicity and ability to adhere to oil droplets (Dorobantu et al, 2004; Lichtinger et al, 2000). The cells act essentially as an oil-water emulsifier (Doronbantu et al, 2004). It has been previously postulated that cells that have adhered to the oil-water interface may be able to obtain DBT by “drinking from the oil” directly (Monticello, 2000).
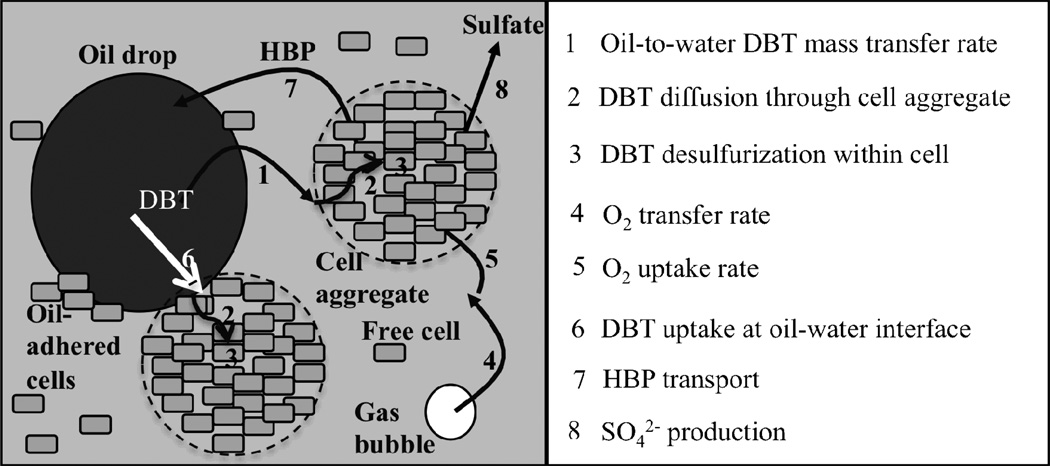
BDS systems consist of three components: oil, aqueous, and cellular (Figure 1). Furthermore, the cells are distributed into three populations: free cells in the aqueous phase, oil-drop-adhered cells and cells in aggregates in the aqueous phase. The number of mechanistic steps involved in the bio-conversion of DBT to HBP depends on the population of cells that is considered. For cells that form aggregates in the aqueous phase there are three mechanistic steps (Figure 1). The first step is the transport of DBT from the oil to the aqueous phase. The second step is DBT transport from the external surface of the bacterial aggregate through the aggregate until DBT reaches a single cell’s surface. The third and final step is the uptake of DBT by the cells and enzymatic degradation of DBT into HBP and sulfate via the 4S pathway. For free cells in the aqueous phase, the second step does not occur. For oil-adhered cells neither the first nor the second step occurs because cells have access to DBT directly from the oil phase.
Figure 1.
Mechanistic steps in a BDS system at high cell density. Biocatalyst may be present in one of three populations: free cells in aqueous phase, oil-adhered cells and cells in aggregates. Oxygen transport and uptake is necessary because the 4S pathway is an oxidative pathway that requires 3 moles of O2 per mole of DBT desulfurized.
There are only a few reports that have compared the various mechanistic steps in the BDS process. Jia et al (2004) investigated the BDS of DBT by resting cells of Gordonia sp. WQ-01 at cell densities from 10–30 g DCW/L, oil fractions of 0.15–0.25 and DBT concentrations of 1–10 mM in oil. They concluded that the BDS process experiences a transition in rate-limiting step from bioconversion to mass transfer resistance. However, their analysis assumed that DBT bioconversion could only take place in the bulk aqueous phase and not at the oil-water interface. This was assumed despite the fact that Gordonia sp. WQ-01 has a hydrophobic cell wall, is gram-positive and associates well with walls of glass flasks. These are behaviors that are shared with R. erythropolis and other strains that are able to adhere to an oil-water interface. Therefore, there is reason to believe that Gordonia may be able to access DBT at such interfaces.
In a study using Pseudomonas putida CECT5279 as the biocatalyst for BDS, the rate-limiting step was found to be the oil-to-water DBT mass transport rate in a biphasic system (Boltes et al, 2012). Unlike R. erythropolis, P. putida is gram-negative, does not have a hydrophobic cell wall and is not known to adhere to hydrocarbons. Therefore, P. putida is not expected to form an oil-water emulsion during biphasic BDS experiments. As a result, the oil droplet size should be significantly larger when P. putida is the biocatalyst relative to R. erythropolis. In a separate study, the mass transfer rate of DBT across the oil-water interface was calculated to be 10 to 104 times greater than the DBT bioconversion rates of various R. erythropolis strains (Marcelis et al, 2003). However, the mathematical model created in that study did not take into account the potential of the cells to form aggregates and/or adhere to oil droplets, which will affect the value of the parameters in the model and the conclusions in the study (Marcelis et al, 2003).
In summary, the literature on determining the rate-limiting step in BDS in the presence of the most common, gram-positive, hydrophobic biocatalysts is sparse. Most publications attempt to characterize both the mass transport and kinetic parameters in the presence of biocatalyst, which leads to great difficulty in decoupling the two sets of parameters. Moreover, there are, to our knowledge, no reports that address the ability of the cells to aggregate, which is a behavior shared by many gram-positive strains at high cell density. Therefore, there is a need for a thorough, self-contained analysis of the BDS process. In this work, the various mass transport and kinetic steps in the biodesulfurization of DBT dissolved in hexadecane were analyzed and the rate-limiting step under the conditions tested were identified.
Materials and Methods
Bacterial strains, media and chemicals
The DBT-desulfurizing strain used in this study was Rhodococcus erythropolis IGTS8 ATCC® 53968TM, purchased from the American Type Culture Collection (USA). The defined minimal medium (MM) for cultivation contained (per liter of deionized water): glucose 30.0 g, NH4Cl 3.0 g, K2HPO4.3H2O 6.75 g, NaH2PO4.H2O 2.25 g, MgCl2 0.245 g, FeCl3 4 mg, CaCl2 4 mg, Na2SO4 0.14 g, ZnCl2 32 mg, MnCl2.4H2O 1 mg, CuCl2.2H2O 5 mg, Co(NO3)2.6H2O 0.7 mg, Na2B4O7.10H2O 0.7 mg, (NH4)6Mo7O24.4H2O 1 mg, EDTA 12 mg. This medium was modified from the defined medium used by Schilling et al, 2002. Cryogenic stocks were prepared by addition of 15% (vol./vol.) glycerol (final concentration) to mid-log growth phase cultures in MM, which were maintained at −80°C for long term storage. Medium components were obtained from VWR International (USA). All other chemicals were obtained from Sigma-Aldrich (USA).
Resting cells preparation
R. erythropolis IGTS8 cultures were grown in 400 mL of MM in a 2L shake flask for a period of 40–48 hours during which the cell density increased from approximately 0.03 g DCW/L to 3 g DCW/L. Cultures were centrifuged at 5000 RPM and 4°C for 15 min and spent media was discarded. Biocatalyst pellets were resuspended to a final cell density of 15.5 g DCW/L in 5 g/L glucose and 20 mM phosphate buffer pH 7.0.
Analytical methods and sample preparation
Three-component (oil-water-cells) samples were centrifuged in 1.5 mL Eppendorf tubes at 13,000 RPM for 5 min to fully separate all three components. After centrifugation, the oil phase was removed from the top and transferred to an HPLC vial. The bottom aqueous phase was pipetted out after centrifugation and re-centrifuged in a new Eppendorf tube to ensure no oil or cells remained in the aqueous phase. The aqueous phase was then transferred to an HPLC vial. DBT and HBP concentrations in the aqueous and oil phases were quantified via HPLC (Gold 168 series Beckman-Coulter, USA) equipped with a diode array detector (peak areas measured at 242 nm). External standards provided calibration. Analyte separation was achieved on a Zorbax® SB-C18 reversed-phase column (Agilent Technologies, USA) with a mobile phase of 50/50 (vol/vol) acetonitrile/water at a flow rate of 1 mL/min. Column temperature was set to 60°C.
Determination of DBT mass transfer rate from oil to water in the absence of cells
The mass transfer rate of DBT between hexadecane and water was measured in a small-scale system. This system consisted of a 400 mL, 3 inch diameter beaker maintained at 30°C in a constant temperature water bath. The 150 mL working volume within the beaker was stirred with an overhead Heidendolph® mixer. A 4-blade, 1.75 inch diameter impeller was used for mixing. Water saturated with DBT was first added to the beaker and stirred at the experimental mixing speed. Next, pure hexadecane was added to the beaker and samples were removed quickly thereafter for the next 5-10 minutes. The concentration of DBT in hexadecane was measured, while the concentration in the water phase was obtained from a mass balance (equation 3). The equations for DBT mass transport across the oil-water interface are:
| (1) |
| (2) |
| (3) |
where kw is the water-side DBT mass transport coefficient (the oil-side DBT mass transport coefficient is insignificant because mow>>1), a is the oil-water interfacial area per unit volume, ϕ is the oil fraction, mow is the oil-water DBT partition coefficient, CDBT,oil is the concentration of DBT in the oil phase, CDBT,water is the concentration of DBT in the water phase and C*DBT,oil = CDBT,watermow is the concentration of DBT in the oil phase that would be in equilibrium with the actual DBT concentration in the water phase. For each experimental run, the best-fit value of kwa was obtained by first using the function ode15s in MATLAB® to generate various solutions to the differential equations (equations 1 and 2) for various values of kwa. Next, the least-squares best-fit kwa value was obtained using the non-linear fitting function nlinfit in MATLAB®. The volumetric mass transport coefficient (kwa) was modeled over a range of oil fraction (ϕ ) and mixing speeds (N) by a power law expression, the parameters of which were estimated via least-squares regression.
Aqueous-phase-only DBT desulfurization experiments
All aqueous-phase-only experiments were incubated at 30°C and 250 RPM in a rotary shaker. In the first set of experiments, resting-cell suspensions of 5 mL at a cell density of 1.5 g DCW/L were incubated with 200 µM DBT for one hour to measure the maximal specific desulfurization rate (Rmax). In another set of experiments, resting-cell suspensions of 10 mL at a cell density of 0.05 g DCW/L were incubated with DBT 10 minutes to measure the initial rate of DBT desulfurization. The DBT concentrations tested were 0.1, 0.25, 0.5, 1 and 3 µM. In another set of experiments, resting-cell suspensions of 20 mL at a cell density of 15.5 g DCW/L were incubated with 1 mM DBT for 20 hours and the DBT desulfurization rate was measured throughout the 20-hour time period in order to determine the effect of HBP accumulation on the desulfurization rate.
Three-component biodesulfurization (BDS) experiments
The small-scale system used for these experiments was the same as described in “Determination of DBT mass transfer rate from oil to water in the absence of cells.” First, resting-cell suspensions of 75 mL at a cell density of 15.5 g DCW/L were stirred at 1000 RPM at 30°C for 15 minutes. This was done to break up aggregates formed during resting-cell preparation. After the 15-minute period, the maximal specific desulfurization rate (Rmax) was measured off-line. Next, impeller agitation in the small-scale system was adjusted to the experimental value (500, 800 or 1000 RPM). Below 500 RPM, the oil and water phases are not well-mixed at this scale. Then a 25 mL hexadecane solution containing 10 mM DBT was added. The experiment was stopped one hour after oil addition. One mL samples taken initially and one hour after oil addition were neutralized by addition of 1% concentrated hydrochloric acid solution. After measuring DBT and HBP concentrations at the start and the end of experiment, the total cell-specific desulfurization rate (Rtotal) was determined by the following relationship:
| (4) |
where tf is the one-hour length of the experiments, CHBP water|tf is the HBP concentration in water at tf, CHBP oil|tf is the HBP concentration in hexadecane at tf, ϕ is the oil fraction and X is the cell density. Samples of 5 µL were also taken for examination and imaging using a Canon PowerShot SX260 camera under light microscope.
Modeling
Visual examination of samples from three-component BDS experiments allowed the identification of three different biocatalyst populations: free cells in aqueous phase, cells adhered to oil-droplets and cells that formed aggregates (see supplementary Figure S1). Therefore, Rtotal could be expressed by the following relationship:
| (5) |
where Rfree is the cell-specific desulfurization rate of free cells in aqueous phase and ffree is the fraction of free cells in aqueous phase. Roil, foil, Ragg, fagg are defined in the same manner for the other two biocatalyst populations. The values of Roil and Rfree were determined to be equal to Rmax as explained in the Results. The specific desulfurization rate of cells in aggregates (Ragg) was determined by the following relationship:
| (6) |
where η is the effectiveness factor, which is defined as the ratio of the actual rate of desulfurization within the aggregates to the rate of desulfurization if there was no intra-aggregate diffusion limitation. Rearranging the previous equation allows one to solve for η:
| (7) |
The effectiveness factor for spherical aggregates and zero-order kinetics (CDBT,water >> Km in all experiments) is determined from the following relationship (Shuler and Kargi, 2002):
| (8) |
where De is the effective diffusivity within the aggregates, and d32,agg is the Sauter mean aggregate diameter. Three-component BDS experiments provided a data pair of (d32,agg, η) values for each mixing speed studied. Then, equation 8 was fit to the (d32,agg, η) data set using the non-linear fitting function nlinfit in MATLAB® to obtain least-squares best-fit value of the parameter De.
Results
DBT mass transfer rate between hexadecane and water in absence of cells
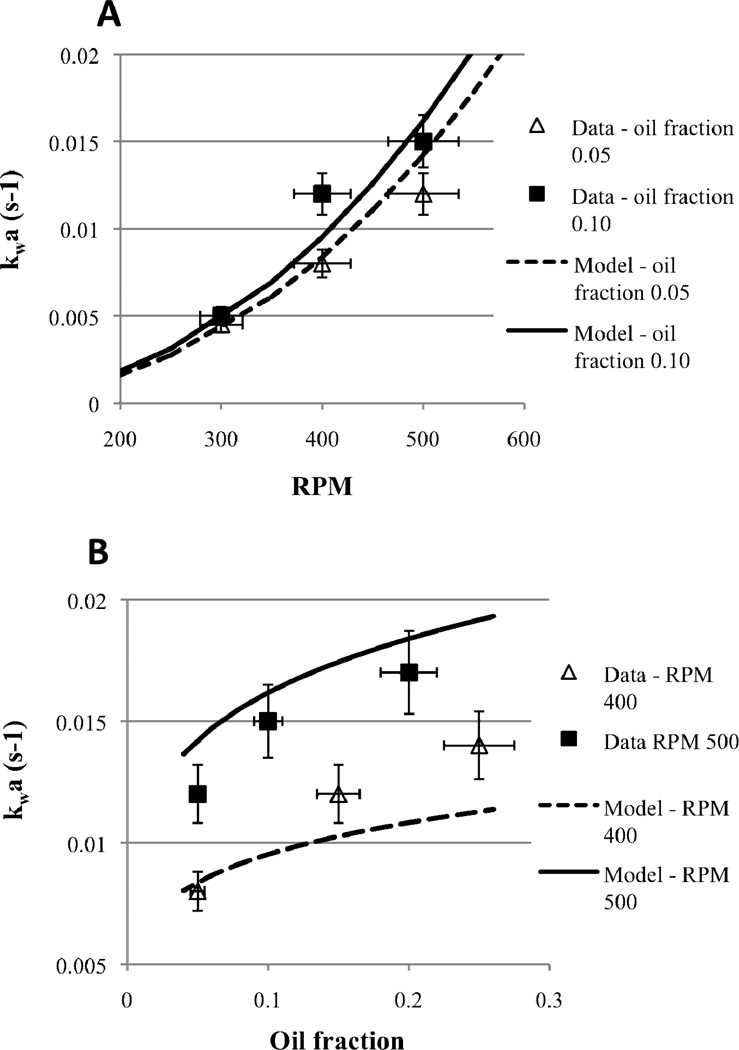
The volumetric mass transfer coefficient of DBT between oil and water (kwa) was determined at oil fractions ranging from 0.05–0.25 and mixing speeds ranging from 300–500 RPM. It was found that kwa increases monotonically with both oil fraction, ϕ, and mixing speed, N (Figure 2), as expressed in the relationship:
| (9) |
The power coefficients of 0.2 and 2.4 for the oil fraction and the mixing speed are very similar to previously reported coefficients for similar systems (Skelland et al, 1981).
Figure 2.
Volumetric mass transport coefficient (kwa) for the oil-to-water mass transport of DBT from hexadecane to water at mixing speeds from 300-500 RPM (A) and oil fractions from 0.05 to 0.25 (B). Experiments were done in the small-scale system. Solid and dashed lines are model predictions from equation 9.
Estimating the fraction of cells in each biocatalyst population
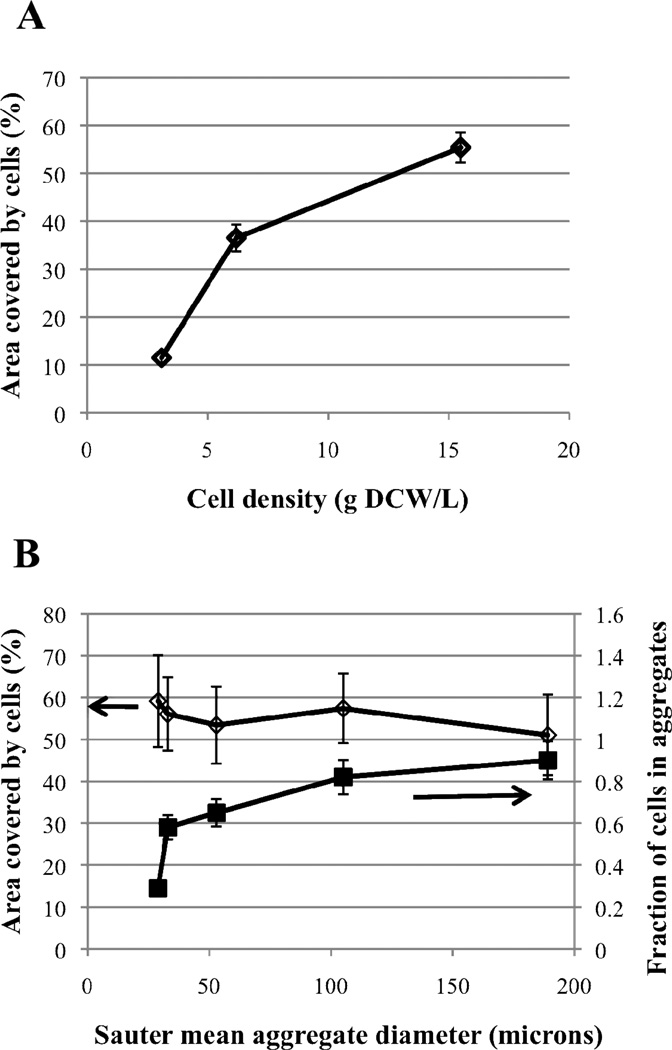
Images taken from resting cell suspensions of cell densities of 3.1, 6.2 and 15.5 g DCW/L were analyzed using CellProfiler (Carpenter et al, 2006) to obtain the total area coverage by all cells (see Supplementary Information). The total area was found to increase monotonically with cell density (Figure 3A). Images taken from a resting cell suspension of 15.5 g DCW/L stirred at mixing speeds ranging from 200–1000 RPM were also analyzed using CellProfiler (Figure 3B). The mean aggregate diameter (d32,agg) was found to decrease significantly with increasing mixing speed: 189, 105, 33, 32 and 29 µm for mixing speeds of 200, 350, 500, 800 and 1000 RPM, respectively. Moreover, the fraction of cells in aggregates (fagg) was also found to be strongly dependent on the mixing speed; fagg decreased from 0.90 at 200 RPM to 0.29 at 1000 RPM. Despite the strong dependence of the mean aggregate size and fraction of cells in aggregates on the mixing speed, the total area was not affected by mixing speed (Figure 3B). From this finding, we concluded that the total area covered by the cells is only dependent on the cell density and is not dependent on the distribution of cells in the different populations. As a result, we estimated the fraction of cells in a population to be proportional to the area covered by the cells in that population.
Figure 3.
(A) - Total area covered by the cells at three different cell densities in aqueous-phase only system was measured using CellProfiler. (B) – Cells at a density of 15.5 g DCW/L were agitated at 200 to 1000 RPM, which led to decreasing mean aggregate sizes (right to left along the x-axis). Fraction of cell in aggregates (squares) and total area covered by cells (diamonds) were also measured.
Estimating the Km for DBT desulfurization by R. erythropolis IGTS8
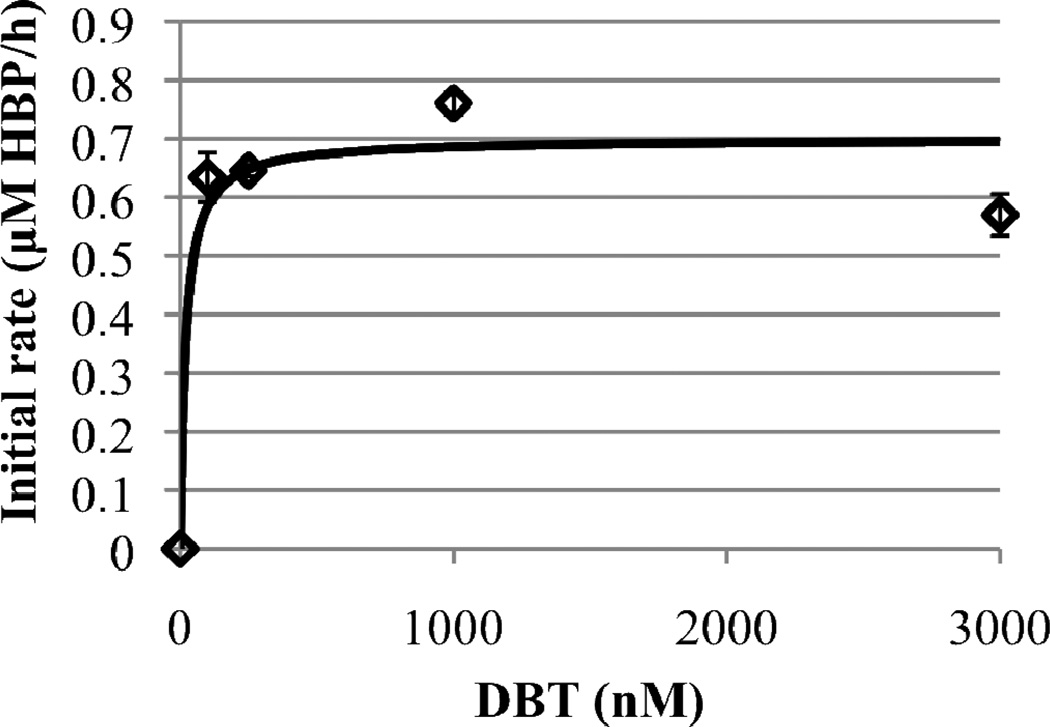
The initial rate of DBT desulfurization by R. erythropolis IGTS8 cells at a cell density of 0.05 g DCW/L was estimated in an aqueous-phase-only system. This low cell density was used in order to balance the low solubility of DBT in water and examine kinetics over a range of substrate concentrations. The DBT concentration ranged from 100 to 3000 nM. The desulfurization rate was found to be approximately constant for all the DBT concentrations tested (Figure 4). Due to the limit of detection of HPLC, the desulfurization rate could not be measured for DBT concentrations smaller than 100 nM. As a result, the Michaelis-Menten (or any other) model could not be precisely fit to the measured data. Instead, the Michaelis-Menten parameters were estimated. The value of kcat = 13.2 ± 1.6 µmole DBT/g DCW/h was calculated from the average of all initial desulfurization rates measured at the different DBT concentrations. The Michaelis constant (Km) estimate of 10 nM was obtained by manually varying the Km value until the initial desulfurization rate predicted by the model was 0.90 of the maximum at a DBT concentration of 100 nM. A Km value of 26 nM was calculated from data on the desulfurization of DBT by R. erythropolis KA2-5-1 (Kobayashi et al, 2001). This value is in close agreement with the value estimated here.
Figure 4.
Initial DBT desulfurization rate data (diamonds) and Michaelis-Menten fit (line) for R. erythropolis IGTS8 cells in aqueous-phase-only system with a cell density of 0.05 g DCW/L. The line plotted corresponds to values of kcat of 13.2 ± 1.6 µmole DBT/g DCW/h and Km of 10 nM.
Effect of HBP accumulation on desulfurization rate in aqueous-phase-only BDS experiments
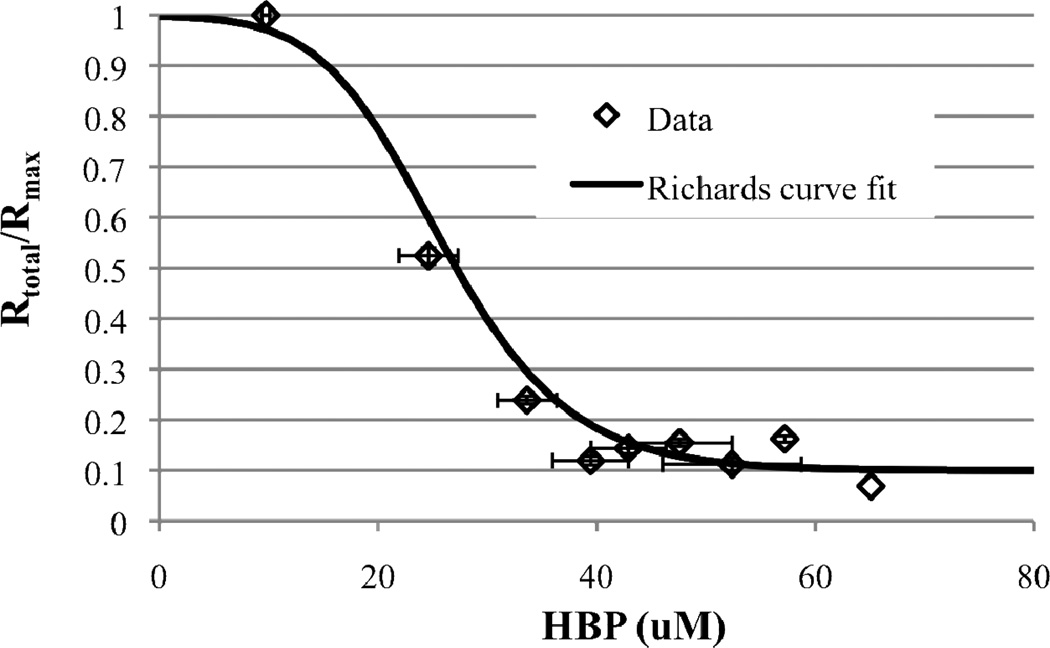
The cell-specific DBT desulfurization rate (Rtotal) by resting cells was monitored over time in an aqueous-phase-only system at a cell density of 15.5 g DCW/L and an initial DBT concentration of 1 mM. Rtotal was found to decrease as HBP accumulated in the aqueous medium (Figure 5), which is consistent with previous reports (Caro et al, 2008 and Chen et al, 2008). The concentration of HBP at which the desulfurization rate decreased to 50% of its maximum value (IC50) was approximately 26 µM, which agrees well with a previous estimate of 25–40 µM (Caro et al, 2008). Due to the various regimes (two plateaus and one sharp drop) in the desulfurization rate as a function of HBP concentration, a sigmoid curve (Generalized logistic equation or Richards’ curve) was chosen to best fit the data:
| (10) |
Figure 5.
Desulfurization rate by a 15.5 g DCW/L resting cell suspension as a function of HBP accumulated in the aqueous media. Initial DBT concentration was 1 mM. No HBP was added exogenously. Diamonds represents data and the model fit corresponding to equation 10 is shown by the line.
Oil-to-water DBT mass transport rate was not the rate-limiting step in the small-scale system under the conditions studied
The mass transport coefficient in the presence of cells (kwa)cells was determined from the following relationship:
| (11) |
where (kwa)no cells is the mass transport coefficient in the absence of cells (equation 9). d32,oil-no-cells is the Sauter mean oil droplet diameter in the absence of cells. d32,oil-with-cells is the Sauter mean oil droplet diameter in the presence of cells, which was measured via CellProfiler. The value of d32,oil-no-cells was estimated from the following relationship (Coulaloglou et al, 1976):
| (12) |
where Di is the impeller diameter, ϕ is the oil fraction, and We is the Weber number, which is given by the relationship (Garcia-Ochoa and Gomez, 2009):
| (13) |
where ρ is the density of water, σ is the interfacial tension between hexadecane and water and N is the impelled speed.
The mass transport rate of DBT across the oil-water interface in the presence of cells was then estimated from the relationship (Cussler, 1997):
| (14) |
The volumetric desulfurization rate (Vtotal) was determined according to the following relationship:
| (15) |
The calculated DBT oil-water mass transport rate (MTRcells) was found to be significantly greater than the measured volumetric desulfurization rate (Vtotal) at all of the different mixing speeds investigated (Table I). Furthermore, the DBT concentration in the water phase was non-zero and was close to 0.5 µM, the value in equilibrium with the oil phase (Table I). The DBT concentration in the water phase would be expected to be zero if the oil-water DBT mass transport rate were significantly slower than the volumetric desulfurization rate. These findings led us to conclude that the oil-to-water DBT mass transport rate was not the rate-limiting step in the small-scale system under the conditions investigated.
Table I.
Comparison of DBT oil-to-water mass transport rate and the measured BDS rate in the small-scale system at cell density of 15.5 g DCW/L, oil fraction of 0.25 and initial DBT in oil concentration of 10 mM.
| RPM | MTRcells (umole DBT/L/h)a |
Vtotal (μmole HBP/L/h)b |
CDBT,water (μM) | CHBP,water (μM) |
|---|---|---|---|---|
| 500 | 89 | 24 | 0.30 ± 0.03 | 2.0 ± 0.1 |
| 800 | 206 | 51 | 0.32 ± 0.08 | 4.5 ± 0.1 |
| 1000 | 586 | 128 | 0.46 ± 0.12 | 7.5 ± 0.6 |
Oil-water DBT mass transport rate in presence of biocatalyst
Volumetric BDS rate measured
Effect of mixing speed on the total specific desulfurization rate in small-scale system
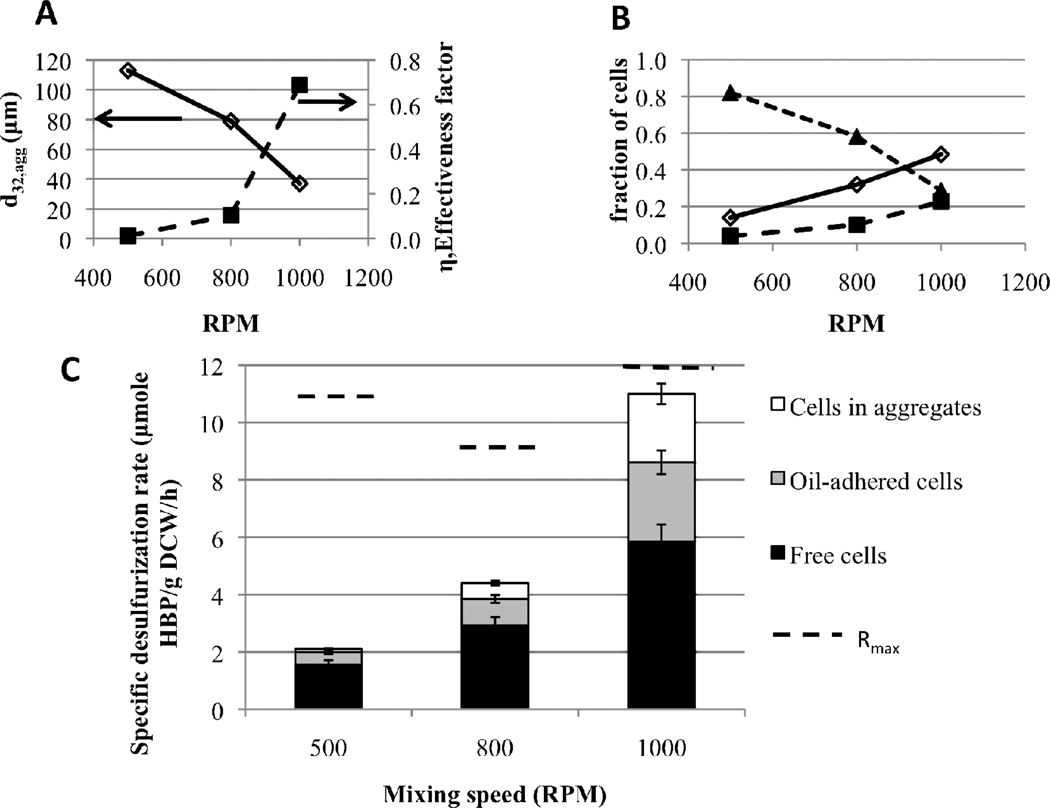
Increased mixing speed led to a significant decrease in aggregate size (Figure 6A). This in turn led to a significantly higher effectiveness factor (η) with increasing mixing speed (Figure 6A). As a result, even though the fraction of cells in aggregates (fagg) decreased significantly with mixing speed (Figure 6B), the contribution to the total desulfurization rate by cells in aggregates (Raggfagg = Rmaxηfagg) increased significantly (Figure 6C). Moreover, the increase in both the fraction of free cells (ffree) and the fraction of oil-adhered cells (foil) with mixing speed (Figure 6B) led to an increased contribution to the total desulfurization rate by these two populations, Rfreeffree and Roilfoil (Figure 6C), because Roil and Rfree both equal Rmax. The assumption that Rfree equals Rmax was made for two reasons. First, zero-order kinetics could be assumed since the measured DBT concentrations in the water phase (Table I) were much greater than the estimated Km of 10 nM (Figure 4). Second, the measured HBP concentrations in the water phase in the three-component BDS experiments were all under 10 µM (Table I). At these HBP concentrations, there is no reduction in biocatalyst activity due to HBP accumulation (Figure 5). The assumption that Roil equals Rmax was made because oil-adhered cells were assumed to be able to obtain DBT directly from the oil phase by “drinking from the oil,” as has been previously suggested (Monticello, 2000). Therefore, the total cell-specific desulfurization rate (Rtotal) and the contribution to Rtotal by each population (Rfreeffree, RaggfaggRoilfoil) increased with mixing speed (Figure 6C).
Figure 6.
Small-scale, three-component BDS experiments at a cell density of 15.5 g DCW/L, oil fraction 0.25, initial DBT in oil of 10 mM and mixing speeds of 500, 800 and 1000 RPM. (A) - Effect of mixing speed on Sauter mean aggregate size (open diamonds) and on effectiveness factor (filled squares); (B) - Effect of mixing speed on the fraction of cells in each biocatalyst population: free cells (open diamonds), oil-adhered cells (filled squares), cells in aggregates (filled triangles); (C) - Increasing mixing speed led to a clear increase in the contribution to total specific desulfurization rate by cells in all three populations: free cells (black), oil-adhered cells (gray), aggregate cells (white).
Prediction of volumetric desulfurization rate upon scale-up
For each mixing speed tested in the small-scale system, the corresponding power input per unit volume (P/V) and impeller tip speed (vtip) were calculated from the following relationships (Garcia-Ochoa and Gomez, 2009):
| (16) |
| (17) |
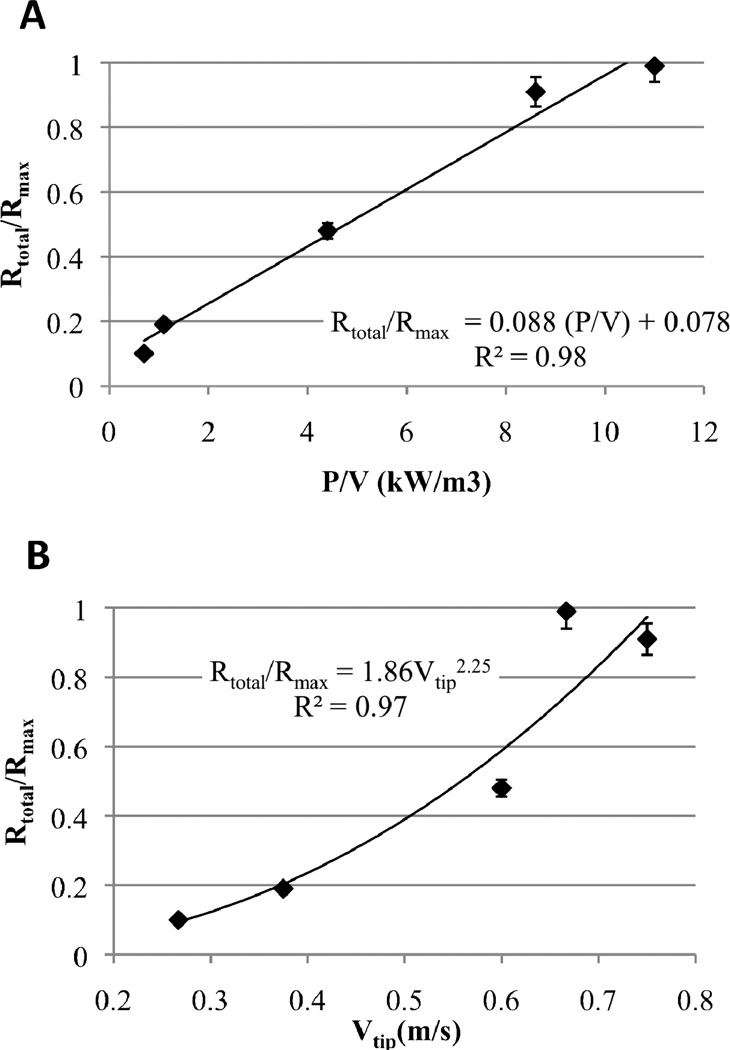
where ρ is the density of the media, NP is the power number, N is the mixing speed and Di is the impeller diameter. vtip is proportional to the maximum shear rate, (dV/dy)max (equation 17). The values of P/V, vtip and the resulting Rtotal/Rmax are shown in Table II and Figure 7. Two experiments were done at the 4L bioreactor scale at mixing speeds of 200 and 500 RPM. The values of P/V and vtip and the resulting Rtotal/Rmax at the 4L bioreactor scale are shown in Table II and Figure 7. P/V and vtip were found to be useful scale-up parameters in determining the fraction of the maximum desulfurization rate attained (Rtotal/Rmax), regardless of scale or mixing speed (Table II and Figure 7). Below P/V values of approximately 10,000 W/m3 and/or below vtip values of approximately 0.67 m/s, the desulfurization rate is controlled by intra-aggregate diffusion and as a result, Rtotal/Rmax is less than 1 (Table II and Figure 7). Above approximately P/V = 10,000 W/m3 and or vtip = 0.67 m/s, mass transport limitations are overcome and the desulfurization rate is kinetically limited (Rtotal/Rmax = 1) (Table II).
Table II.
Power input per unit volume (P/V), impeller tip speed (vtip) and ratio of actual to maximum cell-specific desulfurization rate (Rtotal/Rmax) in the small-scale system (100 mL) and in the 4L bioreactor.
| Scale | Mixing speed (RPM) |
P/V (Watts/m3) |
vtip (m/s) |
Rtotal/Rmax |
|---|---|---|---|---|
| 4 L | 200 | 700 | 0.27 | 0.10 ± 0.02 |
| 100 mL | 500 | 1100 | 0.38 | 0.19 ± 0.02 |
| 100 mL | 800 | 4400 | 0.60 | 0.48 ± 0.03 |
| 100 mL | 1000 | 8600 | 0.75 | 0.91 ± 0.02 |
| 4 L | 500 | 11000 | 0.67 | 0.99 ± 0.05 |
Figure 7.
(A) – Effect of power input per volume (P/V) on the fraction of the maximum desulfurization rate attained (Rtotal/Rmax). (B) – Effect of impeller tip speed (vtip) on the fraction of the maximum desulfurization rate attained (Rtotal/Rmax). Diamonds represent data and line corresponds to least-squares correlation equation shown on plot.
Discussion and conclusions
The volumetric mass transport coefficient of DBT between water and hexadecane was found to depend on ϕ0.2 and N2.4. This power dependence is very similar to the power dependence of ϕ0.3 and N2.4 measured in similar continuous-phase mass transfer systems (Skelland et al, 1981). These are systems in which the solute is orders of magnitude less soluble in the continuous phase compared to the dispersed phase. As a result, the mass transport is dominated by the continuous-phase mass transport coefficient in these systems.
Three-component (oil-water-biocatalyst) BDS experiments were carried out in a small-scale (100 mL) system and in a 4L bioreactor. The power input per volume (P/V) and the impeller tip speed (vtip) are useful parameters in determining the desulfurization rate in these experiments (Table II). The major mass transport limitation and the rate-limiting step in these experiments was the diffusion of DBT within the bacterial aggregates. In order to overcome this mass transport limitation, it is estimated that P/V and/or vtip should exceed 10,000 W/m3 and 0.67 m/s, respectively. It was determined that a higher fraction of the biocatalyst has access to DBT at increasing values of P/V and/or vtip due to decreased aggregate size and a lower fraction of cells in aggregates, which in turn led to a higher fraction of free and oil-adhered cells (Figure 5). The total desulfurization rate increased as a result of the higher fraction of biocatalyst with access to substrate. Previous BDS reports have not accounted for the biocatalyst’s ability to aggregate; thus, the analysis performed in this work is the first to incorporate all the major phenomena observed during BDS of DBT in an oil-water system.
Supplementary Material
Acknowledgements
AAF was supported by the Biotechnology Training Program from the National Institute of Health (NIH). Research support from Saudi Aramco is also gratefully acknowledged.
Nomenclature
- BDS
biodesulfurization
- CDBT,oil
concentration of DBT in oil (mM)
- CDBT,water
concentration of DBT in water (µM)
- CHBP,water
concentration of HBP in water (mM)
- CHBP,oil
concentration of HBP in oil (mM)
- DBT
dibenzothiophene
- De
effective diffusivity of DBT within aggregates (m2/s)
- Di
impeller diameter
- dV/dy
shear rate (s−1)
- d32,agg
sauter mean aggregate diameter (µm)
- fagg
fraction of cells in aggregates
- ffree
fraction of free cells
- foil
fraction of oil-adhered cells
- HBP
hydroxybiphenyl
- HDS
hydrodesulfurization
- kcat
turnover number (s−1)
- Km
Michaelis constant (nM)
- kwa
volumetric mass transport coefficient (s−1)
- mow
oil-water DBT partition coefficient
- MTR
oil-to-water DBT mass transport rate (µmole DBT/Ltotal/h)
- N
mixing speed (rev/min)
- NP
power number
- P/V
power input per volume (W/m3)
- Ragg
specific desulfurization rate of cells in aggregates (µmole HBP/g DCW/h)
- Rfree
specific desulfurization rate of free cells (µmole HBP/g DCW/h)
- Rmax
maximum specific desulfurization rate (µmole HBP/g DCW/h)
- Roil
specific desulfurization rate of oil-adhered cells (µmole HBP/g DCW/h)
- Rtotal
total specific desulfurization rate (µmole HBP/g DCW/h)
- tf
time at which samples were taken to measure Rtotal (min)
- vtip
impeller tip speed (m/s)
- Vtotal
total volumetric desulfurization rate (µmole HBP/Ltotal/h)
- We
Weber number
- X
cell density (g DCW/L)
- ρ
liquid medium density (kg/m3)
- σ
liquid medium interfacial tension (N/m)
- ϕ
oil fraction
- η
effectiveness factor
References
- Boltes K, del Aguila RA, Garcia-Calvo E. Effect of mass transfer on biodesulfurization kinetics of alkyalted forms of dibenzothiophene by Pseudomonas putida CECT5279. J Chem Technol Biotechnol. 2012;88:422–431. [Google Scholar]
- Caro A, Boltes K, Leton P, Garcia-Calvo E. Description of by-product inhibition effects on biodesulfuriation of dibenzothiophene in biphasic media. Biodegradation. 2008;19:599–611. doi: 10.1007/s10532-007-9165-z. [DOI] [PubMed] [Google Scholar]
- Carpenter AE, Jones TR, Lamprecht MR, Clarke C, Kang IH, Friman O, Guertin DA, Chang JH, Lindquist RA, Moffat J, Golland P, Sabatini DM. CellProfiler: image analysis software for identifying and quantifying cell phenotypes. Genome Biology. 2006;7:R100. doi: 10.1186/gb-2006-7-10-r100. [DOI] [PMC free article] [PubMed] [Google Scholar]
- Chen H, Zhang WJ, Cai YB, Zhang Y, Li W. Elucidation of 2-hydroxybiphenyl effect on dibenzothiophene desulfurization by Microbacterium sp. strain ZD-M2. Biores Tech. 2008;99:6928–6933. doi: 10.1016/j.biortech.2008.01.033. [DOI] [PubMed] [Google Scholar]
- Coulaloglou CA, Tavlarides LL. Drop Size Distributions and Coalescence Frequencies of Liquid-Liquid Dispersions in Flow Vessels. AICHe Journal. 1976;22(2):289–297. [Google Scholar]
- Cussler EL. Diffusion, Mass transfer in fluid systems. Second Edition. Cambridge University Press; 1997. pp. 237–243. [Google Scholar]
- Dorobantu LS, Yeung AKC, Foght JM, Gray MR. Stabilization of oil-water emulsions by hydrophobic bacteria. Appl. Environ. Microbiol. 2004;70(10):6333–6336. doi: 10.1128/AEM.70.10.6333-6336.2004. [DOI] [PMC free article] [PubMed] [Google Scholar]
- Garcia-Ochoa F, Gomez E. Bioreactor scale-up and oxygen transfer rate in microbial processes: An overview. Biotechnol Adv. 2009;27:153–176. doi: 10.1016/j.biotechadv.2008.10.006. [DOI] [PubMed] [Google Scholar]
- Gray KA, Mrachko GT, Squires CH. Biodesulfurization of fossil fuels. Current Opinion in Microbiology. 2003;6:229–235. doi: 10.1016/s1369-5274(03)00065-1. [DOI] [PubMed] [Google Scholar]
- Jia X, Wen J, Sun Z, Caiyin Q, Xie S. Modeling of DBT biodegradation behaviors by resting cells ofGordoniasp.WQ-01 and its mutant in oil–water dispersions. Chem Eng Sci. 2006;61:1987–2000. [Google Scholar]
- Kobayashi M, Horiuchi K, Yoshikawa O, Hirasawa K, Ishii Y, Fujino K, Sugiyama H, Maruhashi K. Kinetic analysis of microbial desulfurization of model and light gas oils containing multiple alkyl dibenzothiophenes. Biosci Biotechnol Biochem. 2001;65(2):298–304. doi: 10.1271/bbb.65.298. [DOI] [PubMed] [Google Scholar]
- Kilbane JJ. Microbial biocatalyst developments to upgrade fossil fuels. Current Opinion in Biotechnology. 2006;17:305–314. doi: 10.1016/j.copbio.2006.04.005. [DOI] [PubMed] [Google Scholar]
- Lichtinger T, Reiss G, Benz R. Biochemical identification and biophysical characterization of a channel-forming protein from Rhodococcus erythropolis. J Bacteriol. 2000;182(3):764–770. doi: 10.1128/jb.182.3.764-770.2000. [DOI] [PMC free article] [PubMed] [Google Scholar]
- Marcelis CLM, van Leeuwen M, Polderman HG, Janssen AJH, Lettinga G. Model description of dibenzothiophene mass transfer in oil/water dispersions with respect to biodesulfurization. Biochem Eng J. 2003;16:253–264. [Google Scholar]
- Monticello DJ. Biodesulfurization and the upgrading of petroleum distillates. Current Opinion in Biotechnology. 2000;11:540–546. doi: 10.1016/s0958-1669(00)00154-3. [DOI] [PubMed] [Google Scholar]
- Schilling BM, Alvarez LM, Wang DIC, Cooney CL. Continuous desulfurization of dibenzothiophene with Rhodococcus rhodochrous IGTS8 (ATCC 53968) Biotechnol Prog. 2002;18:1207–1213. doi: 10.1021/bp0200144. [DOI] [PubMed] [Google Scholar]
- Shuler ML, Kargi F. Bioprocess Engineering: Basic concepts. Second Edition. Prentice Hall, Inc.; 2002. pp. 268–273. [Google Scholar]
- Skelland AHP, Lee JM. Drop Size and Continuous-Phase Mass Transfer in Agitated Vessels. AlChE J. 1981;27(1):99–111. [Google Scholar]
- Soleimani M, Bassi A, Margaritis A. Biodesulfurization of refractory organic sulfur compounds in fossil fuels. Biotech. Adv. 2007;25:570–596. doi: 10.1016/j.biotechadv.2007.07.003. [DOI] [PubMed] [Google Scholar]
Associated Data
This section collects any data citations, data availability statements, or supplementary materials included in this article.


