Abstract
Noncathartic computed tomographic colonography (CTC) could significantly increase patient adherence to colorectal screening guidelines. However, radiologists find the interpretation of noncathartic CTC images challenging. We developed a fully automated computer-aided detection (CAD) scheme for assisting radiologists with noncathartic CTC. A volumetric method is used to detect lesions within a thick target region encompassing the colonic wall. Dual-energy CTC (DE-CTC) is used to provide more detailed information about the colon than what is possible with conventional CTC. False-positive detections are reduced by use of a random-forest classifier. The effect of the thickness of the target region on detection performance was assessed by use of 22 clinical noncathartic DE-CTC studies including 27 lesions ≥6 mm. The results indicate that the thickness parameter can have significant effect on detection accuracy. Leave-one-patient-out evaluation indicated that the proposed CAD scheme detects colorectal lesions at high accuracy in noncathartic CTC.
I. INTRODUCTION
Although colorectal cancer is the second leading cause of cancer deaths in the United States, it would be preventable if its precursor colorectal lesions were removed early. However, less than 40% of age-eligible adults participate in full colorectal examinations [12]. Patient surveys indicate that the rigorous cathartic bowel cleansing required by current colorectal examinations is the single most important reason for patients to avoid colorectal screening [1].
Computed tomographic colonography (CTC) could be used to implement a full noncathartic colorectal examination. Bowel cleansing can be avoided with CTC, if a contrast tagging agent is administered orally prior to the examination to opacify residual bowel contents in CTC images [9]. However, the interpretation of noncathartic CTC images is challenging, because partial-volume tagging artifacts can imitate or distort the appearance of colorectal lesions [6]. Conventional visualization and image processing tools provide limited assistance in noncathartic CTC, because such tools have been developed for cathartic fluid-tagging CTC that does not have the challenging technical problems of noncathartic CTC [16]. Only few attempts have been made to develop dedicated computer-assisted reading tools for noncathartic CTC [6], [18], [3], [10].
In this study, we developed a fully automated computer-aided detection (CAD) scheme that uses volumetric detection and dual-energy information to indicate the locations of colorectal lesions in noncathartic CTC images. The application of such a CAD scheme could increase radiologists’ detection sensitivity and reduce the variance of inter-observer performance in noncathartic CTC.
II. METHOD
A. Materials
Twenty-five patients were prepared for a noncathartic dual-energy CTC (DE-CTC) examination by use of a one-day preparation. In the evening prior to the examination, the patients consumed LoSo Prep (E-Z-EM, Inc., New York, USA) with several cups of water. In the morning, the patients ingested 50 ml of non-ionic iodine to tag residual bowel contents. No intravenous contrast was used. The DE-CTC scans were acquired in supine and prone positions with a dual-energy CT scanner (SOMATOM Definition, Siemens) at 140 kVp and 80 kVp energies. Slice thickness was 1 mm. Expert radiologists correlated the DE-CTC data with the findings of a conventional colonoscopy examination.
All 25 DE-CTC studies were included regardless of their diagnostic quality. The studies were divided randomly into a development set of 3 studies and an independent evaluation set of 22 studies. The development set was used for parameter estimation, whereas the evaluation set was used for assessing the detection performance of the CAD scheme.
B. Automated Extraction of Colonic Lumen
For each CTC series, a linearly mixed volume is generated from the reconstructed 140 kVp and 80 kVp energy images [23] to provide shape and CT intensity information. The two energy images provide material density information.
The CT examination table, which may be visible in CTC images (Fig. 1a), is excluded from the binary mask of the abdominal region by use of a ray-tracing scheme. Non-air densities are thresholded at a CT attenuation value of −400 Hounsfield units (HU) (Fig. 1b), and orthogonal rays are projected anteriorly and posteriorly to detect the abdomen as the first object along the rays that is thicker than 7.5 mm. Voxels covered by the rays prior to hitting the abdomen are set to the background value (Fig. 1c).
Fig. 1.
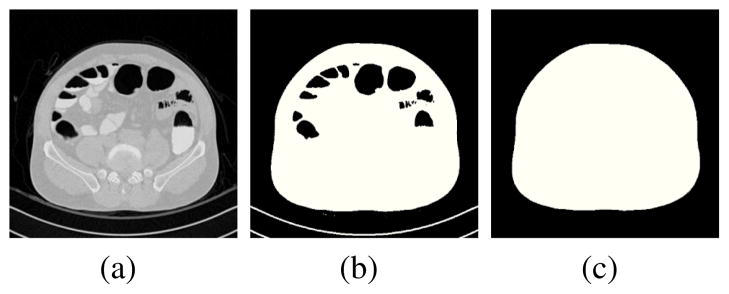
Extraction of the abdominal region. (a) Axial CT image. (b) Binary mask of non-air densities. (c) Final binary mask of the abdomen.
To ensure that the colonic lumen is not connected to the air surrounding the abdomen due to limited field-of-view, the surface of the abdomen is defined by use of an energy-minimizing deformable model [11]. At each CT image, the contour of the model is defined as c(s) = (x(s),y(s))T, where s∈[0,1], and x(•) and y(•) are coordinate functions. The coordinate functions are initialized by projecting rays around the region of CT gantry onto the surface of the abdominal binary mask (Fig. 1c). The contour is evolved by minimizing the functional ε(c) = S(c) + P(c), where
| (1) |
and
| (2) |
Equation (1) denotes internal deformation energy, where the physical parameter functions w1(s) and w2(s) determine the extent to which the model can stretch or bend at a surface point. Equation (2) attracts the model to the intensity edges of the underlying abdominal skinline; Gσ * I denotes the CT image data convolved with a Gaussian smoothing filter, and C controls the relative effect of (2).
The next step is to identify abdominal lumen components that include the visible regions of colon, small bowel, stomach, and the lung bases. These can contain air or tagged materials. Air-filled regions are identified by thresholding of CT attenuation values < −500 HU [21]. However, CT attenuation values of tagged materials may overlap with those of osseous structures or soft tissue. The latter can be separated by use of the dual-energy information. By plotting the CT numbers of the 140 kVp and 80 kVp images to a plane (Fig. 2a), we see that soft-tissue materials (blue crosses) are mapped along the line of identity (dotted line) representing water-like materials (effective atomic number of Z = 7), whereas heavier bone-like (calcium, Z = 20) and tagged (iodine, Z = 53) materials are mapped above the line of identity. By defining the dual-energy index feature [7]
Fig. 2.
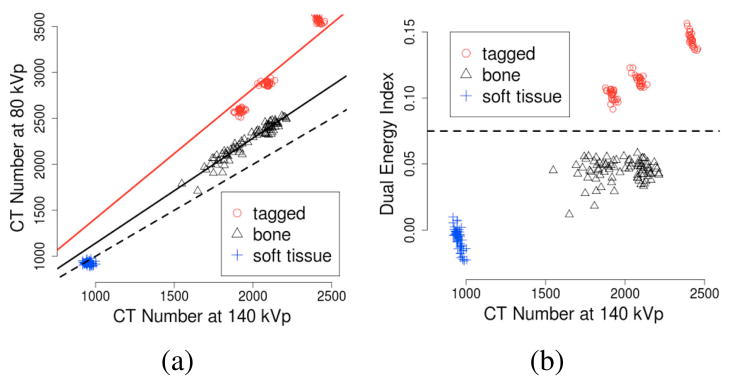
Sampled values of tagged, osseous, and soft-tissue materials from clinical dual-energy CT scans. (a) The CT values of materials with different effective atomic numbers are mapped along their unique characteristic lines. Dotted line indicates the line of identity of water-like materials. (b) Dotted line indicates a dual-energy index threshold for separating iodine from other materials.
| (3) |
where v80 and v140 are the CT attenuation values of the 80 kVp and 140 kVp images, respectively, we can identify iodine by thresholding of DEI > 0.075 (Fig. 2b).
The region of colonic lumen is identified by an analysis of air-filled and tagged lumen regions. A path is calculated through each region [5]. Three anatomy-based landmarks are detected automatically based on the locations of the lumen regions: rectum, descending colon, and cecum. A lumen path is traced through the colon starting from the segment containing the rectum, through descending colon, and into the cecum. Segments disconnected due to obstruction are reconnected by use of a rule-based scheme [16]. The final region of colonic lumen is extracted by application of a coupled region-growing method on the lumen path [16].
C. Volumetric Detection
To perform volumetric detection, we extract a thick target region encompassing the colonic surface. Let L̂ denote the extracted region of colonic lumen (Figs. 3a and 3b). The target region is calculated by
Fig. 3.
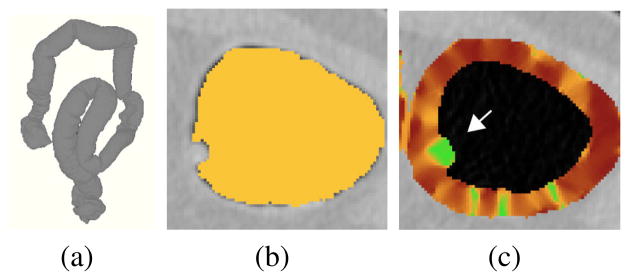
Calculation of the volumetric shape index (VSI). (a) Colon extraction provides a three-dimensionally extracted colonic lumen. (b) Detail of the extracted colonic lumen (yellow color) on an axial CT image. (c) Color mapping of the VSI values on an extracted colonic target region of (b): high values (green color) indicate a lesion (arrow).
| (4) |
where DL̂ denotes morphological dilation of L̂. If the lumen surface is located at the iso-intensity level of −500 HU (Fig. 3b), the diameter of the dilation element that encompasses the colonic surface and its partial-volume region is approximately 2.5 mm. However, it may be desirable to use other wall-thickness values to optimize CAD performance. Let t denote the desired thickness of the target region in millimeters, and let Ir denote the spatial CT resolution in millimeters (the physical image resolution data are provided by the Digital Imaging and Communications in Medicine (DICOM) file header). Because the average in-plane CT image resolution is approximately 0.7 mm, the region of calculated wall is largely unaffected by a change of t smaller than Ir. However, if t > 2.5 + 2nIr (n∈ℕ+), it is necessary to erode the lumen region L̂ by n layers of surface voxels before the application of (4) to keep the extracted region centered at around the colonic surface.
Lesion candidates are detected within the extracted target region by use of a shape index (SI) feature. The SI can be calculated as [8]
| (5) |
where k1(p) and k2(p) are the principal curvatures of a surface passing through a voxel p. The principal curvatures can be calculated in terms of the Gaussian curvature, K(p), and mean curvature, H(p), of the surface, as [22]
| (6) |
To calculate the SI at an arbitrary voxel, we note that the Gaussian and mean curvatures can be calculated in terms of the first- and second-order partial derivatives of the underlying intensity data, v, as
| (7) |
and
| (8) |
where (i,j,k) = Perm(x,y,z) = {(x,y,z),(y,z,x),(z,x,y)}. Thus, by combining (5), (6), (7), and (8), we can calculate a volumetric SI (VSI) at any voxel (Fig. 3c). Unlike the conventional SI that characterizes local geometry of a surface, the VSI characterizes local volumetric intensity flow at a point.
Highest values of the VSI indicate bulbous densities that can represent colonic lesions [22]. Before the calculation of the VSI, tagged materials are pseudo-subtracted from the CTC data to minimize their effects on shape calculation [16]. To detect lesion candidates, the values of VSI are thresholded at VSI≥0.7, and the sites of lesion candidates are identified by use of connected component analysis of the thresholded voxels. The connected components are subjected to a dedicated segmentation algorithm for extracting complete regions of detected lesions [15].
D. Reduction of False Positives
The detected lesion candidates represent not only true-positive detections but also FP detections from various sources [19]. A random forest (RF) classifier [2] is used to classify the CAD detections into true positives and false positives. The RF is an ensemble of decision trees, where the nodes represent hyper-rectangles dividing the input feature space into disjoint regions. The leaves of the decision trees represent predictions of the correct category of an input sample. To perform a prediction on an input sample, the decision trees vote for the correct category. The votes are aggregated into a single RF prediction by majority vote. We have previously shown that an RF classifier can outperform state-of-the-art support vector machines in the classification of CAD detections in CTC [20].
The input features of the RF are calculated from statistical moments and Haralick features of voxel-based features. The voxel-based shape features include the VSI and gradient concentration features [14], and texture features include the DEI, the CT number of the mixed energy volume, and a dual-energy ratio feature DER = v80/(1 + v140).
To determine optimal features for the RF classifier, zero-variance features and those having >0.8 correlation with other features are eliminated from the input set of all features. The final features are chosen by the application of recursive feature elimination.
III. EVALUATION
The detection accuracy of the CAD scheme was assessed by use of a leave-one-patient-out method. To investigate the effect of the thickness of the extracted volumetric target region on detection performance, the detection accuracy was assessed at wall-thickness values of 3 mm, 4 mm, 5 mm, and 6 mm. Because of limited CT image resolution, the specified wall-thickness value (t) should be understood as the minimum thickness of the extracted region. That is, the actual thickness of the extracted region, t̂, may vary between t≤t̂ < t + Ir.
A colonoscopy-confirmed lesion was considered to be detected correctly by CAD, if the center of a lesion candidate detected by CAD was within the radius of the center of a true lesion in CTC data. All other CAD detections were considered as false positives. Because it is not practical for a radiologist to review large numbers of CAD detections, the CAD scheme was not allowed to display more than 15 detections (those with highest lesion likelihood) per patient.
IV. RESULTS
There were 11 lesions ≥10 mm and 16 lesions 6 – 9 mm in largest diameter in the 22 patients. These included 4 cancers, 20 adenomas, and 3 hyperplastic lesions.
Fig. 4 shows the effect of the thickness of target region on the per-lesion detection sensitivity of the CAD scheme. For lesions 6 – 9 mm in size, the detection sensitivity was highest at t = 4. At t = 3, the detection sensitivity was significantly lower (p < 0.01). At t = 5 and t = 6, the reduction in detection sensitivity did not reach statistical significance (p = 0.22 and p = 0.05, respectively). For lesions ≥10 mm in size, the detection sensitivity was not affected by changes of t, but at 100% sensitivity the average number of FP detections per patient was lowest at t = 4 (2.8; highest: 7.7 at t = 5).
Fig. 4.
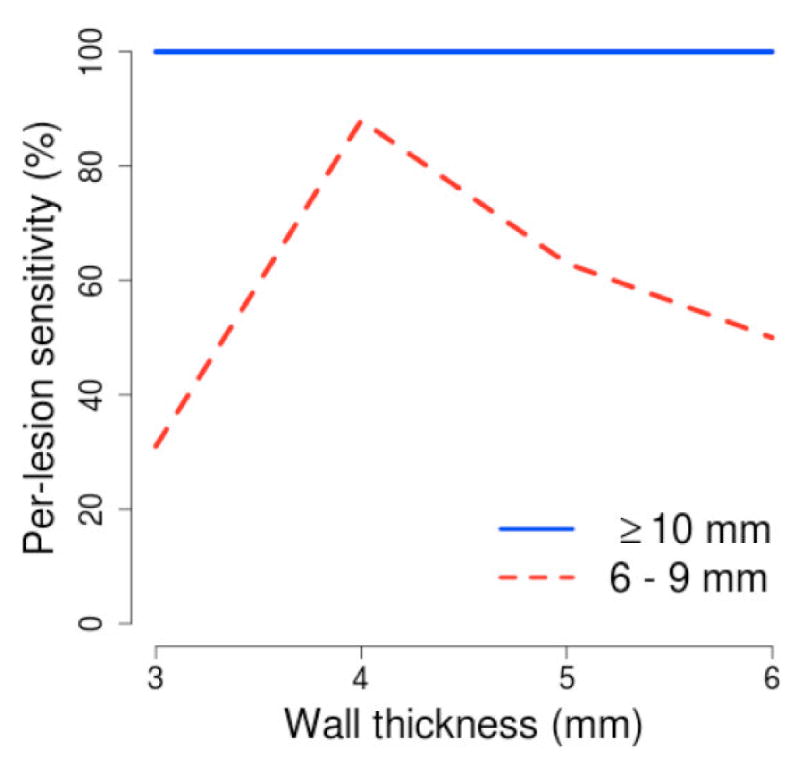
Per-lesion sensitivity of the CAD scheme at different thicknesses of the extracted wall region.
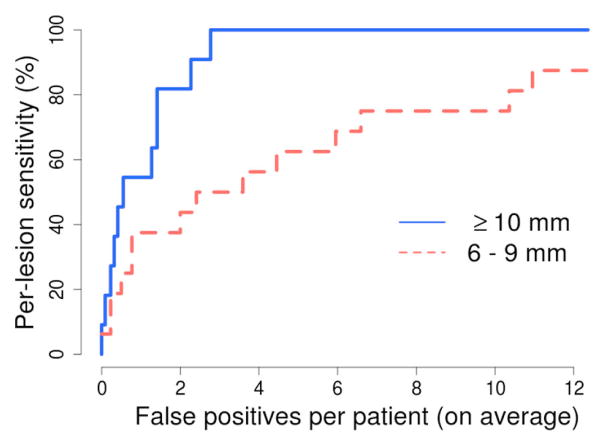
Fig. 5 shows the free-response receiver operating characteristic curve of the detection performance of the CAD scheme for the 27 lesions ≥6 mm in size at the optimal wall thickness of 4 mm.
Fig. 5.
Per-lesion detection accuracy of the CAD scheme at the optimal wall thickness of 4 mm. The number of CAD detections was limited to ≤15 per patient.
V. DISCUSSION
Conventional CAD for CTC detects lesions by use of an explicit colon surface that can be distorted by image noise and partial-volume effects. Our volumetric detection method provides a more robust scheme that provides higher sensitivity to subtle lesions [17].
The use of dual-energy information makes it possible to extract the target region and to reduce false-positive detections more precisely than with conventional single-energy CTC. This yields statistically significant improvement in detection accuracy over conventional CAD [13].
The results of this study indicate that the thickness of the extracted target region can have significant effect on detection accuracy (Fig. 4). The effect is particularly noticeable in the detection of lesions 6 – 9 mm in size.
Noncathartic CTC is one of the most promising new approaches to colorectal screening, but clinical studies have indicated large variation in inter-observer performance [6]. Although CAD could be used to reduce inter-observer variance and to increase reader sensitivity [4], noncathartic CTC presents significant technical challenges for CAD [16]. In a recent study, a surface-based CAD scheme for noncathartic CTC was able to detect only 86% of polyps ≥10 mm in size at 11.5 FP detections per patient (smaller polyps were not considered). The high detection accuracy of our volumetric CAD scheme suggests that it has potential to increase the sensitivity and reduce inter-observer variance of noncathartic CTC examinations.
Acknowledgments
We thank Partners Research Computing for providing high-performance computing services.
Footnotes
This work was supported by grants from Prevent Cancer Foundation and NIH/NCI CA140934, CA095279, CA139600, and CA131718.
Contributor Information
Janne J. Näppi, Email: jnappi@partners.org.
Hiroyuki Yoshida, Email: yoshida.hiro@mgh.harvard.edu.
References
- 1.Beebe T, Johnson CD, Stoner SM, Anderson KJ, Limburg PJ. Assessing attitudes toward laxative preparation in colorectal cancer screening and effects on future testing: potential receptivity to computed tomographic colonography. Mayo Clinic Proc. 2007;82:666–71. doi: 10.4065/82.6.666. [DOI] [PubMed] [Google Scholar]
- 2.Breiman L. Random forests. Mach Learn. 2001;45:5–32. [Google Scholar]
- 3.Cai W, Yoshida H, Zalis ME, Näppi JJ, Harris GJ. Informatics in radiology: electronic cleansing for noncathartic CT colonography: a structure-analysis scheme. Radiographics. 2010;30:585–602. doi: 10.1148/rg.303095154. [DOI] [PMC free article] [PubMed] [Google Scholar]
- 4.Dachman AH, Obuchowski NA, Hoffmeister JW, Hinshaw JL, et al. Effect of computer-aided detection for CT colonography in a multireader, multicase trial. Radiology. 2010;256:827–35. doi: 10.1148/radiol.10091890. [DOI] [PMC free article] [PubMed] [Google Scholar]
- 5.Frimmel H, Näppi J, Yoshida H. Centerline-based colon segmentation for CT colonography. Med Phys. 2005;32:2665–72. doi: 10.1118/1.1990288. [DOI] [PubMed] [Google Scholar]
- 6.Johnson CD, Manduca A, Fletcher JG, MacCarty RL, Carston MJ, Harmsen WS, Mandrekar JN. Noncathartic CT colonography with stool tagging: performance with and without electronic stool subtraction. Am J Roentgenol. 2008;190:361–66. doi: 10.2214/AJR.07.2700. [DOI] [PubMed] [Google Scholar]
- 7.Johnson TRC, Krauss B, Seldmair M, Grasruck M, et al. Material differentiation by dual energy CT: initial experience. Eur Radiol. 2006;17:1510–7. doi: 10.1007/s00330-006-0517-6. [DOI] [PubMed] [Google Scholar]
- 8.Koenderink J, Doorn RC. Surface shape and curvature scales. Image and Vision Computing. 1992;10:557–565. [Google Scholar]
- 9.Lefere P, Gryspeerdt S, Baekelandt M, Van Holsbeeck B. Laxative-free CT colonography. Am J Roentgenol. 2004;183:945–48. doi: 10.2214/ajr.183.4.1830945. [DOI] [PubMed] [Google Scholar]
- 10.Linguraru GM, Panjwani N, Fletcher GJ, Summers RM. Automated image-based colon cleansing for laxative-free CT colonography computer-aided polyp detection. Med Phys. 2011;38:6633–42. doi: 10.1118/1.3662918. [DOI] [PMC free article] [PubMed] [Google Scholar]
- 11.McInerney T, Terzopoulos D. Deformable models. In: Bankman I, editor. Handbook of Medical Image Processing and Analysis. Academic Press; San Diego: 2008. pp. 145–66. [Google Scholar]
- 12.Meissner HI, Breen N, Klabunde CN, Vernon SW. Patterns of colorectal cancer screening uptake among men and women in the United States. Cancer Epidemiol Biomarkers Prev. 2006;15:389–94. doi: 10.1158/1055-9965.EPI-05-0678. [DOI] [PubMed] [Google Scholar]
- 13.Näppi J, Kim SH, Yoshida H. Automated detection of colorectal lesions with dual-energy CT colonography. SPIE Medical Imaging. 2012 In press. [Google Scholar]
- 14.Näppi J, Yoshida H. Automated detection of polyps in CT colonography: evaluation of volumetric features for reduction of false positives. Acad Radiol. 2002;9:386–397. doi: 10.1016/s1076-6332(03)80184-8. [DOI] [PubMed] [Google Scholar]
- 15.Näppi J, Yoshida H. Feature-guided analysis for reduction of false positives in CAD of polyps for CT colonography. Med Phys. 2003;30:1592–1601. doi: 10.1118/1.1576393. [DOI] [PubMed] [Google Scholar]
- 16.Näppi J, Yoshida H. Fully automated three-dimensional detection of polyps in fecal-tagging CT colonography. Acad Radiol. 2007;25:287–300. doi: 10.1016/j.acra.2006.11.007. [DOI] [PMC free article] [PubMed] [Google Scholar]
- 17.Näppi J, Yoshida H. In: Yoshida H, editor. Automated scheme for preparation-independent detection of colorectal lesions with comparison to conventional CAD in CT colonography; Proc MICCAI 2008 Workshop on Computational and Visualization Challenges in the New Era of Virtual Colonoscopy; 2008. pp. 127–34. [Google Scholar]
- 18.Näppi J, Yoshida H. Virtual tagging for laxative-free CT colonography: pilot evaluation. Med Phys. 2009;36:1830–8. doi: 10.1118/1.3113893. [DOI] [PMC free article] [PubMed] [Google Scholar]
- 19.Näppi JJ, Nagata K. Sources of false positives in computer-assisted CT colonography. Abdom Imaging. 2011;36:153–64. doi: 10.1007/s00261-010-9625-5. [DOI] [PubMed] [Google Scholar]
- 20.Näppi JJ, Regge D, Yoshida H. Comparative performance of random forest and support vector machine classifiers for detection of colorectal lesions in CT colonography. Lect Notes Comput Sc. 2012;7029:27–34. [Google Scholar]
- 21.Park SH, Choi EK, Lee SS, Woo JY, et al. Linear polyp measurement at CT colonography: 3D endoluminal measurement with optimized surface-rendering threshold value and automated measurement. Radiology. 2008;246:157–67. doi: 10.1148/radiol.2453061930. [DOI] [PubMed] [Google Scholar]
- 22.Yoshida H, Näppi J. Three-dimensional computer-aided diagnosis scheme for detection of colonic polyps. IEEE Trans Med Imaging. 2001;20:1261–74. doi: 10.1109/42.974921. [DOI] [PubMed] [Google Scholar]
- 23.Yu L, Christner JA, Leng S, Wang J, Fletcher JG, McCollough CH. Virtual monochromatic imaging in dual-source dual-energy CT: radiation dose and image quality. Med Phys. 2011;38:6371–9. doi: 10.1118/1.3658568. [DOI] [PMC free article] [PubMed] [Google Scholar]


