

Abstract
Stable pH is an established biomarker of health, relevant to all tissues of the body, including the heart. Clinical monitoring of pH in a practical manner, with high spatiotemporal resolution, is particularly difficult in organs such as the heart due to its soft mechanics, curvilinear geometry, heterogeneous surfaces and continuous, complex rhythmic motion. The results presented here illustrate that advanced strategies in materials assembly and electrochemical growth can yield interconnected arrays of miniaturized IrOx pH sensors encapsulated in thin, low-modulus elastomers to yield conformal monitoring systems capable of non-invasive measurements on the surface of the beating heart. A thirty channel custom data acquisition system enables spatiotemporal pH mapping with a single potentiostat. In-vitro testing reveals super-Nernstian sensitivity with excellent uniformity (69.9 ± 2.2 mV/pH), linear response to temperature (−1.6 mV/°C), and minimal influence of extracellular ions (< 3.5 mV). Device examples include sensor arrays on balloon catheters and on skin-like stretchable membranes. Real-time measurement of pH on the surfaces of explanted rabbit hearts and a donated human heart during protocols of ischemia-reperfusion illustrate some of the capabilities. Envisioned applications range from devices for biological research, to surgical tools and long-term implants.
Keywords: heart ischemia, microfabrication, pH sensor, spatiotemporal mapping, stretchable electronics
1. Introduction
pH homeostasis is critical to human health. Variation in pH is indicative of a physiological alteration including ischemia,[1,2] atherosclerotic plaque development,[3] inflammation,[4,5] and tumor growth.[6–8] It is standard practice for researchers to monitor pH in the bulk environment of cell cultures and ex-vivo tissues to quantify the metabolic state of their preparation. The use of pH as an indicator in the clinic, however, has not been fully realized. Cardiac disease, which currently represents the leading cause of the death in the Western world, provides an example where pH monitoring could play an important role. Typical treatments involve open chest or minimally invasive surgeries, cardiac catheterizations, cardiac ablations, and use of implantable therapeutic systems.[9] Each case requires devices that can effectively monitor, treat, and prevent symptoms. Instability in pH levels is a well-established marker of metabolic abnormality, with strong potential to provide clinicians with valuable information on the condition of the heart, through specialized surgical tools or advanced implantable systems.
The continuous motion of the heart, its low stiffness, complex, curvilinear shape and heterogeneous surfaces create significant engineering challenges in the development of technologies for measuring and spatially mapping pH. One option is to use non-contact imaging techniques based on nuclear magnetic resonance (NMR) or near-infrared diffuse reflectance spectroscopy (NIRS).[10–12] Disadvantages include the need for high cost, large-scale instrumentation, with long data acquisition and processing times. An alternative involves electrochemical sensors that directly contact the cardiac surface. Conventional pH sensors (i.e. glass electrodes), however, provide only a single measurement channel, in forms that are rigid, hard and bulky.[13] Here, precision, high speed probe scanning is required for spatial mapping, thereby preventing concurrent temporal measurement over areas of interest and limiting practical utility. Miniaturized pH sensors on bendable plastic substrates[1,2,13] avoid some of these drawbacks, but their inability to stretch or conform to complex three dimensional surfaces prevent intimate integration over substantial areas of the heart in ways that do not constrain natural motions. The systems introduced here involve arrays of sub-millimeter-scale, precision pH sensors distributed on thin elastic membranes. The results enable soft, conformal lamination onto the time-dynamic epicardial surfaces, either directly as sheets or indirectly through integration with catheter balloons. The overall architectures represent advanced embodiments of recently reported thin cardiac mesh devices[14], modified for use in pH sensing.
The systems exploit arrays of miniaturized sensors fabricated in a parallel fashion using thin film deposition, etching and patterning methods adapted from those used in the semiconductor industry. The techniques of transfer printing enable integration with silicone membranes as substrates, where strategic choices in overall configurations, informed by theoretical mechanics analysis, enable reversible, elastic responses to large-strain deformations. Various solid-state metal oxides can be considered for the sensing electrodes, including PtO2, IrOx, RuO2, OsO2, Ta2O5, RhO2, TiO2 and SnO2.[15,16] Among these materials, iridium oxide exhibits high sensitivity (i.e. super-Nernstian responses to pH change) with stability over a wide range of pH values, rapid response times, minimal potential drift, outstanding chemical selectivity, and high durability.[17] Electroplating from relatively inexpensive chemical compounds of iridium allows cost-effective, site-specific deposition onto target substrates.[18] Such electroplated iridium oxides are known to provide levels of precision and reproducibility in pH sensing electrodes that are superior to those of counterparts form by physical vapor deposition or high-temperature growth.[19–22]
In this paper, we describe two platforms for sensing pH using IrO2 as the contact electrode: (1) a balloon catheter that incorporates three independent pH sensors and (2) a stretchable sheet that incorporates a matrix array of thirty pH sensors. For the second case, custom data acquisition systems use a single-channel potentiostat with a computer-controlled relay circuit. In vitro evaluation of individual sensors indicates super-Nernstian sensitivity with excellent device-to-device uniformity in performance (69.9 ± 2.2 mV/pH). Linear changes in the response with temperature, in accordance with the Nernst equation (−1.6 mV/°C), and minimal selectivity over interfering extracellular ions (< 3.5 mV) within physiologically relevant concentrations, represent other key attributes. In vivo tests on both explanted rabbit hearts and a donated human heart subjected to ischemia-reperfusion demonstrate capabilities in real-time pH recording.
2. Results
2.1. Sensor design and fabrication
The arrays consisted of gold traces encapsulated by layers of polyimide (PI), with openings that defined sensing electrodes and contact pads. The interconnections adopted thin, filamentary serpentine designs to minimize material strains when subjected to overall mechanical deformation.[23–25] The designs are configured explicitly, using guidance from computational mechanics, to minimize material strains and interfacial stresses, throughout the range of operation. Transfer printing enabled integration onto an elastomer sheet or an inflatable balloon catheter. Electrochemical deposition formed layers of IrOx on the gold electrodes, to complete the fabrication (Figure 1; details in experimental section).
Figure 1.
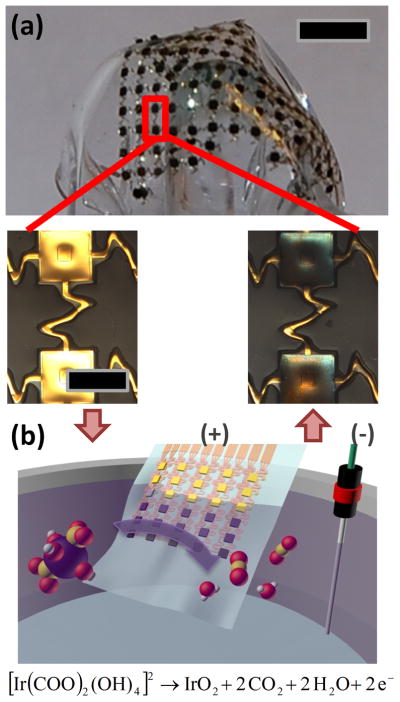
(a) Picture of a representative, thin compliant array of pH sensors. Magnified images in the lower panels show gold electrodes before (left) and after (right) electroplating IrOx. The scale bars are 5 mm and 0.5 mm for the upper and the lower images, respectively. (b) Schematic illustration of chemical reactions associated with IrOx electroplating.
2.2. Multiplexing data acquisition
A custom-built data acquisition system enabled collection of pH data from multiple sensors with a single potentiostat. A computer-controlled relay sequentially connected individual pH sensors (working electrodes) for measurement of the open circuit potential (OCP) referenced to an Ag/AgCl electrode (Figure 2a). For in-vitro and ex-vivo experiments, the dwell times at each electrode were one second (Figure 2b). The minimum times required to obtain reproducible OCP over pH values of 4 to 10 were ~0.5 seconds (See supplemental information). Figure 2b–e summarize the signal processing of pH data recorded from standard buffer solutions. Figure 2b and 2c show raw data recorded over 10 seconds in a solution with pH of 7 and over 23 minutes, switched from 7, to 4, to 7, to 10, and to 7. Electrical artifacts associated with operation of the relay were removed from the data by suitable software filters. The OCP values were labeled with their corresponding pH sensors (Figure 2d) and then combined over the entire temporal range (Figure 2e).
Figure 2.

(a) Schematic illustration of a multiplexed data acquisition system that uses a single channel potentiostat and a computer-controlled array of relay circuits. The relays allow electrical connection between the working electrode (W.E.) of the potentiostat and any one of the sensors in the array. Reference and counter electrodes (R.E. and C.E., respectively) are immersed in the common solution bath with the pH sensor array. (b–e) An example of data acquisition from 4 pH sensing electrodes, where the connection to the W.E. alternates every one second with a sequence of 1 → 1 → 2 → 3 → 4, where the numbers represent sensors in the array. The samples were immersed in standard pH buffer solutions of pH 7 → 4 → 7 → 10 → 7, each for 4~5 minutes. Here, raw data were acquired from the first 10 seconds (b) and from the entire measurement (c). Noise associated with switching of the relays was digitally filtered after data acquisition. Each data point was labeled with the sensor number for the first 10 seconds (d) and for the entire measurement (e).
2.3. Potentiometric characterization and pH calibration
Hydrous IrOx pH sensors are known to have high sensitivity, and super-Nernstian response (i.e. sensitivity higher than 59 mV/pH at room temperature). The chemical origins of this behavior are described in the experimental section. Two different methods defined the sensitivity. For measurements over a wide range of pH values, sensor arrays with 30 pH electrodes were submerged in pH solutions of known values (4,6,7, and 9) and OCP values from each electrode were recorded. The average sensitivity of a representative array was 69.9 ± 2.2 mV/pH, with a highly linear response of R2 = 0.997 ± 0.005 (Figure 3a). The majority (24 out of 30) of sensitivity values were between 69 to 71 mV/pH (Figure 3b).
Figure 3.

(a) A collection of open circuit potential (OCP) values as a function of pH measured from an array of 30 pH sensing electrodes. (b) Histogram of the distribution of pH sensitivities obtained from data like those shown in (a). (c) Example of data from a calibration protocol that involves adding acidic buffer into a universal buffer solution, while measuring OCP (blue line) and pH values (commercial glass electrode; red line). (d) OCP as a function of pH extracted from data shown in (c).
Sensitivity was also measured over a narrow, physiological relevant range of pH. A representative experiment performed with a single pH electrode appears in Figure 3c,d. The pH array was immersed in a basic (7.6) universal buffer solution (Britton-Robinson buffer) and acidic buffer was added at ~200 second intervals while pH was monitored with a commercial glass electrode. The addition of acidic buffer resulted in a stepwise pH decrease measured by the glass electrode (Figure 3c-red line) and a stepwise increase in OCP (Figure 3c-blue line). Figure 3d shows a plot of the OCP as a function of pH. Here, the sensitivity is 71.7 mV/pH with a R2 value of 0.994. All sensitivity values were consistent with previous reports of electrochemically deposited IrOx electrodes.[1,2,17,19–22,26–29]
2.4. Influence of temperature and ion interference
The output of pH sensors, like other chemical sensors, change with temperature and interfering ions. See experimental details for a description. The influence of temperature on OCP was measured from an array of 16 electrodes in 1x PBS solution with pH value of 7.4 (Figure 4a). The data exhibited a linear dependence of −1.63 ± 0.02 mV/ °C (R2 = 0.995 ± 0.03) for temperatures between 20 and 60 °C. This shift corresponds to ~0.1 pH for a temperature change of 5 °C.
Figure 4.

(a) Temperature dependence of OCP values obtained from 16 pH sensing electrodes. As indicated by the average and standard deviation of the slope of these linear fits, −1.63 ± 0.02 mV/°C, all pixels share the same linear dependence on temperature. (b) [K+] and [Mg2+] ion interference, quantified by 30 electrodes. Starting from 1xPBS solution, interference ions were added to monitor the change in OCP values. (c) Histograms of changes in OCP (Δ OCP) obtained from [K+] and [Mg2+] of 16.7 and 16.0 mM, respectively.
Various cations can interfere with the OCP signal by participating in the ion exchange process in place of protons. Previous publications report that OCP values may vary with the existence of the cations, whereas the sensitivity values of pH sensors (mV/pH) is nearly unaffected.[17] We examined the effect of two cations that are abundant in the extracellular space during ischemia, [K+] and [Mg2+]. The influence of each cation on the OCP was determined by adding chloride salts in a 1x PBS solution. The results are summarized in Figure 4b. The minimum and maximum concentrations that were tested extend beyond the range expected from an ischemic heart.[1,2,30,31] The range of OCP variation was less than 3.5 mV, which corresponds to ~0.05 pH. The distribution of the relative change in OCP from an array of 30 pH electrodes submerged in solutions with high concentrations of K+ and Mg2+ (16.7 and 16. mM respectively) is shown in Figure 4c. The degree of ionic influence is in good agreement with previous publications.[17]
2.5. In-vitro mapping of pH
The efficacy of pH mapping was tested in an in-vitro system, in which an array of 30 pH sensing electrodes was employed to monitor the diffusion of acid from a reservoir to a surrounding 1x PBS solution. The reservoir consisted of a PDMS mold with an “I” shaped opening filled with medical gauze soaked with a commercial pH 4 buffer solution (Figure 5a). Spacers between the array and the reservoir allowed diffusion of acid and liquid electrolyte (i.e. PBS solution) across the sensing surfaces and the reference electrode. Figure 5b illustrates a snapshot after 5 minutes of diffusion. Here, the measured acidic pH distribution follows the shape of the opening, clearly indicating that the electrode array was capable of mapping the evolution of pH. Movie 1 in Supporting Information shows the time-dependent evolution of the acid diffusion.
Figure 5.
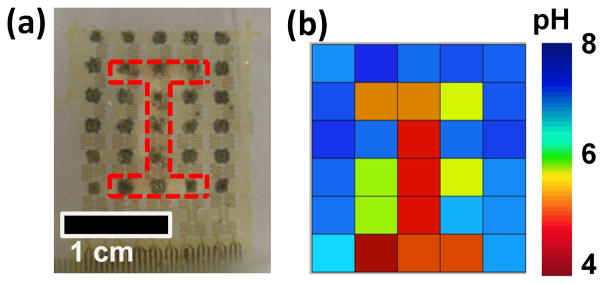
pH mapping images from an in-vitro system where acid (pH 4) spreads from an reservoir to 1x PBS solution (pH 7.4). (a) Photograph of the pH sensor array placed on top of a reservoir that has an “I” shaped opening (red dashed line), which allows slow diffusion of acid into PBS. (b) pH values captured by the pH sensor array. Time-dependent evolution of the pH can be found in Movie 1 in the supporting information.
2.6. Monitoring cardiac pH with a balloon catheter
The balloon catheter pH sensor device was used with a single ex-vivo rabbit heart preparation, which underwent 30 minutes of global no-flow ischemia followed by reperfusion. The balloon catheter was positioned on the epicardial surface of the left ventricle (LV) near the first diagonal of the left anterior descending artery (LAD) (Figure 6a). Figure 6b displays the perfusion pressure (black) and pH data (pink) during baseline, ischemia, and reperfusion. The pH was stable at 7.32 during baseline recordings and decreased slowly to 5.60 over 30 minutes of no-flow ischemia. Upon reperfusion, the pH recovered quickly and stabilized at 7.40. Electrophysiological parameters including RR interval, QRS complex duration, QTc, and ST elevation were assessed from the far-field electrocardiogram at several time points during the protocol (Figure 6c,e). As expected, ischemia induced an increase in RR interval, a slowing of ventricular conduction (widening of QRS complex), shortening of repolarization (decreased QTc), and increased ST elevation. Reperfusion did not fully restore electrophysiological parameters back to baseline values. The RR interval continued to be elevated similar to ischemic conditions, while the QRS duration, QTc, and ST elevation improved compared to ischemic values.
Figure 6.

Balloon catheter integrated with pH sensors and tested in an epicardial mode. (a) Ex-vivo rabbit heart preparation with balloon catheter turned so pH electrodes (three dark rectangles) are visible. The pink circle highlights sensor used in recordings and pink asterisk indicates location of sensor during experiment. (b) Pressure trace (black) and pH (pink) recordings during baseline, no-flow ischemia, and reperfusion. (c) RR intervals calculated during baseline, no-flow ischemia (10, 20, 25 minutes), and reperfusion (5, 10, 20 minutes). (d) Representative far-field electrocardiograms at baseline, 20 minutes of ischemia, and 10 minutes of reperfusion. (e) Calculated QRS duration (left), QTc (center), and ST elevation relative to the amplitude of the R wave (right).
RA—right atrium; RV—right ventricle; LA—left atrium; LV—left ventricle; B—baseline
2.7. Monitoring cardiac pH with an array of pH sensors
The membrane based pH arrays were tested during global no-flow ischemia on both ex-vivo rabbit heart preparations (n=3 rabbit) and a single human right ventricle (RV) preparation. Figure 7 summarizes the spatiotemporal changes in pH for the human RV preparation. Figure 7a displays the array on the endocardial surface of the RV wedge (left) as well as the baseline pH map and far-field electrocardiogram (ECG). Three pH sensors (blue, pink, purple circles) are highlighted on the array. Their spatiotemporal changes appear in Figure 7b,c,d. The baseline pH map highlights that pH was initially uniform over the surface of the heart (7.32–7.38). (One pH sensor malfunctioned during experimentation, as indicated with a gray rectangle.) The baseline far-field ECG for the tissue preparation is shown in black, where the asterisk highlights an artificial pacing stimulus.
Figure 7.

pH array in membrane tested on a human right ventricular wedge preparation. (a) Human right ventricular wedge preparation with endocardial surface in contact with pH array (left). Opened colored circles (navy, pink, purple) highlight the location of pH sensors followed in (b), (c), and (d). pH map (right, top) and far-field electrocardiogram (right, bottom) before the onset of ischemia. (b) Pressure trace (black) and pH (navy, pick, purple) recordings during, baseline, no-flow ischemia, and reperfusion. (c) pH maps (left) after 2, 10, and 18 minutes (last electrical capture) of ischemia. Far-field electrocardiograms (right) after 2, 10, 18 minutes of ischemia (cyan) with the baseline electrocardiogram (black) underneath for comparison. (d) pH maps (left) after 2, 10, and 20 minutes of reperfusion. Far-field electrocardiograms (right) after 2, 10, 20 minutes of reperfusion (grey) with the baseline electrocardiogram (black) underneath for comparison. Black asterisks in electrocardiograms highlight artificial pacing stimulus.
Figure 7b is a plot of perfusion pressure (black) and pH data from 3 electrodes (blue, pink, purple) during baseline, ischemia, and reperfusion. Figure 7c shows pH maps (left) and far-field ECGs (right) at 2, 10, and 18 minutes (last electrical capture) of ischemia. pH decreased non-uniformly across the endocardial surface of the tissue. After 18 minutes of ischemia the minimum and maximum pH were 6.10 and 7.05 respectively. The far-field ECG emphasizes the predictable response to ischemia. In particular, conduction slowed (rightward shift of main peak) and repolarization shortened compared to baseline. Figure 7d displays pH maps (left) and far-field ECGs (right) after 2, 10, and 20 minutes of reperfusion. pH quickly increased to a stable level and after 10 minutes of reperfusion minimal additional changes in pH occur. pH never recovered to baseline levels at any locating being monitored.
3. Discussion
pH is a critical marker that provides quick and accurate information on the health or disease of a biological tissue. The extracellular pH change of ischemic cardiac tissue is predictable and the molecular mechanism is well understood. Without O2, oxidative phosphorylation can no longer proceed, thus cardiomyocytes exclusively use glycolysis for ATP production. A byproduct of glycolysis is H+, which is partially removed from the cell via the Na+-H+ exchanger leading to acidosis.[32,33] Upon reperfusion, O2 is reintroduced and oxidative phosphorylation begins to be the major contributor to ATP production. The quick return of pH, however, has been linked to the opening of the mitochondrial permeability transition pore (mPTP), which leads to the activation of caspases, myocyte death, and scar formation.[32]
Despite the fact that the basis for pH alteration is well understood during ischemia-reperfusion, monitoring pH has never been exploited in the clinic, especially in implantable devices, due to technical challenges in device design. A pH signal is easily quantified compared to ECG parameters and could serve as an additional marker for clinicians. Integrating IrOx based sensors in array formats on ultrathin, stretchable elastomer substrates bypasses many of the shortcomings of previously reported technologies. Among the various strategies that enable this type of stretchable technology, transfer printing as a scheme for materials integration is extremely important. This approach separates considerations in optimal materials and device configurations from constraints associated with choice of substrate.[34–36] This same advantage allows use of unconventional device platforms such as inflatable balloon catheters.[37] These and other enabled formats for biomedical devices have potential to provide unforeseen clinical possibilities via non-invasive physical contact with both external and internal surfaces of the tissues.[38–39]
While monitoring pH with a balloon catheter, we observed a large pH change of 1.72 units. Previously, Yan and Klebér [40] determined that the extracellular pH change of rabbit papillary muscle was .98 units in the presence of erythrocytes versus 1.62 units in the absence of erythrocytes after 18 minutes of ischemia. Marzouk et al reported extracellular pH value changes between 0.8 and 1.0 units over 10 minutes of ischemia in rabbit papillary muscle using an IrOx electrode on Kapton film.[2] When using an array of pH sensors on the endocardial surface of a human RV, we observed a non-uniform absolute change in pH across the tissue, ranging from 0.35 to 1.27 over 18 minutes. This is the first report of the spatial endocardial pH distribution for human heart undergoing ischemia. In order to confirm the validity of the pH values to the quantitative level, further investigation is required because artifacts may arise from the heart’s physiological condition or the contact uniformity between sensor and the heart’s surface.
While this paper focused on developing sensors for the beating heart, the platforms can easily be translated to a variety of other applications such as tumor identification,[13] progression of wound healing,[4–5] and post-traumatic monitoring of brain injuries.[41] One of the main differences between a growing tumor and the surrounding healthy tissue is the metabolic supply. Growing populations of tumor cells often have limited oxygen due to inadequate vascularization into the tumor. This leads to anaerobic conditions and an acidic microenvironment.[6–8] Additionally, successful wound healing is characterized by the successful completion of inflammatory, proliferative, and remodeling phases that potentially can be spatially monitored by pH.[4,5] The pH sensor array is not only applicable to monitoring biological processes, but also could be useful in industrial applications including monitoring industrial lubricant,[42] activity of fuel cells,[43] and quality control in food industry.[44]
4. Conclusion
We developed and tested conformal, matrix addressed arrays of IrOx pH sensors for monitoring biological diseases, specifically cardiac ischemia-reperfusion. The fabrication of balloon catheter and sheet-based devices exploit techniques conventional microfabrication, transfer printing, and electrochemical methods. When applied to beating explanted cardiac tissue, these devices allow accurate, spatiotemporal monitoring of changes in pH. These ultrathin, stretchable, and multiplexing system can also be applied on other biological tissues or organs where pH change is a critical indicator of disease.
5. Experimental Details
Sensing Principles
A key feature of IrOx is its sensitivity to pH, which exceeds the thermodynamic limit of 59 mV/pH at room temperature, set by the Nernst equation.[13] This behavior follows from the chemistry of the material, as discussed in the following.
Depending on the deposition conditions, IrOx films are classified as anhydrous or hydrous. Usually, films formed in a water-free environment, such as by reactive sputtering from an iridium metal target with oxygen or by high-temperature oxidation of iridium metal film in dry atmosphere, are anhydrous. Films electrochemically grown in aqueous solution are hydrous. The response of anhydrous IrOx films to pH changes can be described by the following redox equation [45]
| (1) |
or
| (2) |
Here, one hydrogen ion corresponds to one transferred electron, thus it naturally follows the Nernstian relation of 59 mV/pH. On the other hand, hydrous IrOx films have multiple states. As a result, the hydrogen atom per electron transfer ratio may differ from 1:1. Specifically, one can consider the following three possibilities
| (3) |
| (4) |
| (5) |
By combining (3) to (5), the reaction can be rewritten as
| (6) |
thus the electron transfer ratio is now (1 + y − x)−1 per one hydrogen atom, which means that the pH response equals to (1 + y − x) times the prediction of Nernst equation.[26,27] If only fully hydrated IrOx is involved in the pH measurement process, the value is reported to be 1.5, suggesting that ~90 mV/pH is achievable.[26–29] In practice, however, electrodeposited IrOx is known to contain some anhydrous component,[46] which plays a critical part in determining the response.[26,27] In fact, most pH sensors made with electrodeposited IrOx exhibit sensitivities between 65 and 75 mV/pH at room temperature.[1,2,17,19–22,26–29]
Temperature Sensitivity
The responses of pH sensors, like any other chemical sensors, can be perturbed by various parameters. If such perturbations are predictable, then one can easily remove the influence by using an adequate additional sensor and a calibration algorithm. In certain cases, the signal strength from the interfering agent is not as significant as the signal from the pH variation in a given experimental system. As such, interference can be ignored (or at least tolerated).
Changes in temperature cause shifts in OCP between the sensing electrode and the Ag/AgCl reference electrode. By combining the Nernst equation with Eq (6),
| (7) |
where R, T, and F are the gas constant, the absolute temperature, and the Faraday constant, respectively.[13] This equation suggests that the OCP should have a linear dependence on temperature, consistent with experimental observation.
Fabrication of the Microelectrode Array
Bare silicon wafers were degreased with acetone, isopropyl alcohol, and deionized water, and dehydrated on a hotplate (250°C for 5 min). Poly(methylmethacrylate) (PMMA) was spin cast (3000 rpm, 30 s) and then baked (110 °C for 2 min and 180°C for 3 min) to form a sacrificial layer. A layer of polyimide (PI) was spin cast (4000 rpm, 60 s), baked (110 °C for 2 min and 180 °C for 5 min), and cured (250 °C for 2 h) in glove box (level of O2, H2O under 3 ppm) to form a supporting layer on top of the PMMA. A bilayer of Cr/Au (thickness = 10/200 nm) was deposited by electron beam evaporation and patterned by photolithography and wet etching to define electrical interconnections between sensing electrodes and contact pads. A second PI layer was formed using the procedures described above. Next, a thick photoresist (~7 μm; AZ4620) was patterned by photolithography to serve as an etch mask for defining openings in the top PI layer by dry etching (reactive ion etching (RIE) with O2 gas at 150 mTorr and 150 W) A bilayer of Cr/Au (thickness = 20/250 nm) was then deposited by sputtering and patterned by photolithography and wet etching to define the serpentine pattern. Dry etching by O2 RIE removed unwanted areas of the PI and through the PMMA to expose the underlying wafer. A final step of metal deposition and patterning formed the sensing electrodes and contact pads.
Transfer Printing and Module Processing
Microelectrode arrays fabricated on silicon wafers were immersed in a bath of boiled acetone to dissolve the sacrificial PMMA layer, thereby affecting release from the wafer. Retrieving the circuits onto the surface a PDMS stamp exposed their backsides for deposition of a thin layer of Cr/SiO2 (4 / 40 nm) by electron beam evaporation. Prior to transfer printing, a silicone substrate (Ecoflex 0030, Smooth-on Inc.) was activated by exposure to UV/ozone to create exposed hydroxyl group. Then, transfer printing of picked-up microelectrodes followed by brief heating on a hot plate (100 °C for 3 min) produced –O-Si-O- bonding at the back side of the microelectrodes, to provide robust bonding. The transfer printing process is illustrated in the supporting information, Figure S1. Finally, the contact pads were bonded to an anisotropic conductive film (ACF), whose other end was attached to a printed circuit board (PCB). The back side of ACF film and the contact pads were coated by PDMS (Sylgard 184, Dow Corning) and cured in 70 °C oven for 2 h to prevent the permeation of liquid into the circuit during measurement.
Electrochemical Deposition of IrOx
Iridium oxide films were selectively electrodeposited on the electrode array. Iridium oxide solution was prepared by methods described elsewhere.15 200 ml of ultrapure DI water was used to dissolve 300 mg of iridium tetrachloride, followed by stirring for 15 min. A 2 ml aliquot of aqueous 30% hydrogen peroxide was added, and the resulting solution was stirred for additional 10 min. A 1000 mg quantity of oxalic acid dihydrate was added and stirred again for 10 min. To adjust the pH to 10.5, small amounts of anhydrous potassium carbonate were gradually added to the stirred solution. The solution was stored at room temperature for 2 days for stabilization. Successfully prepared solution underwent a color change from yellow to light-violet during the period. After stabilization, the solution was stored in a dark bottle at 4°C in a refrigerator. Electroplating was performed with a potentiostat (VMP-3, BioLogic Inc.) in constant current mode. The voltage across the working and the counter electrodes was maintained around 0.7V during electroplating with the duration time of 45 minutes. The deposited IrOx film exhibited a dark blue color. Adhesion between gold electrode and the iridium oxide can further enhanced by applying potential pulsing method in electrodeposition process.[47]
Integration with a Balloon Catheter
The pH sensor arrays and ACF connections were attached to a top sacrificial layer of water-soluble tape (3M Corp). Once the array was supported with the soluble tape, the entire backside of the structure was coated with a thin layer (~50 μm) of uncured silicone (Ecoflex 0030, Smooth-on Inc.) and pressed against the surface of the balloon. Mechanical contact between the array and balloon was maintained for ~30 min, allowing strong adhesion to form upon curing of the silicone. Upon full cure, deionized water was used to wash away the top layer of water-soluble tape, leaving the array of pH electrodes bonded to the balloon.
Data Acquisition and Multiplexing
Data acquisition (DAQ) by the potentiostat was intermediated with a multiplexer built using a commodity personal computer running Windows XP. The computer included a Model 8007 PCI card from Sealevel Systems, which allowed control of 32 reed relays with near-millisecond accuracy. The contacts of the PCI card’s Hasco D1A05(D) relays were rated for 10 VA, 200 VDC, and 1.0 A, with operate, bounce, and release times all under 1 ms. Each electrode’s output was connected to the input of one relay. The relays’ outputs were all tied together and then connected to the input of the potentiostat. Thus, closing one relay at a time connected individual electrodes to the potentiostat. To avoid shorting two electrodes together, after opening one relay, 6 ms would elapse before closing another relay.
Sensor Calibration
The measurement protocol began one day prior to the measurement, with immersion of the pH sensor array into a buffer solution with ionic background similar to that of the solution of interest. On the day of measurement, OCP values were monitored for more than 30 minutes to identify drift in any of the electrodes. To calibrate, the OCP values were measured in solutions with known pH values, where a standard glass electrode determined the pH. Then, the pH sensors were applied to the surface of interest and OCP was measured. After experimentation, the pH sensor array was calibrated again with various pH solutions to confirm the functionality of the pH sensors. Throughout the current study, the functionality and sensitivity of pH sensors of all measured sensing electrodes remained invariant before and after the actual measurements. Finally, simple analysis algorithms converted OCP to pH values.
Explanted Cardiac Tissue pH Measurements
All studies were approved by the Institutional Animal Care and Use Committee of Washington University in St. Louis. Explanted rabbit hearts (n=5) were obtained from New Zealand white rabbits weighing 3–4kg. Rabbits were pretreated with an injection of 1000–2000 units of heparin and then anesthetized intravenously with sodium pentobarbital (80 mg/kg). A single human heart was provided by Mid-American Transplant Services for experimentation and a wedge preparation was created from the posterior surface of the right ventricle. The human heart was rejected for transplantation due to age (71 year old female) and was donated for research in accordance with the Washington University Institutional Review Board. Heart preparations were placed onto a Langendorff apparatus and retrogradely perfused with oxygenated (95%O2/5%CO2) Tyrode’s solution (NaCl 128.2, CaCl 1.3, KCl 4.7, MgCl2 1.05, NaH2PO4 1.19, NaHCO3 20.0, Glucose 11.1mM). Tissue was perfused under constant pressure (60–100mmHg) in a temperature controlled (37±1°C) perfusion chamber with perfusate pH continuously monitored (Oakton Instruments, Vernon Hills, IL). Preplaced Ag/AgCl pellet electrodes (WPI, Sarasota, FL) monitored (PowerLab 26T; ADInstruments, Colorado Springs, CO) the far-field ECG throughout experimentation. Heart preparations were allowed to equilibrate for 15 minutes before placement of flexible pH sensors.
The balloon catheter was used in a single ex-vivo rabbit heart experiment, which underwent global ischemia-reperfusion. The balloon catheter was placed on the anterior surface of the LV near the first diagonal of the LAD. pH arrays were used during both global (n=4; n=3 rabbit, n=1 human) and regional (n=1 rabbit) ischemia-reperfusion. In ex-vivo rabbit heart preparations, flat arrays bordered the LAD and spanned the anterior surface of the LV. In the human heart preparation, the flat array was placed on the endocardial surface of the wedge preparation. Global ischemia was induced by turning off the perfusion pump, whereas, local ischemia was created by arterial ligation and lasted 20–30 minutes. The RV wedge preparation was continuously paced at twice the diastolic pacing threshold.
Electrophysiological parameters, RR interval, QRS complex duration, and ST elevation was calculated with LabChart Pro7. QTc was calculated using Bazett’s formula:
and ST elevation was normalized to the amplitude of the R-wave.
Supplementary Material
Acknowledgments
H.-J.C. thank Prof. P.V. Braun, Dr. H.-G. Zhang (Illinois), and Dr. A.P. Bonifas (3M) for insightful discussions about electrochemistry. H.-Y.C thank E. Sutanto (Illinois) for advices in Matlab programming. J.-S.K. acknowledge BK21 program. This work was supported by National Security Science and Engineering Faculty Fellowship (JAR) and NIH R01-HL114395 grants (IRE).
Footnotes
Supporting Information is available online from the Wiley Online Library or from the author.
Contributor Information
Prof. Dr. Hyun-Joong Chung, Department of Chemical and Materials Engineering, University of Alberta, Edmonton, AB, T6G 2V4 (Canada). Department of Materials Science and Engineering, University of Illinois at Urbana-Champaign, Urbana, IL 61801 (USA).
Matthew S. Sulkin, Department of Bioengineering, Washington University at Saint Louis, Saint Louis, MO (USA).
Jong-Seon Kim, Department of Chemical and Biomolecular Engineering (BK21 Program), Korea Advanced Institute of Science and Technology, Daejeon (Korea).
Dr. Camille Goudeseune, Illinois Simulator Laboratory, Beckman Institute, University of Illinois Urbana, IL 61801 (USA)
Hsin-Yun Chao, Department of Materials Science and Engineering, University of Illinois at Urbana-Champaign, Urbana, IL 61801 (USA).
Joseph W. Song, Department of Materials Science and Engineering, University of Illinois at Urbana-Champaign, Urbana, IL 61801 (USA)
Dr. Sang Yoon Yang, Department of Materials Science and Engineering, University of Illinois at Urbana-Champaign, Urbana, IL 61801 (USA)
Dr. Yung-Yu Hsu, MC10 Inc., 36 Cameron Avenue, Cambridge, MA 02140 (USA)
Dr. Roozbeh Ghaffari, MC10 Inc., 36 Cameron Avenue, Cambridge, MA 02140 (USA)
Prof. Igor R. Efimov, Email: igor@biomed.wustl.edu, Department of Bioengineering, Washington University at Saint Louis, Saint Louis, MO (USA)
Prof. John A. Rogers, Email: jrogers@illinois.edu, Department of Materials Science and Engineering, Chemistry, Mechanical Science and Engineering, Electrical, and Computer Engineering, Beckman Institute for Advanced Science and Technology, and Frederick Seitz Materials Research Laboratory, University of Illinois at Urbana-Champaign, Urbana, IL 61801 (USA)
References
- 1.Marzouk S, Ufer S, Buck R, Johnson T, Cascio W. Anal Chem. 1998;70:5054. doi: 10.1021/ac980608e. [DOI] [PubMed] [Google Scholar]
- 2.Sayed AM, Marzouk S, Buck R, Dunlap L, Johnson T, Cascio W. Anal Biochem. 2002;308:52. doi: 10.1016/s0003-2697(02)00220-8. [DOI] [PubMed] [Google Scholar]
- 3.Khan T, Soller B, Naghavi M, Cassecells W. Cardiol. 2005;103:10. doi: 10.1159/000081846. [DOI] [PubMed] [Google Scholar]
- 4.Gettin G. Wounds. 2007;3:52. [Google Scholar]
- 5.Schneider LA, Korber A, Grabbe S, Dissemond J. Arch Dermatol Res. 2007;298:413. doi: 10.1007/s00403-006-0713-x. [DOI] [PubMed] [Google Scholar]
- 6.Grinstein S, Rotin D, Mason MJ. Biochim Biophys Acta. 1989;988:73. doi: 10.1016/0304-4157(89)90004-x. [DOI] [PubMed] [Google Scholar]
- 7.Garcia-Martin ML, Herigault G, Remy C, Farion R, Ballesteros P, Coles CA, Cerdan S, Ziegler A. Cancer Res. 2001;61:6524. [PubMed] [Google Scholar]
- 8.Rich IN, Worthington-White D, Garden OA, Musk P. Blood. 2000;95:1427. [PubMed] [Google Scholar]
- 9.Roger VL, Go AS, Lloyd-Jones DM, et al. Heart disease and stroke statistics – 2012 update: A report from the American Heart Association. Circulation. 2012;125:e2–e220. doi: 10.1161/CIR.0b013e31823ac046. [DOI] [PMC free article] [PubMed] [Google Scholar]
- 10.Albert KJ, Schauer CL, Walt DR. In: Biomedical Diagnostic Science and Technology. Law W, Akmal N, Usmani A, editors. Ch.6 Marcel Dekker; NY: 2002. [Google Scholar]
- 11.Chan KWY, Liu G, Song X, Kim H, Yu T, Arifin DR, Gilad AA, Hanes J, Walczak P, van Zijl PCM, Bulte JWM, McMahon MT. Nat Mater. 2013;12:268. doi: 10.1038/nmat3525. [DOI] [PMC free article] [PubMed] [Google Scholar]
- 12.Puyana JC, Soller BR, Zhang S, Heard S. J Trauma Acute Care Surg. 1999;46:9. doi: 10.1097/00005373-199901000-00003. [DOI] [PubMed] [Google Scholar]
- 13.Zhou DD. In: Electrochemical Sensors, Biosensors And Their Biomedical Applications. Zhang X, Ju H, Wang J, editors. Ch 10 Academic Press; New York, NY: 2008. [Google Scholar]
- 14.Kim D-H, Ghaffari R, Lu N, Wang S, Lee SP, Keum H, D’Angelo R, Klinker L, Su Y, Lu C, Kim Y-S, Ameen A, Li Y, Zhang Y, de Graff B, Hsu Y-Y, Liu Z, Ruskin J, Xu L, Lu C, Omenetto FG, Huang Y, Mansour M, Slepian MJ, Rogers JA. Proc Nat Acad Sci USA. 2012;109:19910. doi: 10.1073/pnas.1205923109. [DOI] [PMC free article] [PubMed] [Google Scholar]
- 15.Kurzweil P. Sensors. 2009;9:4955. doi: 10.3390/s90604955. [DOI] [PMC free article] [PubMed] [Google Scholar]
- 16.Glab S, Hulanicki A, Edwall G, Ingman F. Crit Rev Anal Chem. 1989;21:29. doi: 10.1080/10408348908048815. [DOI] [PubMed] [Google Scholar]
- 17.Huang WD, Cao H, Deb S, Chiao M, Chiao JC. Sens Actuat A. 2011;169:1. [Google Scholar]
- 18.Yamanaka K. Jap J Appl Phys. 1989;28:632. [Google Scholar]
- 19.Ges IA, Ivanov BL, Schaffer DK, Lima EA, Werdich AA, Baudenbacher FJ. Biosens Bioelectron. 2005;21:248. doi: 10.1016/j.bios.2004.09.021. [DOI] [PubMed] [Google Scholar]
- 20.Bezbaruah AN, Zhang TC. Anal Chem. 2002;74:5726. doi: 10.1021/ac020326l. [DOI] [PubMed] [Google Scholar]
- 21.Terashima C, Rao TN, Sarada BV, Spataru N, Fujishima A. J Electroanal Chem. 2003;65:544. [Google Scholar]
- 22.Lee WH, Lee JH, Choi WH, Hosni AA, Papulsky I, Bishop PL. Meas Sci Technol. 2011;22:042001. [Google Scholar]
- 23.Kim D-H, Song J, Choi WM, Kim H-S, Kim R-H, Liu Z, Huang YY, Hwang K-C, Zhang Y-w, Rogers JA. Proc Nat Acad Sci USA. 2008;105:18675. doi: 10.1073/pnas.0807476105. [DOI] [PMC free article] [PubMed] [Google Scholar]
- 24.Gray DS, Tien J, Chen CS. Adv Mater. 2004;16:393. [Google Scholar]
- 25.Gonzalez M, Axisa F, Bulcke MV, Brosteaux D, Vandevelde B, Vanfleteren J. Microelec Rel. 2008;48:825. [Google Scholar]
- 26.Steegstra P, Ahlberg E. Electrochim Acta. 2012;76:26. [Google Scholar]
- 27.Bock C, Birss VI. J Electroanal Chem. 1999;475:20. [Google Scholar]
- 28.Burke LD, Mulcahy JK, Whelan DP. J Electroanal Chem. 1984;163:11. [Google Scholar]
- 29.Pasztor K, Sekiguchi A, Shimo N, Kitamura N, Masuhara H. Sens Actuat B. 1993;12:225. [Google Scholar]
- 30.Shaw RD, Rudy Y. Cardiovasc Res. 35:256. doi: 10.1016/s0008-6363(97)00093-x. 199. [DOI] [PubMed] [Google Scholar]
- 31.Headrick JP, McKirdy JC, Willis RJ. Am J Physiol. 1998;275:H917. doi: 10.1152/ajpheart.1998.275.3.H917. [DOI] [PubMed] [Google Scholar]
- 32.Murphy E, Steenbergen C. Physiol Rev. 2008;88:581. doi: 10.1152/physrev.00024.2007. [DOI] [PMC free article] [PubMed] [Google Scholar]
- 33.Murphy E, Perlman M, London RE, Steenbergen C. Circ Res. 1991;68:1250. doi: 10.1161/01.res.68.5.1250. [DOI] [PubMed] [Google Scholar]
- 34.Ahn JH, Kim HS, Lee KJ, Jeon S, Kang SJ, Sun Y, Nuzzo RG, Rogers JA. Science. 2006;314:1754. doi: 10.1126/science.1132394. [DOI] [PubMed] [Google Scholar]
- 35.Ko HC, Shin G, Wang S, Stoykovich MP, Lee JW, Kim DH, Ha JS, Huang Y, Hwang KC, Rogers JA. Small. 2009;5:2703. doi: 10.1002/smll.200900934. [DOI] [PubMed] [Google Scholar]
- 36.Chung HJ, Kim TI, Kim HS, Wells SA, Jo S, Ahmed N, Jung YH, Won SM, Bower CA, Rogers JA. Adv Funct Mat. 2011;21:3029. [Google Scholar]
- 37.Kim DH, Lu N, Ghaffari R, Kim YS, Lee SP, Xu L, Wu J, Kim RH, Song J, Liu Z, Viventi J, de Graff B, Elolampi B, Mansour M, Slepian MJ, Hwang S, Moss JD, Won SM, Huang Y, Litt B, Rogers JA. Nat Mater. 2011;10:316. doi: 10.1038/nmat2971. [DOI] [PMC free article] [PubMed] [Google Scholar]
- 38.Slepian MJ, Ghaffari R, Rogers JA. Interv Cardiol. 2011;3:417. [Google Scholar]
- 39.Kim DH, Ghaffari R, Lu N, Rogers JA. Ann Rev Biomed Eng. 2012;14:113. doi: 10.1146/annurev-bioeng-071811-150018. [DOI] [PubMed] [Google Scholar]
- 40.Yan GX, Klebér AG. Circulation Res. 1992;71:460. doi: 10.1161/01.res.71.2.460. [DOI] [PubMed] [Google Scholar]
- 41.Grant SA, Bettencourt K, Krulevitch P, Hamilton J, Glass R. Sens Actuact B. 2001;72:174. [Google Scholar]
- 42.Smiechowski MF, Lvovich VF. Sens Actuat B. 2003;96:261. [Google Scholar]
- 43.Widera J, Riehl BL, Johnson JM, Hansen DC. Sens Actuat B. 2008;130:871. [Google Scholar]
- 44.Bohnke Cl, Duroy H, Fourquet J-L. Sens Actuat B. 2003;89:240. [Google Scholar]
- 45.VanHoudt P, Lawandowski Z, Little B. Biotech Bioeng. 1992;40:601. doi: 10.1002/bit.260400507. [DOI] [PubMed] [Google Scholar]
- 46.Pickup PG, Birss VI. J Electroanal Chem. 1987;220:83. [Google Scholar]
- 47.Meyer RD, Cogan SF, Nguyen TH, Rauh RD. IEEE Trans Neural System Rehab Eng. 2001;9:2. doi: 10.1109/7333.918271. [DOI] [PubMed] [Google Scholar]
Associated Data
This section collects any data citations, data availability statements, or supplementary materials included in this article.