

Abstract
BACKGROUND
Survival of patients with acute lung injury or the acute respiratory distress syndrome (ARDS) has been improved by ventilation with small tidal volumes and the use of positive end-expiratory pressure (PEEP); however, the optimal level of PEEP has been difficult to determine. In this pilot study, we estimated transpulmonary pressure with the use of esophageal balloon catheters. We reasoned that the use of pleural-pressure measurements, despite the technical limitations to the accuracy of such measurements, would enable us to find a PEEP value that could maintain oxygenation while preventing lung injury due to repeated alveolar collapse or overdistention.
METHODS
We randomly assigned patients with acute lung injury or ARDS to undergo mechanical ventilation with PEEP adjusted according to measurements of esophageal pressure (the esophageal-pressure–guided group) or according to the Acute Respiratory Distress Syndrome Network standard-of-care recommendations (the control group). The primary end point was improvement in oxygenation. The secondary end points included respiratory-system compliance and patient outcomes.
RESULTS
The study reached its stopping criterion and was terminated after 61 patients had been enrolled. The ratio of the partial pressure of arterial oxygen to the fraction of inspired oxygen at 72 hours was 88 mm Hg higher in the esophageal-pressure–guided group than in the control group (95% confidence interval, 78.1 to 98.3; P = 0.002). This effect was persistent over the entire follow-up time (at 24, 48, and 72 hours; P = 0.001 by repeated-measures analysis of variance). Respiratory-system compliance was also significantly better at 24, 48, and 72 hours in the esophageal-pressure–guided group (P = 0.01 by repeated-measures analysis of variance).
CONCLUSIONS
As compared with the current standard of care, a ventilator strategy using esophageal pressures to estimate the transpulmonary pressure significantly improves oxygenation and compliance. Multicenter clinical trials are needed to determine whether this approach should be widely adopted. (ClinicalTrials.gov number, NCT00127491.)
Recent changes in the practice of mechanical ventilation have improved survival in patients with the acute respiratory distress syndrome (ARDS), but mortality remains unacceptably high. Whereas low tidal volumes are clearly beneficial in patients with ARDS, how to choose a positive end-expiratory pressure (PEEP) is uncertain.1–4 Ideally, mechanical ventilation should provide sufficient transpulmonary pressure (airway pressure minus pleural pressure) to maintain oxygenation while minimizing repeated alveolar collapse or overdistention leading to lung injury.5 In critical illness, however, there is marked variability among patients in abdominal and pleural pressures6,7; thus, for a given level of PEEP, transpulmonary pressures may vary unpredictably from patient to patient.7
We estimated pleural pressure with the use of an esophageal balloon catheter. Although this technique has been validated in healthy human subjects and animals, it has not been systematically applied in patients in the intensive care setting. We reasoned that we could adjust PEEP according to each patient’s lung and chest-wall mechanics.8–10 We speculated that in patients with high estimated pleural pressure who are undergoing ventilation with conventional ventilator settings, underinflation may cause hypoxemia. In such patients, raising PEEP to maintain a positive transpulmonary pressure might improve aeration and oxygenation without causing overdistention. Conversely, in patients with low pleural pressure, maintaining low PEEP would keep transpulmonary pressure low, preventing overdistention and minimizing the adverse hemodynamic effects of high PEEP.11
We report the results of a randomized, controlled pilot trial involving patients with acute lung injury or ARDS. The trial compared mechanical ventilation directed by esophageal-pressure measurements with mechanical ventilation managed according to the Acute Respiratory Distress Syndrome Network (ARDSNet) recommendations.12 We tested the hypothesis that oxygenation in patients can be improved by adjusting PEEP to maintain positive transpulmonary pressures.
METHODS
PATIENTS
We performed the trial in the medical and surgical intensive care units (ICUs) of Beth Israel Deaconess Medical Center in Boston. The protocol was approved by the institutional review board of the center, and written informed consent was obtained from the patients or their nearest relatives. No commercial entities providing equipment or devices had a role in any aspect of this study.
Patients were included in the study if they had acute lung injury or ARDS according to the American–European Consensus Conference definitions.13 The exclusion criteria included recent injury or other pathologic condition of the esophagus, major bronchopleural fistula, and solid-organ transplantation.
MEASUREMENTS AND EXPERIMENTAL PROTOCOL
While undergoing treatment, the subjects were supine, with the head of the bed elevated to 30 degrees. Airway pressure, tidal volume, and air flow were recorded during mechanical ventilation. An esophageal balloon catheter was passed to a depth of 60 cm from the incisors for measurement of gastric pressure and then withdrawn to a depth of 40 cm to record esophageal pressure during mechanical ventilation. Placement of the balloon in the stomach was confirmed by a transient increase in pressure during a gentle compression of the abdomen and by a qualitative change in the pressure tracing (i.e., an increased cardiac artifact) as the balloon was withdrawn into the esophagus. In approximately one third of the patients, the balloon could not be passed into the stomach, and esophageal placement was confirmed by the presence of a cardiac artifact and the changes in transpulmonary pressure during tidal ventilation. The mixed expired partial pressure of carbon dioxide was measured to allow calculation of physiological dead space. After these initial measurements, patients were randomly assigned with the use of a block-randomization scheme to the control or esophageal-pressure–guided group.
Each patient, while under heavy sedation or paralysis, underwent a recruitment maneuver to standardize the history of lung volume,14 in which airway pressure was increased to 40 cm of water for 30 seconds. If needed, a lower pressure was used to keep the transpulmonary pressure (the difference between the airway pressure and the esophageal pressure) in the physiologic range (<25 cm of water while the patient is in the supine position).15 After the recruitment maneuver, the patient underwent mechanical ventilation according to the treatment assignment.
The patients in the esophageal-pressure–guided group underwent mechanical ventilation with settings determined by the initial esophageal-pressure measurements. Tidal volume was set at 6 ml per kilogram of predicted body weight. The predicted body weight of male patients was calculated as 50 + 0.91 × (centimeters of height – 152.4) and that of female patients as 45.5 + 0.91 × (centimeters of height − 152.4). PEEP levels were set to achieve a transpulmonary pressure of 0 to 10 cm of water at end expiration, according to a sliding scale based on the partial pressure of arterial oxygen (PaO2) and the fraction of inspired oxygen (FiO2) (Fig. 1). We also limited tidal volume to keep transpulmonary pressure at less than 25 cm of water at end inspiration, although this limit was rarely approached, and tidal volume was never reduced for this purpose.
Figure 1. Ventilator Settings According to the Protocol.
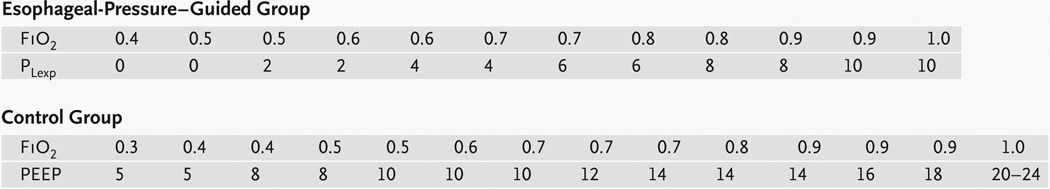
For the intervention group, keep the partial pressure of arterial oxygen (PaO2) between 55 and 120 mm Hg or keep the oxygen saturation, as measured by pulse oximeter, between 88 and 98% by using the ventilator settings in one column at a time. Set the positive end-expiratory pressure (PEEP) at such a level that transpulmonary pressure during end-expiratory occlusion (PLexp) stays between 0 and 10 cm of water, and keep transpulmonary pressure during end-inspiratory occlusion at less than 25 cm of water. For the control group, keep PaO2 between 55 and 120 mm Hg (or keep oxygen saturation according to pulse oximeter between 88 and 98%) by using the ventilator settings in one column at a time. Set the PEEP and tidal volume at such levels that the airway pressure during end-inspiratory occlusion stays at less than 30 cm of water. In both groups, apply ventilation with either pressure-control ventilation or volume-control ventilation with a ratio of inspiratory time to expiratory time between 1:1 and 1:3 to minimize dys-synchrony between the patient and the ventilator while achieving a tidal volume of 6±2 ml per kilogram of predicted body weight and a respiratory rate of 35 breaths per minute or less. Lung-recruitment maneuvers are permitted to reverse episodic hypoxemia after suctioning or inadvertent airway disconnection, but not on a routine basis.
Patients in the control group were treated according to the low-tidal-volume strategy reported by the ARDSNet study of the National Heart, Lung, and Blood Institute.12 This strategy specifies that the tidal volume is set at 6 ml per kilogram of predicted body weight and PEEP is based on the patient’s PaO2 and FiO2 (Fig. 1).
In both groups, the goals of mechanical ventilation included a PaO2 of 55 to 120 mm Hg or a pulse-oximeter reading of 88 to 98%, an arterial pH of 7.30 to 7.45, and a partial pressure of arterial carbon dioxide (PaCO2) of 40 to 60 mm Hg, according to the sliding scales in Figure 1. To reduce the need for frequent manipulation of the ventilator settings, the goals for oxygenation in both groups were relaxed from the narrow range of PaO2 values in the ARDSNet study (55 to 80 mm Hg) to a broader range of 55 to 120 mm Hg.
All measurements were repeated 5 minutes after the initiation of experimental or control ventilation and again at 24, 48, and 72 hours. Measurements were also performed as needed after changes were made to ventilator settings because of any clinically significant change in the patient’s condition.
Therapies other than mechanical ventilation were administered by members of the primary ICU team, who were unaware of the results of the esophageal-pressure measurements. To avert complications, these team members used protocols to guide hemodynamic resuscitation,16 sedation, weaning from ventilation, and other standard interventions related to ventilator care.17 These care standards were aggressively applied in both groups. After the measurements at 72 hours, the results of pressure measurements were made available to the caregivers, who were free to use or not use them for decisions concerning treatment and ventilator management.
The primary end point of the study was arterial oxygenation, as measured by the ratio of PaO2 to FiO2 (PaO2:FiO2) 72 hours after randomization. The secondary end points included indexes of lung mechanics and gas exchange (respiratory-system compliance and the ratio of physiological dead space to tidal volume), as well as outcomes of the patients (the number of ventilator-free days at 28 days, length of stay in the ICU, and death within 28 days and 180 days after treatment).
STATISTICAL ANALYSIS
In evaluating the PaO2:FiO2 at 72 hours, we decided a priori that a clinically important change in the PaO2:FiO2 would be approximately 20%, with measurement error taken into account. To determine sample size, we chose a minimal average between-groups difference of 40 in the PaO2:FiO2. We conservatively estimated the standard deviation to be 100 (equivalent to a coefficient of variation of 250%); on the basis of this estimate, a sample of 100 patients per group would be required to detect a difference of 40 in the PaO2:FiO2 with 80% power and a two-tailed alpha value of 0.05. Because of the uncertainty in the estimate of standard deviation, we designed the study with the aid of a data safety and monitoring board, whose members were not involved in patient care or data gathering. The board members were instructed to perform an interim analysis after 60 patients had been enrolled, at which point they could recommend stopping the trial if an overwhelming effect was detected on the basis of the critical significance level (P≤0.02), as adjusted for the Lan–DeMets alpha-spending function with Pocock boundary. The members of this board also participated in the writing of this article.
Continuous variables with normal distribution are presented as means (±SD) and compared with the use of Student’s t-test. Continuous variables with non-normal distributions are presented as medians and interquartile ranges and compared with the use of the Mann–Whitney test. Dichotomous or nominal categorical variables are compared with the use of the chi-square test with normal approximation or Fisher’s exact test, as appropriate. We assessed the trend over time in respiratory measurements by comparing the control group and the esophageal-pressure–guided group at 24, 48, and 72 hours with the use of the F test with one degree of freedom for a general linear model with repeated measures. We used sequential hypothesis testing for the assessment of differences between the groups at 72 hours and 24 hours. When a statistically significant difference was found at 72 hours, we performed a repeated-measures analysis and then compared the values at 24 hours. Kaplan–Meier analysis with the log-rank test was applied to compare survival at 180 days between the groups.
In a single prespecified analysis, we adjusted the relative risk by using the Acute Physiology and Chronic Health Evaluation (APACHE II) score to estimate the effect of study group on the risk of death within 28 days after treatment. The relative risk was estimated by Poisson regression with conservative robust error variance.18,19 For death within 180 days after treatment, we used a Cox proportional-regression model to compare the control and treatment groups, with adjustment for the APACHE II score at admission. A two-tailed P value less than 0.05 was considered to indicate statistical significance.
RESULTS
The characteristics of the patients in the two groups were well matched at baseline (Table 1). Most patients in both groups were severely ill, with a mean (±SD) APACHE II score of 26.6±6.4 and a median of two failed organs (interquartile range, one to three). We were unable to sedate one patient in the esophageal-pressure–guided group sufficiently to obtain stable esophageal-pressure measurements; this patient is included in the analysis on the basis of the intention-to-treat principle. There were no adverse events or incidents of barotrauma in either group.
Table 1.
Baseline Characteristics of the Patients.*
| Characteristic | Esophageal-Pressure–Guided (N = 30) |
Conventional Treatment (N = 31) |
P Value |
|---|---|---|---|
| Male sex — no. (%) | 19 (63) | 17 (55) | 0.44 |
| Age — yr | 54.5±16.1 | 51.2±23.0 | 0.52 |
| White race — no. (%)† | 26 (87) | 27 (87) | 0.96 |
| Predicted body weight — kg | 67.1±8.9 | 63.2±11.1 | 0.14 |
| APACHE II score at admission | 26.3±6.4 | 26.8±6.5 | 0.76 |
| Primary physiological injury — no. (%)‡ | 0.54 | ||
| Pulmonary | 7 (23) | 5 (16) | |
| Abdominal | 13 (43) | 11 (35) | |
| Trauma | 6 (20) | 9 (29) | |
| Sepsis | 3 (10) | 2 (6) | |
| Other | 1 (3) | 4 (13) | |
| Organ failure at baseline — no. (%) | |||
| Cardiac | 10 (33) | 10 (32) | 0.93 |
| Renal | 19 (63) | 16 (52) | 0.36 |
| Neurologic | 12 (40) | 12 (39) | 0.92 |
| Hepatic | 11 (37) | 10 (32) | 0.72 |
| Hematologic | 7 (23) | 5 (16) | 0.48 |
| Arterial blood gases at baseline | |||
| pH | 7.34±0.09 | 7.32±0.08 | 0.34 |
| PaCO2 — mm Hg | 42±8 | 40±8 | 0.23 |
| PaO2 — mm Hg§ | 91±25 | 107±44 | 0.09 |
| Bicarbonate — mmol/liter | 24±5 | 22±4 | 0.05 |
| Hemodynamic variables at baseline | |||
| Lactate — mg/dl | 3.1±3.5 | 3.4±3.3 | 0.83 |
| Heart rate — beats/min | 98±26 | 100±19 | 0.71 |
| Systolic blood pressure — mm Hg | 108±18 | 107±18 | 0.80 |
| Diastolic blood pressure — mm Hg | 58±11 | 54±11 | 0.20 |
| Central venous pressure — mm Hg | 16±5 | 16±4 | 0.96 |
Plus–minus values are means ±SD. APACHE denotes Acute Physiology and Chronic Health Evaluation, PaCO2 the partial pressure of arterial carbon dioxide, and PaO2 the partial pressure of arterial oxygen.
Race was determined by the investigators.
Pulmonary injury included pneumonia (nine patients), aspiration pneumonitis (two), and smoke inhalation (one). Abdominal injury included bowel obstruction (four patients), abdominal surgery (four), pancreatitis (four), cholangitis (two), small-bowel perforation (three), ruptured aortic aneurysm or surgery for aortic aneurysm (two), gastrointestinal bleeding (one), Crohn’s disease (one), end-stage liver disease (one), ischemic bowel (one), and perforated viscus (one). Trauma included motor vehicle accident (five patients), multiple trauma (eight), abdominal gunshot wound (one), and traumatic brain injury (one). Other injuries included drug overdose (three patients), intraventricular hemorrhage (one), and hypoxic respiratory failure (one).
For the PaO2, the values for the fraction of inspired oxygen were as follows: for the esophageal-pressure–guided group, the median was 0.6 and the interquartile range was 0.5 to 0.8; for the conventional-treatment group, the median was 0.7 and the interquartile range was 0.6 to 1.0.
We stopped the study after 61 patients had been enrolled, because the planned interim analysis showed that it had reached the prespecified stopping criterion. The PaO2:FiO2 at 72 hours was 88 mm Hg higher in patients treated with mechanical ventilation with esophageal balloons than in control patients (95% confidence interval [CI], 78.1 to 98.3; P = 0.002) (Table 2).
Table 2.
Measurements of Ventilatory Function at Baseline and 72 Hours.*
| Measurement | Baseline | 72 Hr† | ||||
|---|---|---|---|---|---|---|
| Esophageal- Pressure–Guided (N = 30) |
Conventional Treatment (N = 31) |
P Value | Esophageal- Pressure–Guided (N = 29) |
Conventional Treatment (N = 29) |
P Value | |
| PaO2:FiO2 | 147±56 | 145±57 | 0.89 | 280±126 | 191±71 | 0.002 |
| Respiratory-system compliance (ml/cm of water) | 36±12 | 36±10 | 0.94 | 45±14 | 35±9 | 0.005 |
| Ratio of physiological dead space to tidal volume | 0.67±0.11 | 0.67±0.09 | 0.95 | 0.61±0.09 | 0.64±0.10 | 0.27 |
| PaO2 (mm Hg) | 91±25 | 107±44 | 0.09 | 124±44 | 101±33 | 0.03 |
| FiO2 | 0.66±0.17 | 0.77±0.18 | 0.02 | 0.49±0.17 | 0.57±0.18 | 0.07 |
| PEEP (cm of water) | 13±5 | 13±3 | 0.73 | 17±6 | 10±4 | <0.001 |
| Tidal volume (ml) | 484±98 | 491±105 | 0.80 | 472±98 | 418±80 | 0.03 |
| Tidal volume (ml per kg of predicted body weight) | 7.3±1.3 | 7.9±1.4 | 0.12 | 7.1 ±1.3 | 6.8±1 | 0.31 |
| Respiratory rate (breaths/min) | 26±6 | 24±6 | 0.32 | 26±6 | 28±5 | 0.20 |
| Inspiratory time (sec) | 0.8±0.1 | 0.9±0.2 | 0.19 | 0.8±0.1 | 0.8±0.1 | 0.27 |
| PEEPtotal (cm of water) | 14±5 | 15±4 | 0.67 | 18±5 | 12±5 | <0.001 |
| Peak inspiratory pressure (cm of water) | 35±8 | 35±7 | 0.85 | 32±8 | 28±7 | 0.007 |
| Mean airway pressure (cm of water) | 20±6 | 20±4 | 0.88 | 22±6 | 16±5 | 0.001 |
| Plateau pressure (cm of water) | 29±7 | 29±5 | 0.79 | 28±7 | 25±6 | 0.07 |
| Transpulmonary end-inspiratory pressure (cm of water) | 7.9±6.0 | 8.6±5.4 | 0.61 | 7.4±4.4 | 6.7±4.9 | 0.58 |
| Transpulmonary end-expiratory pressure (cm of water) | −2.8±5.0 | −1.9±4.7 | 0.49 | 0.1±2.6 | −2.0±4.7 | 0.06 |
| Esophageal end-inspiratory pressure (cm of water) | 21.2±4.9 | 20.7±5.1 | 0.68 | 21.7±7.2 | 17.9±5.2 | 0.03 |
| Esophageal end-expiratory pressure (cm of water) | 17.2±4.4 | 16.9±5.0 | 0.79 | 18.4±5.9 | 14.3±4.9 | 0.008 |
Plus–minus values are means ±SD. FiO2 denotes the fraction of inspired oxygen, PaO2 the partial pressure of arterial oxygen, PEEP positive end-expiratory pressure applied by the ventilator, and PEEPtotal airway pressure measured during end-expiratory occlusion.
The values are given for the 29 surviving patients in each treatment group.
PHYSIOLOGICAL MEASUREMENTS
The ventilator settings and physiological measurements at baseline were similar in the two groups (Table 2). Forty-nine patients (80%), including the one patient that we were unable to sedate, met the criteria for ARDS (PaO2:FiO2 <200 mm Hg) (see Table 1 in the Supplementary Appendix, available with the full text of this article at www.nejm.org), and there was no significant difference in baseline PaO2:FiO2 between the groups. The average tidal volume was reduced during the first day of therapy by 67 ml in the control group (P<0.001 by paired t-test) and by 44 ml in the esophageal-pressure–guided group (P<0.001 by paired t-test).
Oxygenation and respiratory-system compliance improved in the esophageal-pressure–guided group as compared with the control group, whereas the ratio of dead space to tidal volume did not significantly differ between the groups during the first 72 hours (Fig. 2C). The PaO2:FiO2 improved during the first 72 hours by 131 mm Hg (95% CI, 79 to 182) in the esophageal-pressure–guided group and by 49 mm Hg (95% CI, 12 to 86) in the control group (Table 2). The higher value of PaO2:FiO2 in the esophageal-pressure–guided group than in the control group was evident at 24 hours (P = 0.04) (Fig. 2A). Respiratory-system compliance was significantly improved and was higher in the esophageal-pressure–guided group than in the control group (P = 0.01; repeated-measures analysis of variance at 24, 48, and 72 hours) (Fig. 2B).
Figure 2. Respiratory Measurements at Baseline and at 24, 48, and 72 Hours in the Control and Esophageal-Pressure–Guided Groups.

Means and standard errors are shown. P values were calculated by repeated-measures analysis of variance. Panel A shows the ratio of the partial pressure of arterial oxygen to the fraction of inspired oxygen (PaO2:FiO2), Panel B respiratory-system compliance, Panel C the ratio of dead space to tidal volume, Panel D positive end-expiratory pressure (PEEP), Panel E transpulmonary end-expiratory pressure, Panel F plateau pressure, and Panel G transpulmonary end-inspiratory pressure.
On the first therapeutic day, PEEP was changed by less than 5 cm of water in all but one of the control patients, whereas patients in the esophageal-pressure–guided group had variable and often substantial increases in PEEP (Table 3) and significantly higher PEEP at 24, 48, and 72 hours (Fig. 2D, and Fig. 1 in the Supplementary Appendix). At 24 hours, the difference in PEEP between the groups reached 7.7 cm of water (95% CI, 5.5 to 9.9), with a mean PEEP in the esophageal-pressure–guided group of 18.7±5.1 cm of water, although in 3 of the 31 patients in this group, the initial PEEP level was decreased on the basis of initial transpulmonary pressure. At 24, 48, and 72 hours, the mean transpulmonary end-expiratory pressure remained above zero in the esophageal-pressure–guided group, whereas it remained negative in the control group (P<0.001 by repeated-measures analysis of variance) (Fig. 2E). The plateau airway pressure during end-inspiratory occlusion was higher in the esophageal-pressure–guided group than in the control group (P = 0.003 by repeated-measures analysis of variance) (Fig. 2F, and Fig. 1 in the Supplementary Appendix). However, transpulmonary pressures during end-inspiratory occlusion never exceeded 24 cm of water and did not differ significantly between the groups (P = 0.13 by repeated-measures analysis of variance) (Fig. 2G).
Table 3.
Changes in PEEP at the Initiation of Ventilation According to the Protocol.*
| Treatment Group | Change in PEEP | |||||
|---|---|---|---|---|---|---|
| −1 to −6 cm of Water |
0 to 5 cm of Water |
6 to 10 cm of Water |
11 to 15 cm of Water |
16 to 20 cm of Water |
||
| no. of patients | ||||||
| Esophageal-pressure–guided group | 3 | 9 | 12 | 4 | 2 | |
| Control group | 12 | 18 | 1 | 0 | 0 | |
PEEP denotes applied positive end-expiratory pressure.
CLINICAL OUTCOMES
Table 4 presents the clinical outcomes, all of which were prespecified secondary outcomes. There was no significant difference between the groups in ventilator-free days at day 28 or length of stay in the ICU. The 28-day mortality rate in the entire study cohort was 17 of 61 patients (28%). As would be expected, the APACHE II score at admission was higher among patients who died than among those who survived (31.5±4.5 vs. 24.7±6.1, P<0.001). However, the baseline PaO2:FiO2 was similar among survivors and non-survivors (153.2±53.7 and 143.8±58.0 mm Hg, respectively; P = 0.56).
Table 4.
Clinical Outcomes.*
| Outcome | Esophageal-Pressure–Guided (N = 30) |
Conventional Treatment (N = 31) |
P Value |
|---|---|---|---|
| 28-Day mortality — no. (%) | 5 (17) | 12 (39) | 0.055 |
| 180-Day mortality — no. (%) | 8 (27) | 14 (45) | 0.13 |
| Length of ICU stay — days | 0.16 | ||
| Median | 15.5 | 13.0 | |
| Interquartile range | 10.8–28.5 | 7.0–22.0 | |
| No. of ICU-free days at 28 days | 0.96 | ||
| Median | 5.0 | 4.0 | |
| Interquartile range | 0.0–14.0 | 0.0–16.0 | |
| No. of ventilator-free days at 28 days | 0.50 | ||
| Median | 11.5 | 7.0 | |
| Interquartile range | 0.0–20.3 | 0.0–17.0 | |
| No. of days of ventilation among survivors | 0.71 | ||
| Median | 12.0 | 16.0 | |
| Interquartile range | 7.0–27.5 | 7.0–20.0 |
For patients who were deceased at day 28, a value of 0 days was assigned. ICU denotes intensive care unit.
The mortality rate at 28 days was lower among patients in the esophageal-pressure–guided group than among control patients, although the difference was not significant (relative risk, 0.43; 95% CI, 0.17 to 1.07; P = 0.06). Multivariable analysis showed that after adjustment for baseline APACHE II score (relative risk per point of score, 1.16; 95% CI, 1.09 to 1.23; P<0.001), the esophageal-pressure protocol was associated with a significant reduction in 28-day mortality as compared with conventional treatment (relative risk, 0.46; 95% CI, 0.19 to 1.0; P = 0.049).
The mortality rate at 180 days did not differ significantly between the treatment groups; the point estimate for the relative risk of death in the esophageal-pressure–guided group was 0.59 (95% CI, 0.29 to 1.20) as compared with the control group. However, a Kaplan–Meier survival plot (see Fig. 2 in the Supplementary Appendix) shows separation between the curves that persists at 180 days. Cox regression modeling showed that after adjustment for baseline APACHE II score (hazard ratio per point, 1.12; 95% CI, 1.04 to 1.22), the hazard ratio for 180-day mortality was 0.52 in the esophageal-pressure–guided group (95% CI, 0.22 to 1.25) as compared with the control group.
DISCUSSION
We found that it is feasible to make repeated measurements of esophageal pressure that are of adequate fidelity and quality to be used to manage the treatment of patients requiring mechanical ventilation. Patients with acute lung injury or ARDS treated in this way had significantly improved oxygenation, as measured by the PaO2:FiO2, and significantly improved respiratory-system compliance. Moreover, these improvements were achieved without elevating transpulmonary pressure at end inspiration above the physiologic range. Finally, these improvements in lung function were associated with a trend toward improved 28-day survival in this group of very sick patients.
Numerous animal models of acute lung injury have shown that reducing end-expiratory lung volume or pressure can be injurious, even when tidal volume or peak pressure is controlled.20–24 In these models, increasing PEEP can be protective.25,26 However, in patients with ARDS, effective adjustment of PEEP to the physiological features of the individual patient has been difficult to achieve. For example, in the ARDSNet study of low tidal volume, PEEP and FiO2 were adjusted according to arterial oxygenation without reference to chest-wall or lung mechanics.12 The subsequent Assessment of Low Tidal Volume and Elevated End-Expiratory Volume to Obviate Lung Injury (known as the ALVEOLI trial) (ClinicalTrials.gov number, NCT00000579) compared an increased level of PEEP with standard PEEP, with both levels adjusted according to the patient’s oxygenation, and showed no benefit.1 The recent Lung Open Ventilation Study (NCT00182195) used a similar approach to adjustment of PEEP, without benefit.2 The Expiratory Pressure Study Group trial (NCT00188058) increased PEEP in the intervention group to reach a plateau pressure of 28 to 30 cm of water. This study showed improvements in ventilator- free and organ-failure-free days, oxygenation, and respiratory-system compliance but showed no significant change in survival.3 Other studies, including those using the lower point of maximum curvature on the pressure–volume curve or the stress index, have had mixed results.27–31
The disappointing results of these previous studies may be due in part to their inclusion of patients with elevated pleural or intraabdominal pressure32,33 and elevated esophageal pressure.7 The lungs of such patients may be effectively compressed by high pleural pressures, and their alveoli may collapse at end expiration, despite levels of PEEP that would be adequate in other patients. By using esophageal-pressure measurements to determine PEEP, we may have prevented repeated alveolar collapse or overdistention.5 In the present pilot study, PEEP was lowered in 3 of the 30 patients treated with the use of esophageal pressure to determine PEEP and in 12 of the 31 patients treated according to the ARDSNet protocol. More importantly, PEEP was increased by more than 5 cm of water in 18 patients treated with the use of esophageal pressure to determine PEEP and in only 1 patient treated according to the ARDSnet protocol (Table 3). Thus, the key difference between the two approaches appears to be that measurement of esophageal pressure identifies patients who derive benefit from higher levels of PEEP than would ordinarily be used. Although no adverse events resulting from this strategy were observed, we would have been able to observe only adverse events that occurred at very high frequency, because of the small size of the trial.
There is currently mistrust of the use of esophageal- pressure measurements in supine, critically ill patients, largely because of possible artifacts associated with body position and lung pathologic conditions.34 Although transpulmonary pressure–volume curves have been used to characterize lung disease, esophageal-pressure measurements are not usually used to manage mechanical ventilation in patients with acute lung injury or ARDS.35 However, artifacts in esophageal pressure may not be large enough to obscure differences in esophageal and pleural pressures among patients with acute lung injury or ARDS. For example, the average difference in esophageal pressure measured in the upright and the supine position that was imposed by cardiac weight was 2.9±2.1 cm of water,10 and mechanical abnormalities in diseased lungs may reduce tidal excursions in esophageal pressure by a few centimeters of water.34 By contrast, in patients with acute respiratory failure, end-expiratory esophageal pressures ranged from 4 to 32 cm of water.7
Our study has several limitations. It was a single-center study with physiologically expert staff and a small sample, and although we enrolled medical and surgical patients with various diseases, the findings cannot be generalized until they are confirmed in a larger trial powered to detect changes in appropriate clinical end points. Since our primary end point was oxygenation, which is known to be improved by applied PEEP,36 and improvements in patient oxygenation have been associated with unchanged or increased mortality when these were obtained at the cost of higher airway pressures, one cannot be sure of a favorable outcome until a larger trial has been completed.2,3,12
In conclusion, adjustment of the settings of mechanical ventilation for patients with acute lung injury or ARDS on the basis of the patients’ estimated transpulmonary pressure may have clinical benefit. This approach shows promise for improvement in lung function and survival that warrants further investigation.
Supplementary Material
Acknowledgments
Supported in part by a grant from the National Heart, Lung, and Blood Institute (HL-52586).
Dr. Malhotra reports receiving consulting fees from Respironics. Mr. Ritz reports receiving consulting fees from INO Therapeutics and lecture fees from Tri-anim and serving on the advisory boards of Cardinal Health and Respironics.
Footnotes
No other potential conflict of interest relevant to this article was reported.
REFERENCES
- 1.Brower RG, Lanken PN, MacIntyre N, et al. Higher versus lower positive end-expiratory pressures in patients with the acute respiratory distress syndrome. N Engl J Med. 2004;351:327–336. doi: 10.1056/NEJMoa032193. [DOI] [PubMed] [Google Scholar]
- 2.Meade MO, Cook DJ, Guyatt GH, et al. Ventilation strategy using low tidal volumes, recruitment maneuvers, and high positive end-expiratory pressure for acute lung injury and acute respiratory distress syndrome: a randomized controlled trial. JAMA. 2008;299:637–645. doi: 10.1001/jama.299.6.637. [DOI] [PubMed] [Google Scholar]
- 3.Mercat A, Richard JC, Vielle B, et al. Positive end-expiratory pressure setting in adults with acute lung injury and acute respiratory distress syndrome: a randomized controlled trial. JAMA. 2008;299:646–655. doi: 10.1001/jama.299.6.646. [DOI] [PubMed] [Google Scholar]
- 4.Grasso S, Fanelli V, Cafarelli A, et al. Effects of high versus low positive end-expiratory pressures in acute respiratory distress syndrome. Am J Respir Crit Care Med. 2005;171:1002–1008. doi: 10.1164/rccm.200407-940OC. [DOI] [PubMed] [Google Scholar]
- 5.Slutsky AS. Lung injury caused by mechanical ventilation. Chest. 1999;116(Suppl):9S–15S. doi: 10.1378/chest.116.suppl_1.9s-a. [DOI] [PubMed] [Google Scholar]
- 6.Malbrain ML, Chiumello D, Pelosi P, et al. Incidence and prognosis of intra-abdominal hypertension in a mixed population of critically ill patients: a multiple-center epidemiological study. Crit Care Med. 2005;33:315–322. doi: 10.1097/01.ccm.0000153408.09806.1b. [DOI] [PubMed] [Google Scholar]
- 7.Talmor D, Sarge T, O’Donnell CR, et al. Esophageal and transpulmonary pressures in acute respiratory failure. Crit Care Med. 2006;34:1389–1394. doi: 10.1097/01.CCM.0000215515.49001.A2. [DOI] [PMC free article] [PubMed] [Google Scholar]
- 8.Milic-Emili J, Mead J, Turner JM, Glauser EM. Improved technique for estimating pleural pressure from esophageal baloons. J Appl Physiol. 1964;19:207–211. doi: 10.1152/jappl.1964.19.2.207. [DOI] [PubMed] [Google Scholar]
- 9.Pelosi P, Goldner M, McKibben A, et al. Recruitment and derecruitment during acute respiratory failure: an experimental study. Am J Respir Crit Care Med. 2001;164:122–130. doi: 10.1164/ajrccm.164.1.2007010. [DOI] [PubMed] [Google Scholar]
- 10.Washko GR, O’Donnell CR, Loring SH. Volume-related and volume-independent effects of posture on esophageal and transpulmonary pressures in healthy subjects. J Appl Physiol. 2006;100:753–758. doi: 10.1152/japplphysiol.00697.2005. [DOI] [PubMed] [Google Scholar]
- 11.Beyer J, Beckenlechner P, Messmer K. The influence of PEEP ventilation on organ blood flow and peripheral oxygen delivery. Intensive Care Med. 1982;8:75–80. doi: 10.1007/BF01694870. [DOI] [PubMed] [Google Scholar]
- 12.The Acute Respiratory Distress Syndrome Network. Ventilation with lower tidal volumes as compared with traditional tidal volumes for acute lung injury and the acute respiratory distress syndrome. N Engl J Med. 2000;342:1301–1308. doi: 10.1056/NEJM200005043421801. [DOI] [PubMed] [Google Scholar]
- 13.Bernard GR, Artigas A, Brigham KL, et al. The American-European Consensus Conference on ARDS: definitions, mechanisms, relevant outcomes, and clinical trial coordination. Am J Respir Crit Care Med. 1994;149:818–824. doi: 10.1164/ajrccm.149.3.7509706. [DOI] [PubMed] [Google Scholar]
- 14.Nishida T, Suchodolski K, Schettino GP, Sedeek K, Takeuch M, Kacmarek RM. Peak volume history and peak pressure-volume curve pressures independently affect the shape of the pressure-volume curve of the respiratory system. Crit Care Med. 2004;32:1358–1364. doi: 10.1097/01.ccm.0000128573.28173.2e. [DOI] [PubMed] [Google Scholar]
- 15.Colebatch HJ, Greaves IA, Ng CK. Exponential analysis of elastic recoil and aging in healthy males and females. J Appl Physiol. 1979;47:683–691. doi: 10.1152/jappl.1979.47.4.683. [DOI] [PubMed] [Google Scholar]
- 16.Shapiro NI, Howell MD, Talmor D, et al. Implementation and outcomes of the Multiple Urgent Sepsis Therapies (MUST) protocol. Crit Care Med. 2006;34:1025–1032. doi: 10.1097/01.CCM.0000206104.18647.A8. [DOI] [PubMed] [Google Scholar]
- 17.Resar R, Pronovost P, Haraden C, Simmonds T, Rainey T, Nolan T. Using a bundle approach to improve ventilator care processes and reduce ventilator-associated pneumonia. Jt Comm J Qual Patient Saf. 2005;31:243–248. doi: 10.1016/s1553-7250(05)31031-2. [DOI] [PubMed] [Google Scholar]
- 18.McNutt LA, Wu C, Xue X, Hafner JP. Estimating the relative risk in cohort studies and clinical trials of common outcomes. Am J Epidemiol. 2003;157:940–943. doi: 10.1093/aje/kwg074. [DOI] [PubMed] [Google Scholar]
- 19.Zou G. A modified Poisson regression approach to prospective studies with binary data. Am J Epidemiol. 2004;159:702–706. doi: 10.1093/aje/kwh090. [DOI] [PubMed] [Google Scholar]
- 20.Chiumello D, Pristine G, Slutsky AS. Mechanical ventilation affects local and systemic cytokines in an animal model of acute respiratory distress syndrome. Am J Respir Crit Care Med. 1999;160:109–116. doi: 10.1164/ajrccm.160.1.9803046. [DOI] [PubMed] [Google Scholar]
- 21.Faridy EE, Permutt S, Riley RL. Effect of ventilation on surface forces in excised dogs’ lungs. J Appl Physiol. 1966;21:1453–1462. doi: 10.1152/jappl.1966.21.5.1453. [DOI] [PubMed] [Google Scholar]
- 22.Muscedere JG, Mullen JB, Gan K, Slutsky AS. Tidal ventilation at low airway pressures can augment lung injury. Am J Respir Crit Care Med. 1994;149:1327–1334. doi: 10.1164/ajrccm.149.5.8173774. [DOI] [PubMed] [Google Scholar]
- 23.Webb HH, Tierney DF. Experimental pulmonary edema due to intermittent positive pressure ventilation with high inflation pressures: protection by positive end-expiratory pressure. Am Rev Respir Dis. 1974;110:556–565. doi: 10.1164/arrd.1974.110.5.556. [DOI] [PubMed] [Google Scholar]
- 24.Wyszogrodski I, Kyei-Aboagye K, Taeusch HW, Jr, Avery ME. Surfactant inactivation by hyperventilation: conservation by end-expiratory pressure. J Appl Physiol. 1975;38:461–466. doi: 10.1152/jappl.1975.38.3.461. [DOI] [PubMed] [Google Scholar]
- 25.Tremblay L, Valenza F, Ribeiro SP, Li J, Slutsky AS. Injurious ventilatory strategies increase cytokines and c-fos m-RNA expression in an isolated rat lung model. J Clin Invest. 1997;99:944–952. doi: 10.1172/JCI119259. [DOI] [PMC free article] [PubMed] [Google Scholar]
- 26.Imai Y, Parodo J, Kajikawa O, et al. Injurious mechanical ventilation and end-organ epithelial cell apoptosis and organ dysfunction in an experimental model of acute respiratory distress syndrome. JAMA. 2003;289:2104–2112. doi: 10.1001/jama.289.16.2104. [DOI] [PubMed] [Google Scholar]
- 27.Villar J, Kacmarek RM, Pérez-Méndez L, Aguirre-Jaime A. A high positive end-expiratory pressure, low tidal volume ventilatory strategy improves outcome in persistent acute respiratory distress syndrome: a randomized, controlled trial. Crit Care Med. 2006;34:1311–1318. doi: 10.1097/01.CCM.0000215598.84885.01. [DOI] [PubMed] [Google Scholar]
- 28.Maggiore SM, Jonson B, Richard JC, Jaber S, Lemaire F, Brochard L. Alveolar derecruitment at decremental positive end-expiratory pressure levels in acute lung injury: comparison with the lower inflection point, oxygenation, and compliance. Am J Respir Crit Care Med. 2001;164:795–801. doi: 10.1164/ajrccm.164.5.2006071. [DOI] [PubMed] [Google Scholar]
- 29.Jonson B, Richard JC, Straus C, Mancebo J, Lemaire F, Brochard L. Pressure-volume curves and compliance in acute lung injury: evidence of recruitment above the lower inflection point. Am J Respir Crit Care Med. 1999;159:1172–1178. doi: 10.1164/ajrccm.159.4.9801088. [DOI] [PubMed] [Google Scholar]
- 30.Amato MB, Barbas CS, Medeiros DM, et al. Effect of a protective-ventilation strategy on mortality in the acute respiratory distress syndrome. N Engl J Med. 1998;338:347–354. doi: 10.1056/NEJM199802053380602. [DOI] [PubMed] [Google Scholar]
- 31.Harris RS, Hess DR, Venegas JG. An objective analysis of the pressure-volume curve in the acute respiratory distress syndrome. Am J Respir Crit Care Med. 2000;161:432–439. doi: 10.1164/ajrccm.161.2.9901061. [DOI] [PubMed] [Google Scholar]
- 32.Malbrain ML. Abdominal pressure in the critically ill: measurement and clinical relevance. Intensive Care Med. 1999;25:1453–1458. doi: 10.1007/s001340051098. [DOI] [PubMed] [Google Scholar]
- 33.Chieveley-Williams S, Dinner L, Puddicombe A, Field D, Lovell AT, Goldstone JC. Central venous and bladder pressure reflect transdiaphragmatic pressure during pressure support ventilation. Chest. 2002;121:533–538. doi: 10.1378/chest.121.2.533. [DOI] [PubMed] [Google Scholar]
- 34.de Chazal I, Hubmayr RD. Novel aspects of pulmonary mechanics in intensive care. Br J Anaesth. 2003;91:81–91. doi: 10.1093/bja/aeg146. [DOI] [PubMed] [Google Scholar]
- 35.Gattinoni L, Carlesso E, Cadringher P, Valenza F, Vagginelli F, Chiumello D. Physical and biological triggers of ventilator-induced lung injury and its prevention. Eur Respir J Suppl. 2003;47:15s–25s. doi: 10.1183/09031936.03.00021303. [DOI] [PubMed] [Google Scholar]
- 36.Villar J, Pérez-Méndez L, López J, et al. An early PEEP/FIO2 trial identifies different degrees of lung injury in patients with acute respiratory distress syndrome. Am J Respir Crit Care Med. 2007;176:795–804. doi: 10.1164/rccm.200610-1534OC. [DOI] [PubMed] [Google Scholar]
Associated Data
This section collects any data citations, data availability statements, or supplementary materials included in this article.