Abstract
Real-time tracking of virus invasion is crucial for understanding viral infection mechanism, which, however, needs simple and efficient labeling chemistry with improved signal-to-noise ratio. For that purpose, herein we investigated the invasion dynamics of respiratory syncytial virus (RSV) through dark-field microscopic imaging (iDFM) technique by using Au nanoparticles (AuNPs) as light scattering labels. RSV, a ubiquitous, non-segmented, pleiomorphic and negative-sense RNA virus, is an important human pathogen in infants, the elderly, and the immunocompromised. In order to label the enveloped virus of paramyxoviridae family, an efficient streptavidin (SA)-biotin binding chemistry was employed, wherein AuNPs and RSV particles modified with SA and biotin, respectively, allowing the AuNP-modified RSVs to maintain their virulence without affecting the native activities of RSV, making the long dynamic visualization successful for the RSV infections into human epidermis larynx carcinoma cells.
Optical imaging has been widely used in biology and medicine1,2,3,4, wherein traditional organic dyes and fluorescent proteins are commonly used as tags in bio-labeling because of their brightness over a short period5,6. However, the usefulness of these tags over comparative long periods is limited owing to their photobleaching properties and low emission efficiency. Quantum dots (QDs), although successfully applied in imaging owing to their bright emissions and possessed greater photostability than organic dyes6,7,8,9,10,11,12, are easily aggregated and potential toxic13,14,15. Compared with other labeling materials, on the other hand, gold nanoparticles (AuNPs) appear to be superior as they have high levels of biocompatibility, unique optical properties for localized surface plasmon resonance (LSPR), and strong light scattering properties at their plasmon resonance frequency16,17,18,19. Therefore, it is crucial to choose the label materials so as to real-time visualize and track the dynamic processes, for example, how an individual virus particle infects cells17,20,21,22,23. Therefore, many researchers have adopted different labeling approaches, such as QDs label and immunofluorescent protein label, to study viral invasion24,25,26, so that it is much better understanding the true mechanism(s) of virus invasion, which is crucial to prevention and control of viral diseases.
For real-time tracking of viral infection processes, it is basic to use fluorescence microscopy during the imaging process21,22,23,27. Compared to fluorescence microscopy imaging, dark-field microscopic imaging (iDFM) technique in which white light source was employed under a dark-field microscope to get scattering light signal, owing to metal nanoparticles of localized surface plasmon resonance28, can resist photobleaching to keep signal intensity, so that the dark-field microscope which have been applied for long-time observing gets the images with high resolution and sensitivity. Based on this superiority, researchers have made significant contributions using iDFM technique for targeting cancer cells19, intracellular imaging29,30, drug release and photothermal therapy of cancer cells31,32,33,34.
There have been few reports regarding real-time iDFM technique through light scattering to dynamically track the entrance of virus such as RSV into cells, human epidermis larynx carcinoma (HEp-2) cells, for example, to infect disease. Even if being too small to be observed, but if modified with AuNPs, the virus can be easily observed through the strong light scattering for a long time without affecting its native activities. RSV has a diameter ranging 150–300 nm, is a ubiquitous, non-segmented, pleiomorphic and negative-sense RNA virus, which is crucial for the immunocompromised such as infants, and the elderly35,36. Our objectives were to efficiently label RSV with AuNPs, and conduct real-time imaging of RSV infecting HEp-2 cells. By using streptavidin (SA) modified AuNPs in this contribution, which could then have strong affinity to bind biotin-modified virus through biotin-NHS interactions with the amino groups on the viral surface, we could observe real time track single virus particles under a dark field microscope in the light scattering mode, and successfully monitor the viral infection over long periods.
Results
Features of the labeling chemistry
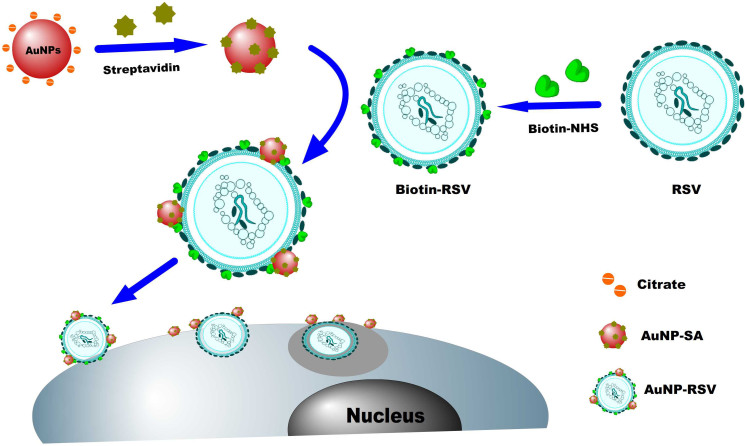
Fig. 1 shows our monitoring strategy for the viral invasion of cells, which generate AuNPs modified with SA. AuNPs were stable in solution because they were coated with a charged citrate layer on the surface. The citrate layer on the surface of AuNPs could be easily replaced in the presence of neutral or negatively charged SA in neutral medium, and the excessive active sites, which failed to be replaced on the surfaces, were blocked with further addition of bovine serum albumin (BSA).
Figure 1. Schematic outlining the generation of AuNPs conjugated with SA and RSV labeled with AuNP-SAs, then AuNP-RSVs invaded HEp-2 cells.
The as-prepared AuNP-SA particles were centrifuged and suspended in phosphate-buffered saline (PBS). Then, the purified AuNP-SAs were used to label the RSV, which had been previously modified with biotin-NHS through interactions between the amino groups on the surface of RSV and biotin-NHS (Fig. 1). Owing to the strong light scattering of localized surface plasmon resonance (LSPR) resulted at the plasmon resonance frequency, the RSV labeled with AuNP (AuNP-RSV) could be clearly observed under a dark-field microscope.
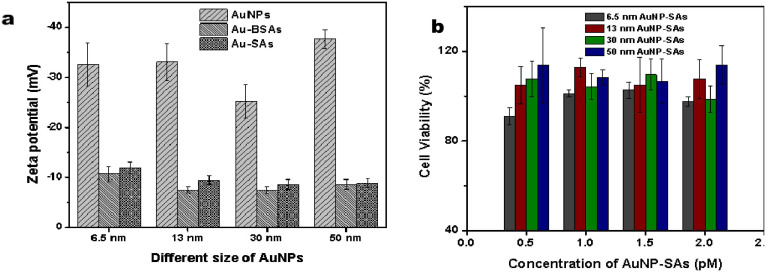
Fig. 2 shows the optical features of different size of AuNPs with modifications with SA suspensions. It can be seen that the modifications of AuNPs, which have maximum absorption at 522, 518, 524, and 528 nm for AuNPs of 6.5, 13, 30, and 50 nm, respectively, have slight red shift owing to the attachment of SA and BSA onto the AuNP surface. The zeta potential of AuNPs was altered when their surfaces were modified (Fig. 3a), and viability assay of cells showed that the different size of AuNP-SAs had no obvious toxicity to cell growth and proliferation (Fig. 3b). These results showed that the various proteins were successfully bound to the surface of AuNPs. And AuNPs modified with SA and BSA did not show aggregation tendency to be stable in PBS buffer and had good biocompatibility.
Figure 2. UV-vis absorption spectra of AuNPs (black line), Au-BSA (red line) and Au-SA (blue line).
The insets are the SEM images of AuNPs either modified or non-modified. The scale bars indicate 50 nm.
Figure 3. Characterization of AuNP-SAs.
(a) Zeta potential of AuNPs, AuNP-BSAs and AuNP-SAs used in our experiments. (b) CCK-8 detection of the viability of HEp-2 cells incubated with 6.5, 13, 30 and 50 nm AuNP-SAs at different concentrations for 24 h. Error bars represented the standard deviation from three replicated experiments.
Features of AuNP-labeled RSVs
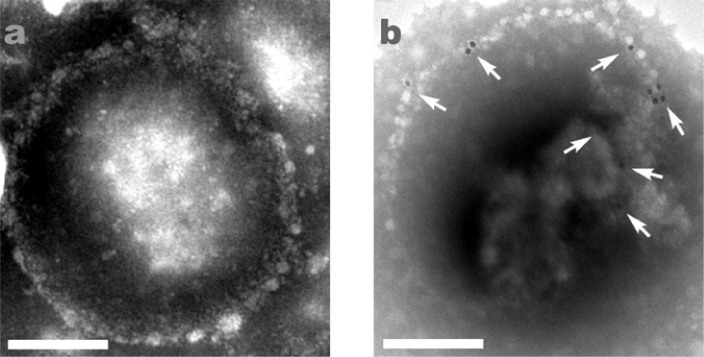
Transmission electron microscopy (TEM) Images (Fig. 4) clearly showed the different characteristic features of both unlabeled and AuNP-labeled RSVs. The unmodified virus had a smooth membrane surface (Fig. 4a, appeared to be round or kidney shaped, with a diameter of about 200 nm, while the 13-nm AuNP-RSVs contained some AuNPs at the edge of the viral membrane, and on their surface (Fig. 4b). The 30-nm AuNP-RSVs, however, had less AuNPs attached compared with the 13-nm AuNP-RSVs. Further experiments illustrated that AuNPs with a smaller size had a greater propensity for labeling RSV, which might be because of the lower steric hindrance. In addition, the 13-nm AuNP-RSVs displayed better light scattering than the 30-nm AuNP-RSVs, which made us chose the 13-nm AuNP-RSVs for our real-time imaging experiments.
Figure 4. TEM images of RSV (a) and RSV labeled with 13-nm AuNPs (b).
The white arrows indicate the 13-nm AuNP-RSVs. The scale bars indicate 100 nm.
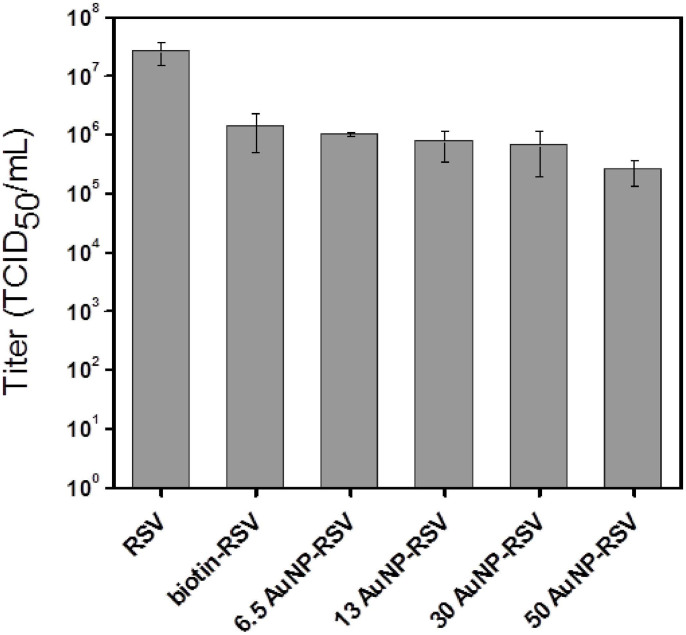
In order to find whether our labeling has effect on the virus, we measured the titers of viruses, which were expressed as the 50% tissue culture infectious dose (TCID50) (Fig. 5) and the investigation of syncytium formation (Supplementary Fig. S1). The titers of RSV, biotin-RSV, and RSV labeled with AuNPs (AuNP-RSVs) of 6.5, 13, 30, and 50 nm were 2.6 × 10⁷, 1.4 × 10⁶, 1.0 × 10⁶, 7.6 × 10⁵, 6.6 × 10⁵, and 2.5 × 10⁵ TCID50/mL, respectively, showed that labeling with AuNPs can scarcely exert influence on viral infectivity. After the HEp-2 cells were infected by RSV and biotin-RSV, respectively, and had been cultured for 24 h, the syncytium formed and could be easily observed (Supplementary Fig. S1). This result showed our labeling without effect on viral infectivity again. Moreover, with respect to the effects of AuNP size on RSV virulence, we found that TCID50 values were similar except in the case of 50 nm AuNPs; Thence small size AuNPs were ideal labeling materials for our experiments.
Figure 5. Titers of the various virus conjugates with different size of AuNPs.
96-well plates were used to culture HEp-2 cells. Then the AuNP-RSVs solution with serially diluted by RPMI 1640 culture medium were added to the cells and infected for 2 h at 37°C. The infected cells in 96-well plates were cultured about 7 days. TCID50 was calculated to quantify the titer of RSV.
Invasion of RSV labeled with AuNPs into host cells
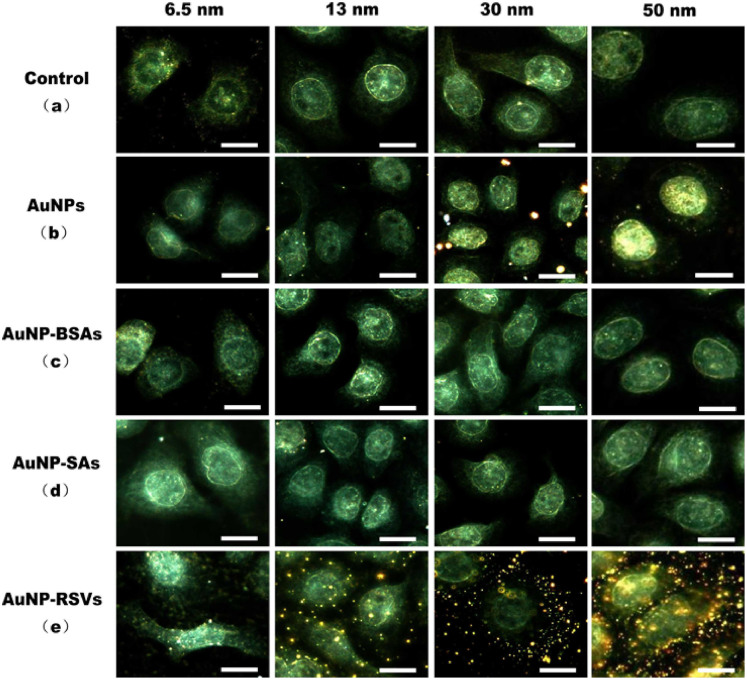
Fig. 6 showed the results of the invasion of RSV labeled with AuNPs into HEp-2 host cells. Owing to the light scattering of the cellular medium and the reflection light beam, the internals and outline of the HEp-2 cells could be observed under the DFM in light scattering mode (Fig. 6a). As it can be seen, the unmodified AuNPs can scarcely be non-specifically adsorbed on the cellular membrane (Fig. 6b), but the AuNPs modified with proteins can not be non-specifically absorbed completely (Fig. 6c and 6d). In other word, the active sites on the surface of AuNPs could be successfully blocked by using BSA. Fig. 6e showed that the HEp-2 cells could be easily observed for the AuNPs-modified RSV has been adsorbed on the cell surface, wherein AuNPs-modified RSV has strong light scattering signals owing to the localized surface plasmon resonance (LSPR) (Fig. 6e). That is to say, AuNP-RSV was able to attach to the cellular membrane by binding to the appropriate receptor on the surface of the cell. In order to further identify the authenticity of result, we prepared QDs-labeled RSV by conjugating streptavidinylated quantum dots with biotin-RSV, and used it to image the infection process by fluorescence microscope (Supplementary Fig. S2). Furthermore, the immunofluorescence images of AuNP-RSVs and RSVs infecting cells at various post-infection time had been acquired (Supplementary Fig. S3). The results showed that the QDs-labeled RSV and AuNP-labeled RSV had the same infection routes with non-labeled RSV, indicating that the AuNP labeling had no obvious effect on RSV infection. In such case, Fig. 6e further indicated that the location of AuNPs on the cell membrane represented the location of viruses invading cells. The results and trends for AuNPs of different size were consistent (Fig. 6). Compared with AuNPs of a larger size, the light scattering of AuNPs with a diameter of 6.5 nm was weak. The results indicated that the size of AuNPs and the effects of AuNP size on RSV virulence should be considered when using iDFM technique in light scattering mode to monitor viruses infecting cells (Fig. 5 and Fig. 6). That means, AuNP-viruses with diameters of 13 and 30 nm were appropriate for dark-field imaging.
Figure 6. Dark-field light scattering images acquired during viral infection.
The control group is represented by HEp-2 cells (a). HEp-2 cells were incubated with AuNPs (b), AuNP-BSAs (c), AuNP-SAs (d) and AuNP-RSVs (e). The scale bars indicate 20 μm.
Real-time dark-field light scattering imaging
The 13-nm AuNP-RSVs were used for real-time imaging, with those particles scattering orange light. The 30-nm AuNP-RSVs scattered light to a much less extent than that with the 13-nm particles, illustrating that smaller AuNPs were more likely to bind to RSV (Figure 5). In such case, the 13-nm AuNP-RSVs were successfully used to achieve superior real-time imaging results. As the movie (supplementary movie A) showed, the virus rapidly invaded the cellular membrane (red arrow) when the 13-nm AuNP-RSV solution was added (Fig. 7), indicating that RSV quickly invades host cells. Some AuNP-RSVs linked on the cell membrane when presented for a short time, and with increase of the time (100 s, for instance), they moved across the cell membrane. The entire invasion processes for the 13-nm AuNP-RSVs was between 1–2 min. During the invading process, the number of viral particles that moved across HEp-2 cells also increased (supplementary movie B), further illustrating that RSV labeled with 13-nm AuNPs were ideal because of the relatively low levels of steric hindrance. The real-time imaging of RSV infecting live cells can be achieved by monitoring the scattering light of AuNPs bound to the virus.
Figure 7. Real-time dark-field light scattering images of 13-nm AuNP-RSVs invading HEp-2 cells.
The red arrow indicates a virus on the cell membrane when the 13-nm AuNP-RSVs are added to living HEp-2 cells. The blue arrow indicates the infection process for a single AuNP-RSV invading HEp-2 cells, which occurs over 1 min following the addition of AuNP-RSV. The scale bar indicates 20 μm.
Discussion
AuNPs of different size were used to label RSV to facilitate real-time imaging of viral infection, displaying that AuNPs with the diameter of 13 nm could be successfully applied for the virus labeling in order to observe their invasion into cells. That means the invasion of a cell by viruses can be successfully monitored by measuring the scattered light from the AuNPs under a dark-field light scattering microscopy. The labeling strategy was simple and highly efficient, and the use of AuNPs as labels did not appear to adversely affect the infectivity of RSV, indicating that AuNPs with the size of 13 nm are a superior alternative for tracking viral infection without any obvious damage to cells even if real-time imaging conducted for long periods.
Methods
Materials and reagents
Respiratory syncytial virus (RSV) strain and human epidermis larynx carcinoma cell lines (HEp-2 cells) were cultivated and obtained in our own laboratory. Streptavidin (SA) was purchased from Beijing Boisynthesis Biotechnology Co. Ltd. (Beijing, China). Bovine serum albumin (BSA) was purchased from Beijing Dingguo Changsheng Biotechnology Co. Ltd. (Beijing, China). Biotin was purchased from Thermo (U.S.A). Streptavidin−quantum dot (QD) conjugates were purchased from Jiayuan Quantum Dot Co. Ltd. (Wuhan, China). Other commercial reagents such as HAuCl4 and trisodium citrate were analytical reagent grade without further purification. All the above reagents were prepared with Milli-Q purified water (18.2 MΩ).
Preparation of AuNPs
The preparation of 13 nm Au Nanoparticles (AuNPs) was performed according to the well-established method for AuNPs synthesis37. 2 mL HAuCl4 (1%, w/w) and 50 ml H2O were added in a clean flask. Heat up the solution with magnetic stirring and add 1 mL 5% sodium citrate to the solution quickly when boiling. Allow the system to reflux for 5 min, then stop heating and continue stirring until cooling to room temperature. AuNPs were filtered by 0.22 μm membrane and stored in 4°C fridge. Monodispersed AuNPs of varying sizes, including 6.5, 13, 30 and 50 nm, were prepared by altering the quantity of HAuCl4 and reducing agents (see Supplementary Methods).
Conjugation and characterization of AuNP-SAs
AuNPs conjugated with SA (AuNP-SAs) were prepared by incubating the as-prepared AuNPs with different sizes of 6.5, 13, 30 and 50 nm with SA (the corresponding concentration was 32, 80, 30 and 100 μg·L−1) for about 30 min at room temperature. The concentrations of the AuNPs were calculated to be 5.24 × 10⁻⁸, 6.94 × 10⁻⁹, 1.32 × 10⁻¹⁰ and 2.69 × 10⁻¹¹ M. After that, BSA was used further to react for 30 min in order to block the excessive binding sites on AuNPs surface after the incubating reaction. The concentration of BSA was 64, 100, 80 and 350 μg·L−1, respectively. Spectroscopic properties and hydrodynamic diameter of AuNPs, AuNP-BSAs and AuNP-SAs were measured with a U-3010 spectrophotometer (Hitachi, Tokyo, Japan) and a Zetasizer Nano ZS90 (Malvern Instruments), respectively.
Cell culture and cells viability assay
The 2 × 10⁵ cells·mL−1 HEp-2 cells in RPMI 1640 culture medium containing 10% (w/v) fetal bovine serum (FBS) were first added to each well of a 96-well plate (100 μL per well), and cultured at 37°C with 5% CO2 for 24 h to make cells adhere to the surface. For another 24 h the culture medium was replaced with 100 μL of RPMI 1640 (2% FBS) containing different amounts of bulk 6.5, 13, 30 and 50 nm AuNP-SAs, respectively. Then, cells were incubated with the CCK-8 solution for 30 min after 96-well plate have been washed with PBS. The absorbance (450 nm) for each well was measured with a Microplate Reader Modle. Cell viability was determined by comparing the ratio of absorbance of the cells incubated with AuNP-SAs to that of the cells incubated with culture medium only.
Virus propagation
RSV was propagated in monolayer culture of HEp-2 cells at 37°C with 5% CO2 in RPMI 1640 culture medium (2% FBS). At 1–2 days post infection, when the cytopathic effect (CPE) could be observed, the cell were subjected to 2–3 rounds of freeze-thaw cycles to release viruses and cell debris were removed by centrifugation at 3000 g for 10 min. The harvest RSV was stored at −80°C.
Virus titer assays
50% tissue culture infective dose (TCID50) was used to quantify the titer of RSV. 96-well plates were used to culture HEp-2 cells in culture medium for about 24 h at 37°C with 5% CO2. Then the AuNP-RSVs solution with serially diluted by RPMI 1640 culture medium were added to the cells and infected for 2 h at 37°C. The infected cells in 96-well plates were cultured in RPMI 1640 culture medium supplemented with 2% FBS at 37°C with 5% CO2 for about 7 days. Then TCID50 was calculated according to the Reed-Muench formula: TCID50 = dilution above 50% CPE + [(% next above 50%) − 50%]/(% next above 50% − (% next below 50%)) × log10.
Label of virus with AuNPs
RSV biotinylation was carried out by incubating viral suspension and biotin of 1 mg·mL−1 for about 2 h at 4°C, and then excessive biotin was removed by a desalting NAP-5 column (GE Healthcare). The AuNP-SAs and biotin-virus were mixed and reacted for about 10 min at 4°C. The control virus and AuNP-RSVs were characterized with TEM (JEM 1200EX, Japan Electronics Co. Ltd.) in terms of their size, morphology and labeling decorated situation by dropping the virus or AuNP-RSV onto the copper grid and negatively staining.
Dark-field light scattering imaging
HEp-2 cells were cultured on 12-well plates of coverslip for about 24 h in an incubator to reach 50% confluence before infection. Then 100 μL biotinylated viruses and 100 μL PBS buffer were successively added to 12-well plates and incubated for 20 min at 4°C, spare virus solution was removed and cells in 12-well plates were rinsed. 400 μL AuNP-SAs with 1.5 pM for 6.5 nm, or 1.5 pM for 13 nm, or 2.0 pM for 30 nm, or 2.0 pM for 50 nm were added and incubated for 30 min at 4°C. Then cells were fixed with 4% paraformaldehyde, sealed with glycerin, and then transferred for dark-field light scattering imaging under an Olympus BX-51 microscope (Tokyo, Japan) with a 40× objective, which was equipped with a highly numerical dark field condenser (U-DCW). The colorful dark-field light scattering photographs of the AuNPs labeling virus were captured with an Olympus E-510 digital camera (Tokyo, Japan).
Real-time imaging of AuNP-RSVs infection cells
HEp-2 cells were cultured on a home-made plate for about 36 h at 37°C with 5% CO2. AuNP-RSVs were added to cells and achieved real-time dark-field imaging of virus infecting cells for 20 min at the room temperature. This process was acquired with a dark-field microscope (Tokyo, Japan) with a 40× objective in a polarized light of ND6.
Author Contributions
Experiments were designed by C.Z.H. and X.Y.W. Material characterizations were carried out by X.Y.W. Computer simulation was done by X.Y.W. and P.F.G. Cell Culture and Virus Propagation were performed by X.Y.W., X.X.Y. and C.M.L. Real-time dark-field imaging was performed by X.Y.W. and L.L.Z. The manuscript was written by C.Z.H., Y.F.L. and X.Y.W.
Supplementary Material
SUPPLEMENTARY INFORMATION
Acknowledgments
This work was supported by the Ministry of Science and Technology of the People's Republic of China (Grant 2011CB933600) and the Cultivation Plan of Chongqing Science & Technology Commission for 100 Outstanding Science and Technology Leading Talents.
References
- Li C. et al. In vivo real-time visualization of tissue blood flow and angiogenesis using Ag2S quantum dots in the NIR-II window. Biomaterials 35, 393–400 (2014). [DOI] [PubMed] [Google Scholar]
- Chen G. et al. Tracking of Transplanted Human Mesenchymal Stem Cells in Living Mice using Near-Infrared Ag2S Quantum Dots. Adv. Funct. Mater. 10.1002/adfm.201303263 (2013). [Google Scholar]
- Welsher K. et al. A route to brightly fluorescent carbon nanotubes for near-infrared imaging in mice. Nat. Nanotechnol. 4, 773–780 (2009). [DOI] [PMC free article] [PubMed] [Google Scholar]
- Zhang Y. et al. Ag2S Quantum Dot: A Bright and Biocompatible Fluorescent Nanoprobe in the Second Near-Infrared Window. ACS Nano 6, 3695–3702 (2012). [DOI] [PMC free article] [PubMed] [Google Scholar]
- Joo K.-I. et al. Enhanced Real-Time Monitoring of Adeno-Associated Virus Trafficking by Virus–Quantum Dot Conjugates. ACS Nano. 5, 3523–3535 (2011). [DOI] [PMC free article] [PubMed] [Google Scholar]
- Hu P. P. et al. Ultra-sensitive detection of prion protein with a long range resonance energy transfer strategy. Chem. Commun. 46, 8285–8287 (2010). [DOI] [PubMed] [Google Scholar]
- Jin Y. & Gao X. Plasmonic fluorescent quantum dots. Nat. Nanotechnol. 4, 571–576 (2009). [DOI] [PMC free article] [PubMed] [Google Scholar]
- Choi Y. et al. Intracellular Protein Target Detection by Quantum Dots Optimized for Live Cell Imaging. Bioconjugate Chem. 22, 1576–1586 (2011). [DOI] [PubMed] [Google Scholar]
- Hao J., Huang L.-L., Zhang R., Wang H.-Z. & Xie H.-Y. A Mild and Reliable Method to Label Enveloped Virus with Quantum Dots by Copper-Free Click Chemistry. Anal. Chem. 84, 8364–8370 (2012). [DOI] [PubMed] [Google Scholar]
- Du Y. et al. Near-Infrared Photoluminescent Ag2S Quantum Dots from a Single Source Precursor. J. Am. Chem. Soc. 132, 1470–1471 (2010). [DOI] [PubMed] [Google Scholar]
- Welsher K., Sherlock S. P. & Dai H. Deep-tissue anatomical imaging of mice using carbon nanotube fluorophores in the second near-infrared window. Proc. Natl. Sci. 108, 8943–8948 (2011). [DOI] [PMC free article] [PubMed] [Google Scholar]
- Hong G. et al. In Vivo Fluorescence Imaging with Ag2S Quantum Dots in the Second Near-Infrared Region. Angew. Chem. Int. Ed. 51, 9818–9821 (2012). [DOI] [PubMed] [Google Scholar]
- Ropp C. et al. Nanoscale imaging and spontaneous emission control with a single nano-positioned quantum dot. Nat. Commun. 4, 1447 (2013). [DOI] [PubMed] [Google Scholar]
- Lodahl P. et al. Controlling the dynamics of spontaneous emission from quantum dots by photonic crystals. Nature 430, 654–657 (2004). [DOI] [PubMed] [Google Scholar]
- Auffan M. et al. Towards a definition of inorganic nanoparticles from an environmental, health and safety perspective. Nat. Nanotechnol. 4, 634–641 (2009). [DOI] [PubMed] [Google Scholar]
- Jayagopal A., Halfpenny K. C., Perez J. W. & Wright D. W. Hairpin DNA-Functionalized Gold Colloids for the Imaging of mRNA in Live Cells. J. Am. Chem. Soc. 132, 9789–9796 (2010). [DOI] [PMC free article] [PubMed] [Google Scholar]
- Everts M. et al. Covalently Linked Au Nanoparticles to a Viral Vector: Potential for Combined Photothermal and Gene Cancer Therapy. Nano Lett. 6, 587–591 (2006). [DOI] [PubMed] [Google Scholar]
- Huang Y.-F., Lin Y.-W., Lin Z.-H. & Chang H.-T. Aptamer-modified gold nanoparticles for targeting breast cancer cells through light scattering. J Nanopart Res 11, 775–783 (2009). [Google Scholar]
- Popovtzer R. et al. Targeted Gold Nanoparticles Enable Molecular CT Imaging of Cancer. Nano Lett. 8, 4593–4596 (2008). [DOI] [PMC free article] [PubMed] [Google Scholar]
- Chen L. Q. et al. Aptamer-Based Silver Nanoparticles Used for Intracellular Protein Imaging and Single Nanoparticle Spectral Analysis. J. Phys. Chem. B 114, 3655–3659 (2010). [DOI] [PubMed] [Google Scholar]
- Joo K.-I. et al. Site-Specific Labeling of Enveloped Viruses with Quantum Dots for Single Virus Tracking. ACS Nano. 2, 1553–1562 (2008). [DOI] [PMC free article] [PubMed] [Google Scholar]
- Zhang P. et al. Click-Functionalized Compact Quantum Dots Protected by Multidentate-Imidazole Ligands: Conjugation-Ready Nanotags for Living-Virus Labeling and Imaging. J. Am. Chem. Soc. 134, 8388–8391 (2012). [DOI] [PubMed] [Google Scholar]
- Huang B.-H. et al. Surface Labeling of Enveloped Viruses Assisted by Host Cells. ACS Chem. Biol. 7, 683–688 (2012). [DOI] [PubMed] [Google Scholar]
- van der Schaar H. M. et al. Dissecting the cell entry pathway of dengue virus by single-particle tracking in living cells. PLoS pathogens 4, e1000244 (2008). [DOI] [PMC free article] [PubMed] [Google Scholar]
- Liu H., Liu Y., Liu S., Pang D. W. & Xiao G. Clathrin-mediated endocytosis in living host cells visualized through quantum dot labeling of infectious hematopoietic necrosis virus. J. Virol. 85, 6252–6262 (2011). [DOI] [PMC free article] [PubMed] [Google Scholar]
- McDonald D. et al. Visualization of the intracellular behavior of HIV in living cells. J Cell Biol. 159, 441–452 (2002). [DOI] [PMC free article] [PubMed] [Google Scholar]
- Huang L.-L. et al. Enveloped Virus Labeling via Both Intrinsic Biosynthesis and Metabolic Incorporation of Phospholipids in Host Cells. Anal. Chem. 85, 5263–5270 (2013). [DOI] [PubMed] [Google Scholar]
- Hu M. et al. Dark-field microscopy studies of single metal nanoparticles: understanding the factors that influence the linewidth of the localized surface plasmon resonance. J. Mater. Chem. 18, 1949–1960 (2008). [DOI] [PMC free article] [PubMed] [Google Scholar]
- Kang B., Mackey M. A. & El-Sayed M. A. Nuclear Targeting of Gold Nanoparticles in Cancer Cells Induces DNA Damage, Causing Cytokinesis Arrest and Apoptosis. J. Am. Chem. Soc. 132, 1517–1519 (2010). [DOI] [PubMed] [Google Scholar]
- Zhang L. et al. Single Gold Nanoparticles as Real-Time Optical Probes for the Detection of NADH-Dependent Intracellular Metabolic Enzymatic Pathways. Angew. Chem. Int. Ed. 50, 6789–6792 (2011). [DOI] [PubMed] [Google Scholar]
- Ungureanu C. et al. Light Interactions with Gold Nanorods and Cells: Implications for Photothermal Nanotherapeutics. Nano Lett. 11, 1887–1894 (2011). [DOI] [PubMed] [Google Scholar]
- Jain P. K., Huang X., El-Sayed I. H. & El-Sayed M. A. Noble Metals on the Nanoscale: Optical and Photothermal Properties and Some Applications in Imaging, Sensing, Biology, and Medicine. Acc. Chem. Res. 41, 1578–1586 (2008). [DOI] [PubMed] [Google Scholar]
- Lee M.-Y. et al. Hyaluronic Acid–Gold Nanoparticle/Interferon α Complex for Targeted Treatment of Hepatitis C Virus Infection. ACS Nano. 6, 9522–9531 (2012). [DOI] [PubMed] [Google Scholar]
- Huang X., El-Sayed I. H., Qian W. & El-Sayed M. A. Cancer Cell Imaging and Photothermal Therapy in the Near-Infrared Region by Using Gold Nanorods. J. Am. Chem. Soc. 128, 2115–2120 (2006). [DOI] [PubMed] [Google Scholar]
- Brown G. et al. Analysis of the interaction between respiratory syncytial virus and lipid-rafts in Hep2 cells during infection. j.virol. 327, 175–185 (2004). [DOI] [PubMed] [Google Scholar]
- Melero J. A. in J.A. Melero Vol. Volume 14 (ed Cane, Patricia) 1–42 (Elsevier, 2006). [Google Scholar]
- Zou B. Z., Liu Y., Yan X. L. & Huang C. Z. Gold nanoparticles based digital color analysis for quinidine detection. Chin Sci Bull 58, 2027–2031 (2013). [Google Scholar]
Associated Data
This section collects any data citations, data availability statements, or supplementary materials included in this article.
Supplementary Materials
SUPPLEMENTARY INFORMATION


