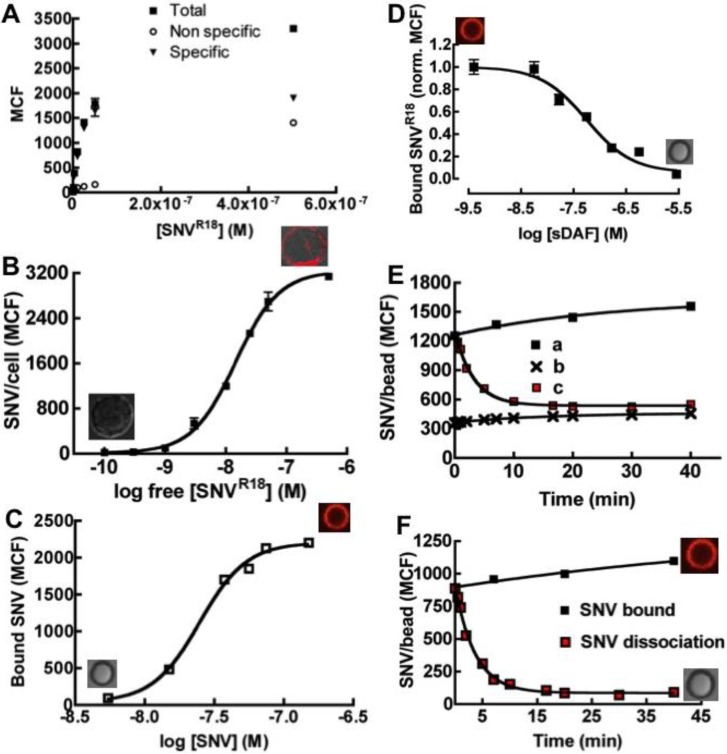
Figure 3.
Binding of SNVR18 to Tanoue B cells and DAF beads. (A) Equilibrium binding of SNVR18 to 10,000 Tanoue B cells in 10 µL. A plot of median channel fluorescence (MCF) of cells incubated with SNVR18 (Non-specific, Total and Specific) versus the concentrations of SNVR18 added. (B) The specific data from (A) recast with log free [SNVR18] on the x-axis. This gives a sigmoid curve, with Kd = 14.0 nM. (C) Equilibrium specific binding of SNVR18 to DAF beads yielding a Kd ~ 24 nM. (D) Competition binding curve using a fixed quantity of SNVR18 and various concentrations of soluble DAF (sDAF), giving a Ki = 58.0 nM. (E) Dissociation of bound SNVR18 from DAF beads, induced by 10-fold excess of unlabeled SNV. (a) Total binding of SNVR18 to (DAF)2-Fc beads, no additions. (b) Non-specific binding to Protein G beads. (c) Addition of 10-fold excess of SNV to SNVR18-bearing DAF beads induces dissociation of SNVR18. (F) Baseline corrected dissociation of SNVR18 from DAF beads. The data was fit to a single exponential decay, yielding koff = 0.0045 s−1.

