

Abstract
Purpose
Circulating tumor cell (CTC) enumeration has not been prospectively validated in standard first-line docetaxel treatment for metastatic castration-resistant prostate cancer. We assessed the prognostic value of CTCs for overall survival (OS) and disease response in S0421, a phase III trial of docetaxel plus prednisone with or without atrasentan.
Patients and Methods
CTCs were enumerated at baseline (day 0) and before cycle two (day 21) using CellSearch. Baseline counts and changes in counts from day 0 to 21 were evaluated for association with OS, prostate-specific antigen (PSA), and RECIST response using Cox regression as well as receiver operator characteristic (ROC) curves, integrated discrimination improvement (IDI) analysis, and regression trees.
Results
Median day-0 CTC count was five cells per 7.5 mL, and CTCs < versus ≥ five per 7.5 mL were significantly associated with baseline PSA, bone pain, liver disease, hemoglobin, alkaline phosphatase, and subsequent PSA and RECIST response. Median OS was 26 months for < five versus 13 months for ≥ five CTCs per 7.5 mL at day 0 (hazard ratio [HR], 2.74 [adjusting for covariates]). ROC curves had higher areas under the curve for day-0 CTCs than for PSA, and IDI analysis showed that adding day-0 CTCs to baseline PSA and other covariates increased predictive accuracy for survival by 8% to 10%. Regression trees yielded new prognostic subgroups, and rising CTC count from day 0 to 21 was associated with shorter OS (HR, 2.55).
Conclusion
These data validate the prognostic utility of CTC enumeration in a large docetaxel-based prospective cohort. Baseline CTC counts were prognostic, and rising CTCs at 3 weeks heralded significantly worse OS, potentially serving as an early metric to help redirect and optimize therapy in this clinical setting.
INTRODUCTION
Prostate cancer (PC) is the most prevalent and the second most lethal cancer in men in the United States,1 with the vast majority of deaths occurring as a result of advanced metastatic disease. Although the duration of response to initial androgen deprivation is improving,2 most men ultimately experience progression to metastatic castration-resistant PC (mCRPC). Treatment of mCRPC has improved with new agents such as abiraterone, enzalutamide, and cabazitaxel3–5; however, the development of personalized and sequential management strategies has been hindered by the inability to identify distinct prognostic subgroups. Prostate-specific antigen (PSA) has limitations as a surrogate for survival end points because of insufficient sensitivity and specificity,6,7 and reliable prognostic and predictive biomarkers are urgently needed to identify men likely to respond to available therapies versus those better suited for alternate or experimental treatments (reviewed by Armstrong et al7).
Recently, analysis of circulating tumor cells (CTCs) was shown to be of prognostic and predictive value in mCRPC and other solid tumors.8–14 In a study of 231 men with mCRPC, high CTC count (≥ five cells per 7.5 mL) before therapy was associated with shorter median survival than low CTC count, and conversion from an unfavorable (≥ five) to a favorable (< five) CTC count with treatment was associated with longer survival.9 A follow-up study of the same cohort of patients with mCRPC analyzed only those patients receiving first-line therapy and showed that absolute CTC count and changes in CTC count measured as continuous variables (rather than categorized) were prognostic for survival in this group.15 Other studies of smaller cohorts demonstrated that captured CTCs can also be assayed for various phenotypic markers such as gene expression or protein markers.10,16–20 Most recently, Scher et al21 analyzed CTCs as a valid intermediate end point for overall survival (OS) in a prospective phase III trial of abiraterone acetate in docetaxel-refractory mCRPC and reported that conversion of CTC counts (from ≥ five to < five cells per 7.5 mL) in response to treatment was reflective and proportional to the treatment effect on OS. Subsequent analysis showed that CTC kinetics fulfilled all of Prentice's criteria for surrogacy for OS. Similarly, in the metastatic hormone-sensitive setting, CTC counts predicted the duration and magnitude of response to androgen-deprivation therapy.12
Collectively, these studies in advanced PC have demonstrated prognostic and predictive roles for CTC analysis in hormone-sensitive disease,12 in mCRPC treated with a variety of first-line therapies,9,15 and in mCRPC treated with second-line hormonal therapy.21 However, to date, the prognostic and predictive value of CTC enumeration has not been assessed prospectively in a large phase III cohort treated homogenously with docetaxel—the standard first-line chemotherapy for mCRPC. To address this question, we undertook a correlative CTC study (principal investigators Cote, Tai, and Goldkorn) that aimed to analyze CTCs in men with mCRPC treated with first-line docetaxel-based therapy in SWOG (Southwest Oncology Group) S0421.
PATIENTS AND METHODS
Study Population
The parent trial for this CTC correlatives study was SWOG 0421, a North American Intergroup phase III trial (participants: SWOG, Eastern Cooperative Oncology Group [ECOG], Cancer and Leukemia Group B/Alliance) for patients with mCRPC involving bone who were randomly assigned in a double-blind manner to docetaxel administered every 3 weeks at a dose of 75 mg/m2 intravenously with oral daily prednisone in combination with placebo or atrasentan, a novel endothelin 1 receptor antagonist that inhibits osteoblast activity.22 S0421 had dual primary end points of OS and progression-free survival (PFS), where progression was defined as the confirmed development of new bone lesions, soft tissue or visceral progression by RECIST criteria, or symptomatic pain progression.
Sample Collection
Blood samples for CTC analysis were collected in accordance with a protocol amendment to S0421 that was reviewed and approved by Cancer Therapy Evaluation Program Central Institutional Review Board and by individual-institution institutional review boards. For each patient, 7.5 mL of blood was drawn into a CellSave tube (Immunicon, Huntingdon Valley, PA) before cycles one and two of chemotherapy (days 0 and 21) and shipped overnight at room temperature to Nevada Cancer Institute (Las Vegas, NV) for CellSearch (Janssen Diagnostics, Raritan, NJ) processing.
CellSearch Processing
Specimens received at Nevada Cancer Institute were assigned an identification number and subsequently analyzed in a coded, blinded manner. The CellSearch system is composed of an automated sample preparation system (CellTracks II AutoPrep; Janssen Diagnostics) that enriches for epithelial cells using antibodies to epithelial-cell adhesion molecule coupled with magnetic beads.9,13,14,23 After magnetic enrichment, isolated cells are stained with the fluorescent nucleic acid dye 4,2-diamidino-2-phenylindole dihydrochloride (DAPI) to identify nucleated cells. Recovered cells subsequently are stained with fluorescently labeled monoclonal antibodies to CD45 (allophycocyanin [APC] channel) and cytokeratins (CK) 8, 18, and 19 (phycoerythrin [PE] channel) to distinguish epithelial cells from leukocytes. Epithelial-cell adhesion molecule+, CK+, CD45−, and DAPI+ cells that fulfill morphologic criteria are counted as CTCs by a certified technician using the semiautomated CellTracks Analyzer II (Janssen Diagnostics) and cross-checked by a pathologist.
Data Analysis and Statistical Considerations
Details are provided in the Data Supplement. The association of CTC count with OS was analyzed by Cox regression, and baseline CTC counts were dichotomized at ≥ five versus < five cells per 7.5 mL, as done previously.9 Changes in CTC counts from day 0 to 21 were evaluated for an association with day-21 OS in a landmark analysis at 3 weeks after random assignment. All models were adjusted for baseline PSA, age, race, ECOG performance status, progression status at entry, Brief Pain Inventory score,24 extraskeletal metastases, liver disease, and laboratory tests (hemoglobin, alkaline phosphatase). Models for change in CTC count at day 21 were adjusted for baseline CTC count. Receiver operator characteristic (ROC) curves were estimated for baseline CTC count and PSA predicting 2-year OS,25 and the integrated discrimination improvement (IDI)26 was estimated for the addition of baseline CTC count to a Cox regression model that included baseline PSA or baseline PSA plus covariates. Exploratory prognostic subgroups were identified by regression-tree analysis27 using the same baseline characteristics. Baseline CTC count or change in CTC count (day 0 to 21) was evaluated for association with PSA response (50% reduction at any time point), adjusting for other risk factors, as well as for association with objective confirmed and unconfirmed complete and partial responses by RECIST criteria.28
RESULTS
CTC analysis in S0421 was proposed and funded after the parent trial had been initiated; therefore, there were approximately 400 eligible patients registered to S0421 during the period of active CTC collection (Fig 1). Of these 400 eligible patients, 263 (66%) submitted usable samples for CTC analysis, of which 238 specimens were evaluable at day 0, and 232 specimens were evaluable at day 21. Of the 238 day-0 specimens processed, 212 yielded evaluable CTC counts. The parent trial (S0421) demonstrated no difference in outcome between the two treatment arms. Accordingly, there were no significant interaction effects by treatment arm for any of the models analyzed, and all results shown are combined across both treatment arms.
Fig 1.
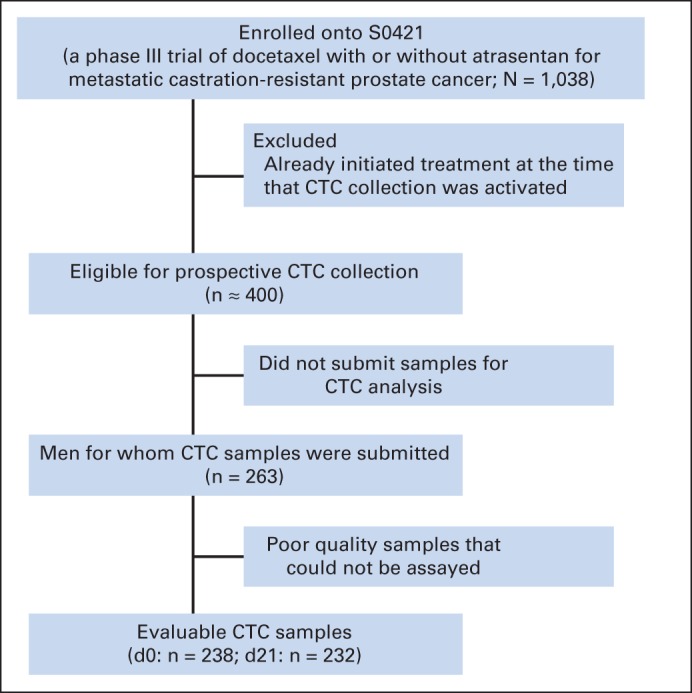
CONSORT diagram of circulating tumor cell (CTC) collection in S0421 study.
The baseline characteristics of the CTC correlatives subpopulation reflected those of the overall parent study cohort (Appendix Table A1, online only). Median CTC count at day 0 was five cells per 7.5 mL and ranged from zero to 5,916, with an interquartile range of 34.25. At random assignment, patients with higher CTC counts (≥ five) had worse bone pain, higher PSA, more liver disease, lower hemoglobin, and higher alkaline phosphatase (Table 1). Baseline (day 0) CTC count was significantly associated with PSA and RECIST response. PSA response was achieved in 63% of patients with < five CTCs per 7.5 mL (n = 104; 95% CI, 52% to 72%) versus only 44% of patients with ≥ five CTCs per 7.5 mL (n = 108; 95% CI, 34% to 53%; P = .01). Similarly, objective RECIST response was achieved in 31% of patients with < five CTCs per 7.5 mL (n = 49; 95% CI, 18% to 45%) versus only 14% of patients with ≥ five CTCs per 7.5 mL (n = 56; 95% CI, 6% to 26%; P = .05).
Table 1.
Study Participant Demographic and Clinical Characteristics
| Characteristic | CTCs < Five per 7.5 mL (n = 104) |
CTCs ≥ Five per 7.5 mL (n = 108) |
P | ||
|---|---|---|---|---|---|
| No. | % | No. | % | ||
| Race | .564 | ||||
| Black | 15 | 0.14 | 11 | 0.10 | |
| Other | 4 | 0.04 | 6 | 0.06 | |
| White | 85 | 0.82 | 91 | 0.84 | |
| Type of progression | 1.000 | ||||
| Measureable/evaluable | 87 | 0.84 | 90 | 0.83 | |
| PSA only | 17 | 0.16 | 18 | 0.17 | |
| Bisphosphonate use | .100 | ||||
| No | 42 | 0.40 | 31 | 0.29 | |
| Yes | 62 | 0.60 | 77 | 0.71 | |
| Worst pain (Brief Pain Inventory score) | .034 | ||||
| < 4 | 67 | 0.64 | 53 | 0.49 | |
| ≥ 4 | 37 | 0.36 | 55 | 0.51 | |
| Extraskeletal metastasis | .977 | ||||
| No | 46 | 0.44 | 49 | 0.45 | |
| Yes | 58 | 0.56 | 59 | 0.55 | |
| Performance status | .224 | ||||
| 0 | 55 | 0.53 | 49 | 0.45 | |
| 1 | 46 | 0.44 | 49 | 0.45 | |
| 2 | 3 | 0.03 | 9 | 0.08 | |
| 3 | 0 | 0.00 | 1 | 0.01 | |
| Missing | 0 | 0.00 | 0 | 0.00 | |
| Gleason score | .914 | ||||
| < 7 | 11 | 0.11 | 11 | 0.10 | |
| 7 | 29 | 0.28 | 33 | 0.31 | |
| > 7 | 61 | 0.59 | 61 | 0.56 | |
| Missing | 3 | 0.03 | 3 | 0.03 | |
| Age at registration, years | .406 | ||||
| Mean | 70 | 69 | |||
| SD | 8 | 10 | |||
| Median | 69 | 68 | |||
| Interquartile range | 63-76 | 62-75 | |||
| Baseline PSA, ng/mL | .004 | ||||
| Mean | 99 | 320 | |||
| SD | 221 | 761 | |||
| Median | 33 | 103 | |||
| Interquartile range | 13-109 | 49-335 | |||
| Liver disease | .028 | ||||
| No | 98 | 0.94 | 91 | 0.84 | |
| Yes | 6 | 0.06 | 12 | 0.11 | |
| Unknown | 0 | 0.00 | 5 | 0.05 | |
| Hemoglobin, g/dL | .001 | ||||
| Mean | 13 | 12 | |||
| SD | 1 | 2 | |||
| Median | 13 | 12 | |||
| Interquartile range | 12-14 | 11-13 | |||
| Alkaline phosphatase | < .001 | ||||
| Mean | 121 | 354 | |||
| SD | 87* | 406 | |||
| Median | 97 | 208 | |||
| Interquartile range | 74-132 | 128-420 | |||
Abbreviations: CTC, circulating tumor cell; PSA, prostate-specific antigen; SD, standard deviation.
For 103 patients.
Kaplan-Meier 2-year survival curves plotted for day-0 CTC counts showed a marked separation, with median OS of 26 and 13 months for < five and ≥ five CTCs per 7.5 mL, respectively (Fig 2). Cox regression analysis of the association between CTC count ≥ five versus < five and OS yielded a hazard ratio (HR) of 2.74 (95% CI, 1.72 to 4.37; P < .001) after correction for other clinical variables (Table 2). ROC curves predicting 2-year OS based on day-0 CTC counts as a continuous measure or on baseline PSA had areas under the curve (AUCs) of 0.781 and 0.655, respectively (Fig 3A). We observed IDI values over survival time from 0 to 2 years that ranged from close to zero to 0.10 (Fig 3B). The solid line in Figure 3B indicates additional proportion of variation in survival model that is explained when CTC count at baseline is added to model with PSA. The addition of CTC count does not contribute as much to the prognostic model during the first 6 months (approximately 4%), but it plateaus approximately 1 year after random assignment at an approximately 10% increase over PSA alone. A similar trend is seen when CTC count at baseline is assessed relative to the multivariable model that included PSA plus other covariates. In that case, the added contribution of CTC count explains approximately 8% of the variability over the full covariate model. Given prior reports suggesting that CTC count may be prognostic not only as a categorical but also as a continuous variable,15 we undertook a regression-tree analysis for baseline (day 0) CTC count and 2-year OS outcome. This analysis yielded additional CTC cut points (zero, one to five, six to 53, and ≥ 54), which in turn generated significant separation of the corresponding Kaplan-Meier survival curves, associated with median OS of 28, 23, 14, and 11 months, respectively (Fig 4).
Fig 2.
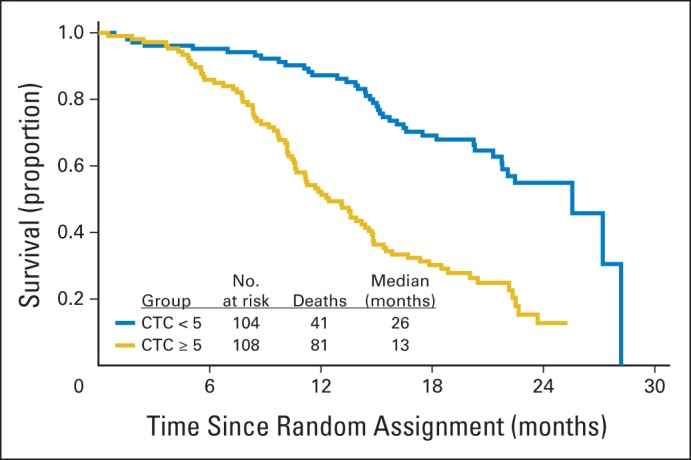
Kaplan-Meier 2-year survival curves plotted for day-0 circulating tumor cell (CTC) count.
Table 2.
Cox Regression Analysis of Association Between CTC Count* and OS and Adjusted for Other Clinical Variables
| Variable | HR | 95% CI | P |
|---|---|---|---|
| Day-0 CTC count ≥ five per 7.5 mL† | 2.74 | 1.72 to 4.37 | < .001 |
| Log2 (day-0 PSA) | 1.03 | 0.93 to 1.13 | .572 |
| Hemoglobin | 0.79 | 0.69 to 0.90 | < .001 |
| Log2 (alkaline phosphatase) | 1.06 | 0.88 to 1.27 | .557 |
| Liver disease | 1.07 | 0.51 to 2.26 | .860 |
| Age | 0.99 | 0.97 to 1.02 | .652 |
| Black race | 0.78 | 0.46 to 1.33 | .361 |
| Performance status | 1.13 | 0.84 to 1.52 | .424 |
| PSA-only progression (v measureable or evaluable disease) | 1.15 | 0.72 to 1.83 | .554 |
| Worst pain ≥ 4 (Brief Pain Inventory score) | 1.21 | 0.80 to 1.82 | .370 |
| Minimal v extensive disease | 0.71 | 0.48 to 1.06 | .096 |
Abbreviations: CTC, circulating tumor cell; HR, hazard ratio; OS, overall survival; PSA, prostate-specific antigen.
CTCs ≥ five versus < five per 7.5 mL.
Association between CTC count and OS; all other rows represent other clinical variables for which the association between CTC count and OS was adjusted.
Fig 3.
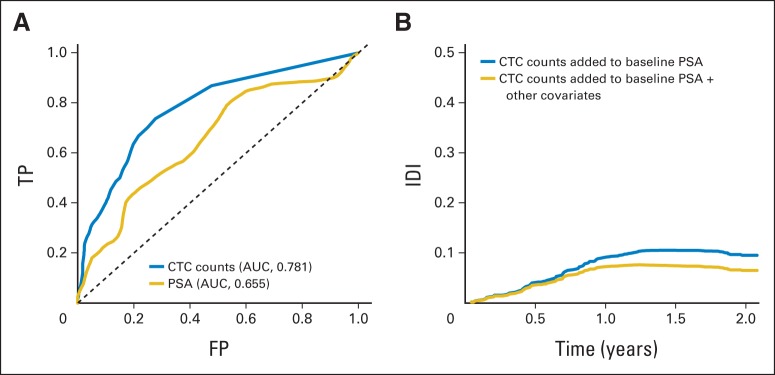
(A) Receiver operator characteristic curves predicting 2-year overall survival based on day-0 circulating tumor cell (CTC) count as continuous measure or based on baseline prostate-specific antigen (PSA). (B) Integrated discrimination improvement (IDI) obtained by adding baseline CTC count to Cox regression model that included either baseline PSA (blue line) or baseline PSA plus covariates (gold line). AUC, area under the curve; FP, false positive; TP, true positive.
Fig 4.
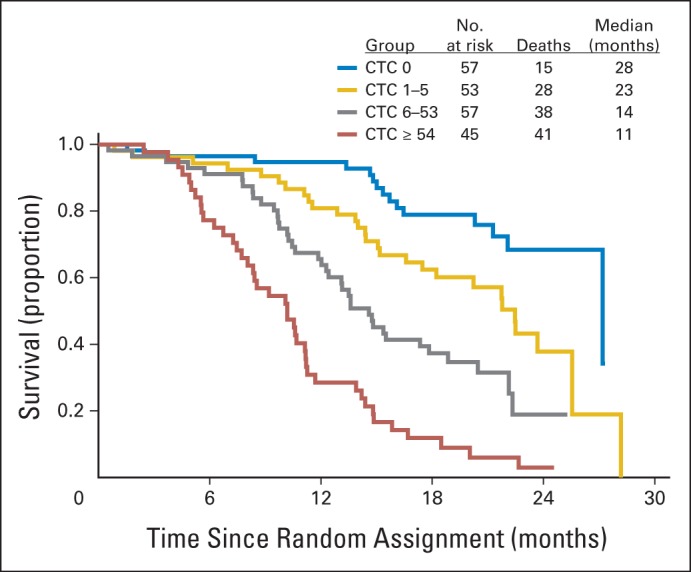
Kaplan-Meier survival curves based on day-0 circulating tumor cell (CTC) count cut points generated from regression-tree analysis.
Changes in CTC count from day 0 to 21 were prognostic (Table 3); any increase in CTC count as a continuous variable from day 0 to 21 was associated with reduced OS (HR, 2.55; P = .041) after adjustment for other baseline clinical variables, including baseline CTC count, whereas any decrease in CTC count as a continuous variable from day 0 to 21 was not significantly associated with OS. Because of this nonlinearity of association between CTC change and OS, possibly resulting from a floor effect or high variability at high numbers (Data Supplement), we pursued additional categorical analyses corresponding to the cut point of five CTCs per 7.5 mL, commonly used in the clinical setting. In patients with day-0 CTC count ≥ five (unfavorable), subsequent decrease of ≥ 50% in CTC count at day 21 was associated with OS HR of 0.53 (P = .071). Conversely, in patients with day-0 CTC count < five (favorable), subsequent increase in CTC count at day 21 was associated with OS HR of 6.47 (P = .002).
Table 3.
Cox Regression Analysis of Association Between Change in CTC Count From Day 0 to 21 and OS Adjusted for Other Clinical Variables
| Variable | HR | 95% CI | P |
|---|---|---|---|
| Model A (all patients) | |||
| Rising CTC count from day 0 to 21* | 2.55 | 1.04 to 6.24 | .041 |
| Falling CTC count from day 0 to 21* | 1.47 | 0.69 to 3.13 | .324 |
| Log2 (day-0 CTC count) | 1.17 | 1.06 to 1.30 | .002 |
| Log2 (baseline PSA) | 0.99 | 0.87 to 1.13 | .915 |
| δ Log2 (PSA from day 0 to 21) | 1.28 | 0.85 to 1.92 | .245 |
| Hemoglobin | 0.77 | 0.65 to 0.91 | .002 |
| Log2 (alkaline phosphatase) | 0.95 | 0.75 to 1.22 | .702 |
| Liver disease | 1.72 | 0.69 to 4.31 | .246 |
| Age | 1.00 | 0.97 to 1.03 | .959 |
| Black race | 0.90 | 0.47 to 1.73 | .761 |
| Performance status | 1.09 | 0.70 to 1.71 | .692 |
| PSA-only progression (v measureable or evaluable disease) | 0.76 | 0.37 to 1.56 | .456 |
| Worst pain ≥ 4 (Brief Pain Inventory score) | 1.47 | 0.90 to 2.38 | .124 |
| Minimal v extensive disease | 0.88 | 0.53 to 1.45 | .609 |
| Model B (subset of patients with unfavorable CTC count at day 0 [≥ five]) | |||
| > 50% fall in CTC count from day 0 to 21*† | 0.53 | 0.27 to 1.06 | .071 |
| Model C (subset of patients with favorable CTC count at day 0 [< five]) | |||
| Rising CTC count from day 0 to 21*† | 6.47 | 1.96 to 21.42 | .002 |
Abbreviations: CTC, circulating tumor cell; HR, hazard ratio; OS, overall survival; PSA, prostate-specific antigen.
Association between change in CTC count and OS; all other rows represent other clinical variables for which the association between change in CTC count and OS was adjusted.
HR, 95% CI, and P value adjusted for covariates listed in model A.
Because PSA is still widely used to gauge response to therapy in the clinical setting, we examined the association between change in CTC count from day 0 to 21 and PSA response, defined as a drop of ≥ 50% while receiving treatment. Among patients with day-0 CTC count < five per 7.5 mL, PSA response was observed in 64% of those whose CTC count did not increase by day 21 (n = 66; 95% CI, 51% to 75%), whereas PSA response was observed in only 33% of those whose CTC count did increase by day 21 (n = 9; 95% CI, 7% to 70%); similarly, among patients with day-0 CTC count ≥ five, PSA response was observed in 50% of those whose CTC count decreased by day 21 (n = 64; 95% CI, 37% to 63%), whereas PSA response was observed in only 26% of those whose CTC count did not decrease by day 21 (n = 19; 95% CI, 9% to 51%; P = .02 for the four groups). Moreover, among patients with day-0 CTC count ≥ five, those with subsequent two-fold drop in CTC count from day 0 to 21 had an odds ratio of 4.63 (95% CI, 1.12 to 18.8; P = .035) for subsequent PSA response compared with those without CTC drop (adjusting for other risk factors). Similar trends were observed for changes in CTC count and RECIST response, although these did not reach statistical significance because of the low number of objective responses (P = .31 for the four groups).
DISCUSSION
Here we report the results of CTC enumeration in SWOG S0421, a phase III double-blind randomized study of first-line docetaxel with or without atrasentan in men with mCRPC. Although most baseline characteristics of the S0421 cohort were quite similar to those of the IMMC (Immunicon) 38 cohort previously reported by de Bono et al,9 men in the IMMC38 cohort had baseline PSA double that of the S0421 cohort (mean, 547 v 250 ng/mL; median, 144 v 79 ng/mL); also, the CTC count range at baseline in the subset of patients receiving first-line therapy in IMMC38 as reported by Scher et al15 was zero to 1,816 per 7.5 mL, whereas the range at baseline (day 0) in S0421 was zero to 5,916 per 7.5 mL. Furthermore, the IMMC38 CTC study had median follow-up of 16.1 months as compared with 24 months for the S0421 study. Remarkably, despite these differences in baseline median PSA, range of CTC count, and length of follow-up between S0421 and IMMC38, the baseline (day 0) median CTC count in our study was five, exactly consistent with the cutoff established in previous studies13,29 and used in IMMC38,9 suggesting that the number of CTCs (as assayed by CellSearch) in patients with metastatic disease falls within a fairly similar distribution across several cohorts and malignancies tested so far.
In our study, baseline (day 0) CTC counts ≥ five per 7.5 mL were associated with recognized indices of higher tumor burden and worse disease outcome, such as worse bone pain, higher PSA, more liver disease, lower hemoglobin, and higher alkaline phosphatase (Table 1). Baseline CTC counts ≥ five were also associated with worse PSA response and RECIST response, worse OS (Table 2), and marked separation of Kaplan-Meier survival curves from those with CTC < five (Fig 2). Notably, ROC curves for day-0 CTC count had considerably higher AUCs than those of day-0 PSA (0.781 v 0.655 ng/mL; Fig 3A), even though this PSA AUC was on the high end of what is typically observed in the CRPC setting. This was further borne out in the Cox regression model (Table 2), which showed that day-0 PSA was not significantly prognostic of OS in this study after accounting for day-0 CTC count. In the Cox model including all risk factors except CTCs predicting survival (listed in Table 2), 21% of the variability of the survival data is explained by those factors. This can be thought of as the contribution of a combination of the sensitivity and specificity of the model. This would suggest that prediction of who is alive and dead with this model over the timespan is modest in this patient population (as has been previously noted30). An IDI analysis showed values in the range of 8% to 10% (Fig 3B), indicating that the addition of baseline CTC count increases the amount of variability explained by the expanded model by at least one third over the span of follow-up. The absolute increase is not large, but the relative contribution is fairly substantial.
Changes in CTC count as early as day 21 (after one cycle of chemotherapy) were prognostic of OS (Table 3). Whereas any rise in CTC count was associated with significantly worse OS, drop in CTC count showed only a trend (nonsignificant) toward improved OS, even when categorized (five CTCs per 7.5 mL cutoff, 50% drop) to account for a potential floor effect and greater variability at higher day-0 count. The nonlinearity of association between OS and falling versus rising CTC count may reflect clinical disease course. An early fall in CTCs may not be sustained in many patients and thus does not portend better outcome. In contrast, an early rise in CTCs in the face of therapy initiation may reflect primary treatment resistance and thus is highly prognostic of poor outcome (HR, 6.47 in men who start with CTC count < five and experience rise by day 21). On the basis of these findings, an early (cycle one) rise in CTC count in a man receiving docetaxel would likely herald poor outcome. Given the potential toxicities of docetaxel and the recent emergence of alternative (eg, hormonal) therapies in this disease state, a rise in CTC count after docetaxel initiation perhaps could trigger a change in management strategy. Biomarker-driven studies of early therapy selection incorporating CTC kinetics are needed to further study and validate this approach.
Beyond these dichotomized (≥ five v < five per 7.5 mL) values, we also conducted an exploratory regression-tree analysis, which identified zero, one to five, six to 53, and ≥ 54 CTCs as potentially informative ranges prognostic of OS (Fig 4). Notably, results from another prospective docetaxel-based cohort were recently presented that independently validated these new expanded CTC cut points (zero, one to five, six to 53, and ≥ 54) generated in our study.31 There is no readily apparent biologic explanation for an additional cut point in the 50-CTC range beyond the intuitive insight that more CTCs connote worse disease, as demonstrated by Scher et al.15 However, such additional cutoffs are hypothesis generating and may reflect important biologic differences in tumor-cell shedding and dissemination. One recent study in small-cell lung cancer reported high CTC numbers, inviting speculation that perhaps prostate cancers with high CTC numbers possess a more neuroendocrine/small-cell phenotype.32 Scher et al reported that analyzing CTC count as a continuous variable rather than a categorical cut point yielded prognostic significance, suggesting that CTC enumeration may perhaps be more informative if used in this fashion.15 Indeed, any rise in CTC count from day 0 to 21 in S0421 was prognostic of significantly worse OS; however, this continuous-variable approach was further strengthened in our study when a categorical component (≥ five v < five CTCs) was integrated, as in the study by de Bono et al.9
Our study constitutes the first prospective validation to our knowledge of CTC count as a prognostic marker in the setting of first-line docetaxel therapy. The S0421 cohort represented a large and diverse population from a multitude of cooperative group institutions (SWOG, Cancer and Leukemia Group B/Alliance, ECOG) across the United States, and the subset of patients from whom CTCs were collected was representative of this larger cohort. CTC collection in this trial setting offered the additional advantage of a well-controlled intervention, wherein all participants were prospectively screened, treated, and observed according to a prescribed protocol. On the basis of these attributes, S0421 offers strong validation in support of incorporating CTC enumeration into the standard management of men initiating first-line docetaxel for the treatment of mCRPC. In this common disease state, high versus low baseline CTC count is strongly prognostic of OS. Perhaps more importantly, even an early rise in CTC count at 3 weeks is highly prognostic of poor OS and may constitute a clinical indication to forego further docetaxel and switch therapy.
Supplementary Material
Appendix
Table A1.
Baseline Patient Characteristics Stratified by CTC Analysis Participation
| Covariate | Participants (n = 263) |
Nonparticipants (n = 775) |
P | ||
|---|---|---|---|---|---|
| No. | % | No. | % | ||
| Race | .581 | ||||
| Black | 35 | 0.13 | 103 | 0.13 | |
| Other | 10 | 0.04 | 42 | 0.05 | |
| White | 218 | 0.83 | 630 | 0.81 | |
| Type of progression | .083 | ||||
| Measureable/evaluable | 221 | 0.84 | 611 | 0.79 | |
| PSA only | 42 | 0.16 | 164 | 0.21 | |
| Bisphosphonate use | .112 | ||||
| No | 92 | 0.35 | 316 | 0.41 | |
| Yes | 171 | 0.65 | 459 | 0.59 | |
| Worst pain (Brief Pain Inventory score) | .217 | ||||
| < 4 | 144 | 0.55 | 460 | 0.59 | |
| ≥ 4 | 119 | 0.45 | 315 | 0.41 | |
| Extraskeletal metastasis | .833 | ||||
| No | 117 | 0.44 | 337 | 0.43 | |
| Yes | 146 | 0.56 | 438 | 0.57 | |
| Performance status | .051 | ||||
| 0 | 129 | 0.49 | 315 | 0.41 | |
| 1 | 111 | 0.42 | 400 | 0.52 | |
| 2 | 21 | 0.08 | 52 | 0.07 | |
| 3 | 2 | 0.01 | 3 | 0.00 | |
| Missing | 0 | 0.00 | 5 | 0.01 | |
| Gleason score | .973 | ||||
| ≤ 7 | 31 | 0.12 | 95 | 0.12 | |
| 7 | 73 | 0.28 | 213 | 0.27 | |
| ≥ 7 | 150 | 0.57 | 436 | 0.56 | |
| Missing | 9 | 0.03 | 31 | 0.04 | |
| Liver disease | .384 | ||||
| No | 233 | 0.89 | 684 | 0.89 | |
| Unknown | 5 | 0.02 | 26 | 0.03 | |
| Yes | 25 | 0.10 | 62 | 0.08 | |
| Age at registration, years | .567 | ||||
| Mean | 69 | 69 | |||
| SD | 9 | 9 | |||
| Median | 69 | 70 | |||
| Interquartile range | 62-76 | 63-76 | |||
| Baseline PSA | .945 | ||||
| Mean | 250 | 247 | |||
| SD | 708 | 613* | |||
| Median | 79 | 70 | |||
| Interquartile range | 21-199 | 25-219 | |||
| Hemoglobin, g/dL | .836 | ||||
| Mean | 12 | 12 | |||
| SD | 2 | 2† | |||
| Median | 12 | 12 | |||
| Interquartile range | 11-13 | 11-13 | |||
| Alkaline phosphatase, units/L | .662 | ||||
| Mean | 240 | 251 | |||
| SD | 301‡ | 442§ | |||
| Median | 134 | 126 | |||
| Interquartile range | 88-256 | 79-249 | |||
Abbreviations: CTC, circulating tumor cell; PSA, prostate-specific antigen; SD, standard deviation.
For 773 patients.
For 770 patients.
For 262 patients.
For 768 patients.
Footnotes
See accompanying editorial on page 1104
Supported in part by Public Health Service Cooperative Agreement Grants No. CA32102, CA38926, CA46368, CA46441, CA58882, CA58861, CA12644, CA22433, CA46282, CA27057, CA58416, CA45807, CA45808, CA45450, CA42777, CA35281, CA20319, CA35090, CA76429, CA14028, CA67575, CA45377, CA68183, CA63848, CA74647, CA16385, CA35192, CA63844, CA11083, CA63845, CA76447, CA35128, CA13612, CA35431, CA76448, CA35178, CA35176, CA35119, CA35421, CA128567, CA04919, CA68183, CA45560, CA37981, CA58723, CA21115, CA31946, CA16116, CA31949, CA014089-38, and CCSRI 015469 from the National Cancer Institute (NCI); by NCI Grant No. 4 RO1 CA141077-03; by the Hope Foundation; and in part by Abbott Laboratories and sanofi-aventis.
Presented in part at the Annual Meeting on Molecular Markers in Cancer of the American Society of Clinical Oncology (ASCO), European Organisation for Research and Treatment of Cancer, and National Cancer Institute, Hollywood, FL, October 11-13, 2012; 48th ASCO Annual Meeting, Chicago, IL, June 1-5, 2012; and 46th ASCO Annual Meeting, Chicago, IL, June 4-8, 2010.
Authors' disclosures of potential conflicts of interest and author contributions are found at the end of this article.
Clinical trial information: NCT00134056.
AUTHORS' DISCLOSURES OF POTENTIAL CONFLICTS OF INTEREST
Although all authors completed the disclosure declaration, the following author(s) and/or an author's immediate family member(s) indicated a financial or other interest that is relevant to the subject matter under consideration in this article. Certain relationships marked with a “U” are those for which no compensation was received; those relationships marked with a “C” were compensated. For a detailed description of the disclosure categories, or for more information about ASCO's conflict of interest policy, please refer to the Author Disclosure Declaration and the Disclosures of Potential Conflicts of Interest section in Information for Contributors.
Employment or Leadership Position: Richard J. Cote, Filtini (U); Nicholas J. Vogelzang, US Oncology (C) Consultant or Advisory Role: David I. Quinn, Dendreon (C), Medivation (C), Astellas Pharma (C), Bayer AG (C), Janssen Pharmaceuticals (C), TEVA Pharmaceuticals Industries (C), Fresenius Kabi (C), Millennium Pharmaceuticals/Takeda Pharmaceuticals (C), Novartis (C), Amgen (C); Ram H. Datar, Filtini (U); Primo Lara Jr, AVEO Pharmaceuticals (C), Medivation (C), Pfizer (C), TEVA Pharmaceuticals Industries (C), Janssen Pharmaceuticals (C), Genentech (C), Immunogen (C), Clovis Oncology (C), Astex (C); Celestia S. Higano, Veridex/Janssen Pharmaceuticals (C); Richard J. Cote, Filtini (U); Nicholas J. Vogelzang, Veridex (C), Abbott Laboratories (C), sanofi-aventis (C), Celgene (C), Roche (C) Stock Ownership: Ram H. Datar, Filtini; Richard J. Cote, Filtini Honoraria: David I. Quinn, Dendreon, Medivation, Astellas Pharma, Bayer AG, Janssen Pharmaceuticals, TEVA Pharmaceuticals Industries, Fresenius Kabi, Millennium Pharmaceuticals/Takeda Pharmaceuticals, Novartis, Amgen; Neeraj Agarwal, Dendreon; Primo Lara Jr, Pfizer, Elsevier, Genentech; Celestia S. Higano, Veridex; Nicholas J. Vogelzang, Dendreon, Medivation, Bayer AG, Janssen Pharmaceuticals Research Funding: David I. Quinn, Millennium Pharmaceuticals, Genentech; Neeraj Agarwal, Takeda Pharmaceuticals, Dendreon, GlaxoSmithKline, Bristol-Myers Squibb, Active BioTech, Novartis, Exelixis, Medivation; Maha Hussain, Abbott Laboratories; Nicholas J. Vogelzang, Bayer AG Expert Testimony: David I. Quinn, Medivation (C), TEVA Pharmaceuticals Industries (C) Patents, Royalties, and Licenses: None Other Remuneration: David I. Quinn, UpToDate; Louis M. Fink, Veridex/Janssen Pharmaceuticals
AUTHOR CONTRIBUTIONS
Conception and design: Amir Goldkorn, David I. Quinn, Catherine M. Tangen, Louis M. Fink, Tong Xu, Ram H. Datar, Mark Garzotto, Philip C. Mack, Celestia S. Higano, Ian Murchie Thompson Jr, Richard J. Cote, Nicholas J. Vogelzang
Financial support: Amir Goldkorn, David I. Quinn, Richard J. Cote
Administrative support: David I. Quinn, Louis M. Fink, Ian Murchie Thompson Jr
Provision of study materials or patients: Amir Goldkorn, David I. Quinn, Michael A. Carducci, Ram H. Datar, Maha Hussain, Richard J. Cote, Nicholas J. Vogelzang
Collection and assembly of data: Amir Goldkorn, Benjamin Ely, David I. Quinn, Catherine M. Tangen, Louis M. Fink, Przemyslaw Twardowski, Neeraj Agarwal, J. Paul Monk III, Ram H. Datar, Mark Garzotto, Maha Hussain, Richard J. Cote, Nicholas J. Vogelzang
Data analysis and interpretation: Amir Goldkorn, Benjamin Ely, David I. Quinn, Catherine M. Tangen, Louis M. Fink, Peter J. Van Veldhuizen, Michael A. Carducci, J. Paul Monk III, Philip C. Mack, Primo Lara Jr, Celestia S. Higano
Manuscript writing: All authors
Final approval of manuscript: All authors
REFERENCES
- 1.Siegel R, Naishadham D, Jemal A. Cancer statistics. CA Cancer J Clin. 2013;63:11–30. doi: 10.3322/caac.21166. [DOI] [PubMed] [Google Scholar]
- 2.Tangen CM, Hussain MH, Higano CS, et al. Improved overall survival trends of men with newly diagnosed M1 prostate cancer: A SWOG phase III trial experience (S8494, S8894 and S9346) J Urol. 2012;188:1164–1169. doi: 10.1016/j.juro.2012.06.046. [DOI] [PMC free article] [PubMed] [Google Scholar]
- 3.Ryan CJ, Smith MR, de Bono JS, et al. Abiraterone in metastatic prostate cancer without previous chemotherapy. N Engl J Med. 2013;368:138–148. doi: 10.1056/NEJMoa1209096. [DOI] [PMC free article] [PubMed] [Google Scholar]
- 4.Scher HI, Fizazi K, Saad F, et al. Increased survival with enzalutamide in prostate cancer after chemotherapy. N Engl J Med. 2012;367:1187–1197. doi: 10.1056/NEJMoa1207506. [DOI] [PubMed] [Google Scholar]
- 5.de Bono JS, Oudard S, Ozguroglu M, et al. Prednisone plus cabazitaxel or mitoxantrone for metastatic castration-resistant prostate cancer progressing after docetaxel treatment: A randomised open-label trial. Lancet. 2010;376:1147–1154. doi: 10.1016/S0140-6736(10)61389-X. [DOI] [PubMed] [Google Scholar]
- 6.Scher HI, Halabi S, Tannock I, et al. Design and end points of clinical trials for patients with progressive prostate cancer and castrate levels of testosterone: Recommendations of the Prostate Cancer Clinical Trials Working Group. J Clin Oncol. 2008;26:1148–1159. doi: 10.1200/JCO.2007.12.4487. [DOI] [PMC free article] [PubMed] [Google Scholar]
- 7.Armstrong AJ, Eisenberger MA, Halabi S, et al. Biomarkers in the management and treatment of men with metastatic castration-resistant prostate cancer. Eur Urol. 2012;61:549–559. doi: 10.1016/j.eururo.2011.11.009. [DOI] [PMC free article] [PubMed] [Google Scholar]
- 8.Danila DC, Fleisher M, Scher HI. Circulating tumor cells as biomarkers in prostate cancer. Clin Cancer Res. 2011;17:3903–3912. doi: 10.1158/1078-0432.CCR-10-2650. [DOI] [PMC free article] [PubMed] [Google Scholar]
- 9.de Bono JS, Scher HI, Montgomery RB, et al. Circulating tumor cells predict survival benefit from treatment in metastatic castration-resistant prostate cancer. Clin Cancer Res. 2008;14:6302–6309. doi: 10.1158/1078-0432.CCR-08-0872. [DOI] [PubMed] [Google Scholar]
- 10.Shaffer DR, Leversha MA, Danila DC, et al. Circulating tumor cell analysis in patients with progressive castration-resistant prostate cancer. Clin Cancer Res. 2007;13:2023–2029. doi: 10.1158/1078-0432.CCR-06-2701. [DOI] [PubMed] [Google Scholar]
- 11.Danila DC, Heller G, Gignac GA, et al. Circulating tumor cell number and prognosis in progressive castration-resistant prostate cancer. Clin Cancer Res. 2007;13:7053–7058. doi: 10.1158/1078-0432.CCR-07-1506. [DOI] [PubMed] [Google Scholar]
- 12.Goodman OB, Jr, Symanowski JT, Loudyi A, et al. Circulating tumor cells as a predictive biomarker in patients with hormone-sensitive prostate cancer. Clin Genitourin Cancer. 2011;9:31–38. doi: 10.1016/j.clgc.2011.04.001. [DOI] [PubMed] [Google Scholar]
- 13.Cristofanilli M, Budd GT, Ellis MJ, et al. Circulating tumor cells, disease progression, and survival in metastatic breast cancer. N Engl J Med. 2004;351:781–791. doi: 10.1056/NEJMoa040766. [DOI] [PubMed] [Google Scholar]
- 14.Cohen SJ, Punt CJ, Iannotti N, et al. Relationship of circulating tumor cells to tumor response, progression-free survival, and overall survival in patients with metastatic colorectal cancer. J Clin Oncol. 2008;26:3213–3221. doi: 10.1200/JCO.2007.15.8923. [DOI] [PubMed] [Google Scholar]
- 15.Scher HI, Jia X, de Bono JS, et al. Circulating tumour cells as prognostic markers in progressive, castration-resistant prostate cancer: A reanalysis of IMMC38 trial data. Lancet Oncol. 2009;10:233–239. doi: 10.1016/S1470-2045(08)70340-1. [DOI] [PMC free article] [PubMed] [Google Scholar]
- 16.Xu T, Lu B, Tai YC, et al. A cancer detection platform which measures telomerase activity from live circulating tumor cells captured on a microfilter. Cancer Res. 2010;70:6420–6426. doi: 10.1158/0008-5472.CAN-10-0686. [DOI] [PMC free article] [PubMed] [Google Scholar]
- 17.Lin HK, Zheng S, Wiliams AJ, et al. Portable filter-based microdevice for detection and characterization of circulating tumor cells. Clin Cancer Res. 2010;16:1–8. doi: 10.1158/1078-0432.CCR-10-1105. [DOI] [PMC free article] [PubMed] [Google Scholar]
- 18.Danila DC, Anand A, Sung CC, et al. TMPRSS2-ERG status in circulating tumor cells as a predictive biomarker of sensitivity in castration-resistant prostate cancer patients treated with abiraterone acetate. Eur Urol. 2011;60:897–904. doi: 10.1016/j.eururo.2011.07.011. [DOI] [PMC free article] [PubMed] [Google Scholar]
- 19.Jiang Y, Palma JF, Agus DB, et al. Detection of androgen receptor mutations in circulating tumor cells in castration-resistant prostate cancer. Clin Chem. 2010;56:1492–1495. doi: 10.1373/clinchem.2010.143297. [DOI] [PubMed] [Google Scholar]
- 20.Moreno JG, Miller MC, Gross S, et al. Circulating tumor cells predict survival in patients with metastatic prostate cancer. Urology. 2005;65:713–718. doi: 10.1016/j.urology.2004.11.006. [DOI] [PubMed] [Google Scholar]
- 21.Scher HI, Heller G, Molina A, et al. Evaluation of circulating tumor cell (CTC) enumeration as an efficacy response biomarker of overall survival (OS) in metastatic castration-resistant prostate cancer (mCRPC): Planned final analysis (FA) of COU-AA-301, a randomized double-blind, placebo-controlled phase III study of abiraterone acetate (AA) plus low-dose prednisone (P) post docetaxel. J Clin Oncol. 2011;29(suppl):293s. abstr LBA4517. [Google Scholar]
- 22.Quinn DI, Tangen CM, Hussain M, et al. Docetaxel and atrasentan compared to docetaxel and placebo for men with advanced castration resistant prostate cancer: SWOG S0421. Lancet Oncol. 2013;14:893–900. doi: 10.1016/S1470-2045(13)70294-8. [DOI] [PMC free article] [PubMed] [Google Scholar]
- 23.US Food and Drug Administration. 510(k) No. K050245: Premarket notification of intent to market device. 2005 [Google Scholar]
- 24.Cleeland CS. The Brief Pain Inventory, a measure of cancer pain and its impact. Quality of Life Newsletter. 1994;9:5–6. [Google Scholar]
- 25.Heagerty PJ, Lumley T, Pepe MS. Time-dependent ROC curves for censored survival data and a diagnostic marker. Biometrics. 2000;56:337–344. doi: 10.1111/j.0006-341x.2000.00337.x. [DOI] [PubMed] [Google Scholar]
- 26.Chambless LE, Cummiskey CP, Cui G. Several methods to assess improvement in risk prediction models: Extension to survival analysis. Stat Med. 2011;30:22–38. doi: 10.1002/sim.4026. [DOI] [PubMed] [Google Scholar]
- 27.Glass TR, Tangen CM, Crawford ED, et al. Metastatic carcinoma of the prostate: Identifying prognostic groups using recursive partitioning. J Urol. 2003;169:164–169. doi: 10.1016/S0022-5347(05)64059-1. [DOI] [PubMed] [Google Scholar]
- 28.Therasse P, Arbuck SG, Eisenhauer EA, et al. New guidelines to evaluate the response to treatment in solid tumors: European Organisation for Research and Treatment of Cancer, National Cancer Institute of United States, National Cancer Institute of Canada. J Natl Cancer Inst. 2000;92:205–216. doi: 10.1093/jnci/92.3.205. [DOI] [PubMed] [Google Scholar]
- 29.Allard WF, Matera J, Miller MC, et al. Tumor cells circulate in the peripheral blood of all major carcinomas but not in healthy subjects or patients with nonmalignant diseases. Clin Cancer Res. 2004;10:6897–6904. doi: 10.1158/1078-0432.CCR-04-0378. [DOI] [PubMed] [Google Scholar]
- 30.Hussain M, Goldman B, Tangen C, et al. Prostate-specific antigen progression predicts overall survival in patients with metastatic prostate cancer: Data from Southwest Oncology Group Trials S9346 and S9916. J Clin Oncol. 2009;27:2450–2456. doi: 10.1200/JCO.2008.19.9810. [DOI] [PMC free article] [PubMed] [Google Scholar]
- 31.Vogelzang NJ, Petrylak DP, Fizazi K, et al. Analysis of circulating tumor cells (CTCs) in a phase 3 study of docetaxel and prednisone (DP) with or without lenalidomide (LEN) in patients (pts) with castrate-resistant prostate cancer (CRPC): The MAINSAIL trial. Presented at the European Cancer Congress; September 27-October 1, 2013; Amsterdam, the Netherlands. [Google Scholar]
- 32.Hou JM, Krebs MG, Lancashire L, et al. Clinical significance and molecular characteristics of circulating tumor cells and circulating tumor microemboli in patients with small-cell lung cancer. J Clin Oncol. 2012;30:525–532. doi: 10.1200/JCO.2010.33.3716. [DOI] [PubMed] [Google Scholar]
Associated Data
This section collects any data citations, data availability statements, or supplementary materials included in this article.