Abstract
A new flame retardant polycarbonate/magnesium oxide (PC/MgO) nanocomposite, with high flame retardancy was developed by melt compounding. The effect of MgO to the flame retardancy, thermal property, and thermal degradation kinetics were investigated. Limited oxygen index (LOI) test revealed that a little amount of MgO (2 wt %) led to significant enhancement (LOI = 36.8) in flame retardancy. Thermogravimetric analysis results demonstrated that the onset temperature of degradation and temperature of maximum degradation rate decreased in both air and N2 atmosphere. Apparent activation energy was estimated via Flynn–Wall–Ozawa method. Three steps in the thermal degradation kinetics were observed after incorporation of MgO into the matrix and the additive raised activation energies of the composite in the full range except the initial stage. It was interpreted that the flame retardancy of PC was influenced by MgO through the following two aspects: on the one hand, MgO catalyzed the thermal-oxidative degradation and accelerated a thermal protection/mass loss barrier at burning surface; on the other hand, the filler decreased activation energies in the initial step and improved thermal stability in the final period.
Keywords: polycarbonates, flame retardance, thermal properties, activation energy
INTRODUCTION
Bisphenol A polycarbonate (PC) has been widely applied currently owing to its unique physical and chemical properties, such as excellent transparency, good mechanical strength, and high heat distortion temperature.1 Although PC is somewhat inherently flame resistant due to its ability to form polyaromatic char and release CO2 upon ignition, it is still essential to develop highly flame retardant PC with the increasing concern for safety and recycling, particularly for electric and electronic applications.2
Numerous additives to improve the flame retardancy of PC have been continuously developed in this decade to meet the increased environmental requirements.3–10 Representatively, aromatic sulfonate compounds,3,4,10 silicon compounds,6,11 and phosphorus compounds12,13 were reported to be effective flame retardant for PC. Despite, the above organic compounds are effective to retard flame of PC, the complex of synthesis as well as the possibility to release deleterious organic compound during burning make them nonfriendly to the environment.14 In addition, the liquid phosphorous compounds that is leaked to the composite surface during processing may be harmful to the processing equipment.15 Therefore, it would be necessary to develop inorganic compounds which not only can improve flame retardany for PC, but also are environment friendly.7,9,15–18 For example, fly ash could improve the flame retardancy by promoting carbonization and forming hydrogen bond between the hydroxyl group on the fly ash surface and the carbonate group of the polycarbonate.16 Graphite oxide could increase the flame retardancy through forming a continuous protective char layer, which acted as a thermal insulator and a mass transport barrier.7 Recent studies indicate that combination of physical effect and chemical reaction from inorganic materials may have synergistic effect to improve the flame retardancy.15,18,19 Therefore, this project aimed to develop new nanocomposite which has synergistic flame retardant effect from physical and chemical effect, thus the flame retardancy can be significantly improved.
It was reported that alkaline earth metallic species could influence the esterification reaction,20,21 which is a major degradation reaction for PC.3,22 As the result, magnesium hydroxide (Mg(OH)2) is a well known class of halogen-free flame retardants. However, to apply Mg(OH)2 to PC, a major concern is that the hydroxyl of the compound or the possible water generated from decomposition of Mg(OH)2 would induce the degradation of PC during processing and thus limit its application to PC.23 Therefore, it would be essential to include a stable magnesium compound, which is expected to significantly improve the flame retardancy of PC while the side effect can be eliminated. Because of the stability of magnesium oxide (MgO) in comparison to Mg(OH)2, MgO was incorporated into PC to form PC/MgO composites in this study. Additionally, the particle with the size of 200 nm was chosen, as the nanoparticle is expected to have the potential to improve the dispersion within PC matrix and produce composite with uniform properties. Based on the catalytic effect of MgO to the esterification of PC, using MgO nanoparticle in PC is expected to combine chemical reaction with physical effect, so the flame retardancy is hoped to be significantly improved. The flame retarding property of the resultant composites was characterized by limited oxygen index (LOI) test, indicating the improved flame retardancy. Thermogravimetric analysis (TGA) was used to investigate the thermal degradation behavior. Apparent activation energy of the thermal degradation was estimated via Flynn–Wall–Ozawa method. Solid residues at different mass loss were characterized by attenuated total reflectance Fourier transform infrared (ATR/FTIR) spectrometry. The underlying mechanisms of the thermal degradation and flame retardancy were discussed.
EXPERIMENTAL
Materials and sample preparation
Commercially available PC (commercial grade: K 1300) pellets were supplied by Teijin Polycarbonate Singapore PTE, Japan. The melt flow rate was 6.4 g per 10 min (300°C at 1.2 kg). MgO particles (200 nm) were obtained from Nanjing Emperor Nano Material, China. PC pellets and MgO powder were dried at 100°C in a vacuum oven for over 24 h prior to processing. Then, ingredients of desired proportions were mixed and melt-compounded in a conical twin-screw extruder of a Haake Rheocord 90, with a diameter of 32/20 mm and a length of 300 mm. Extrusion was performed with a temperature profile of 240°C, 250°C, 260°C, and 255°C from hopper to die and at a screw speed of 50 rpm. After drying in vacuum for 24 h at 100°C to remove the moisture, the pellets were molded into standard specimens on an injection-molding machine (UN120A, Guangdong Yizumi Seiki Machinery, China), at the temperature profile of 240°C, 255°C, 260°C, and 265°C. The pressures for both injection and holding were kept at 35 MPa. For the sake of comparison, unfilled PC as the control was subjected to the same procedure.
Characterizations
Specimens (80 mm × 10 mm × 4 mm) were used to characterize the LOI value using a Stanton Redcroft FTA flammability test unit in accordance with ASTM D-2863-00. After the LOI test, the combusted residues were collected and analyzed using an SEM (JSM-6700F field emission scanning electron microscope) to investigate the surface morphology. Three milligrams of sample, taken from the core of the injection molded specimen, were used for thermal analysis and ATR/FTIR characterizations. The thermal and thermal-oxidative properties were characterized by a Pyris 1 TGA under N2 condition and a Perkin-Elmer TGA-7 under air atmosphere with airflow of 25 mL/min, respectively. ATR/FTIR spectrometry was performed using a Thermo Nicolet 6700 FTIR equipped with an attenuated total reflectance device (Smart Orbit) with diamond crystal. Spectra were signal averaged over 32 scans at a resolution of 4 cm−1.
RESULTS AND DISCUSSION
Flame retardancy property
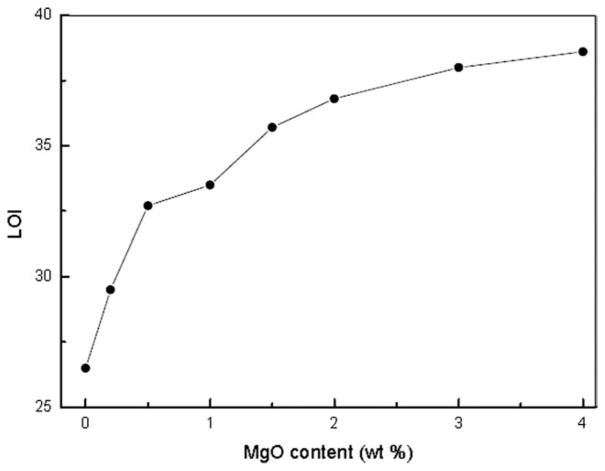
LOI tests were used to evaluate the effect of flame retardancy to PC. Figure 1 is the curve of LOI with increasing MgO content. It is shown that the LOI is only about 26.5 without any MgO. However, with the addition of only 0.2 wt % MgO, the LOI sharply increased to 29.5. The LOI increased almost linearly up to 32.7 for PC/MgO nanocomposites (0.5 wt %). In addition, Figure 2 shows that MgO particles were nanodispersed in PC matrix. In comparison to organic retardant additive, this amount is significantly less than that of organic retardant additive, e.g., poly(3-aminopropyl methylsiloxane bis(3-hydroxyphenyl spirocyclic pentaerythritol bisphosphate), which usually requires 15 wt % to reach the similar LOI.13 MgO has similar effect on the flame retardancy for PC as potassium diphenyl sulfonate.5 These results indicate that a small amount of MgO could significantly improve the flame retardancy of PC.
Figure 1.
LOI values as a function of MgO content.
Figure 2.
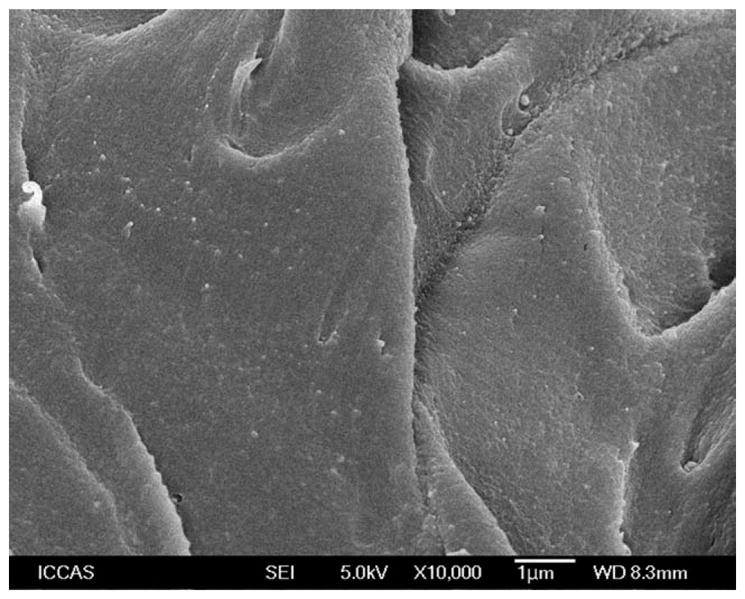
SEM image of PC/MgO nanocomposite (0.5 wt %).
Additionally, increasing the amount of MgO continuously increases the LOI, but the increase trend becomes lower. For example, the LOI value increases from 26.5 of pure PC to 36.8 for the sample with only a content of 2.0 wt % MgO in the matrix, while double the MgO amount to 4 wt % only led 38.6. These clearly indicate that, if the same amount of MgO is added, the effect to improve the retardancy will be greater if the total amount of MgO is less.
The mechanism of flame retardant will depend on the additive and the polymer matrix. The general effect of flame retardant is to influence the morphology of the char.13,17 The mechanism of aromatic sulfonate compounds for increasing the flame retardancy is to quickly form a char layer at the burning surface.3,4 Silicon compounds could improve the flame retardant because it can form crosslinking structured char via chain-building reactions between the thermal degradation products and the polymer matrix.11 The formed char could act as a good insulating barrier to prevent the combustion. It was suggested that phosphorous containing compounds could increase the flame retardancy by condensed phase action as well as gas phase action.12
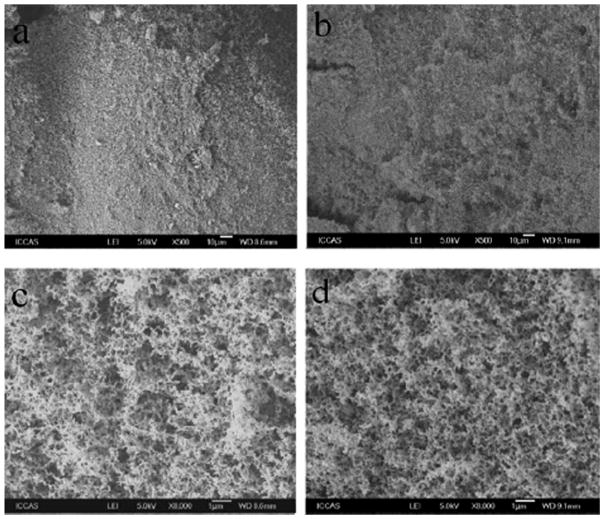
SEM was used to investigate whether the surface morphology changed after incorporation of MgO. Figure 3 shows the representative SEM micrographs of the combusted residues. While coarse surface [Fig. 3(a, b)] was observed at low magnification, many small holes were observed on the charred surface from higher magnification [Fig. 3(c, d)]. The fact that no obvious difference was observed between the micrographs from PC [Fig. 3(c)] and PC/MgO nanocomposite [Fig. 3(d)] at the same magnification reveals that MgO might not influence the final morphology of the char when the samples were burned in the LOI condition.
Figure 3.
SEM micrographs of the samples after the LOI test: pure PC (a, c) and PC/MgO (4.0 wt %) nanocomposite (b, d).
Thermal property
TGA was used to characterize the thermal degradation in terms of mass loss and to evaluate the effect of MgO to the degradation of PC. To simulate thermal shock in the combustion, isothermal experiments (400°C, 450°C, and 500°C, under air atmosphere) were carried out with an initial heating rate of 100 °C/min (Fig. 4). At 400°C, PC only has slight weight loss around 17% until 30 min, while it has almost 50% weight loss at 450°C. The increase of weight loss with increasing the temperature is easily understood due to the fact that higher temperature promotes the decomposition of PC.
Figure 4.
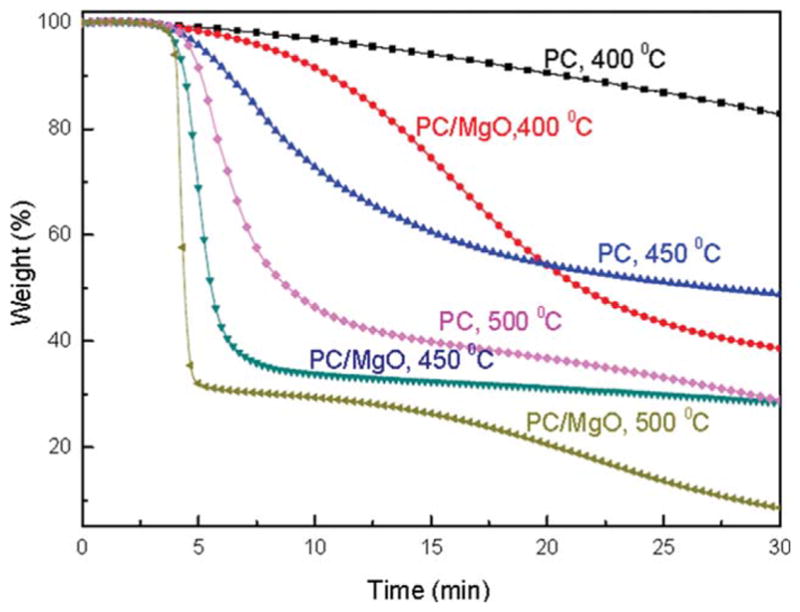
Isothermal TGA curves for pure PC and PC/MgO (4.0 wt %) nanocomposite under air atmosphere. [Color figure can be viewed in the online issue, which is available at wileyonlinelibrary.com.]
For PC/MgO nanocomposite, increase of weight loss with increasing temperature is similar to that of PC alone. However, an interesting observation is that, at each specific temperature, the weight loss of PC/MgO nanocomposite is greater than that of PC alone. As an example, the weight loss of PC/MgO nanocomposite is 73%, while that of PC alone is only 49% from the same heating time at 450°C. Similar effect from MgO was observed from both lower (400°C) and higher (500°C) temperatures. The difference between the weight loss of PC/MgO nanocomposite and PC alone indicate that the presence of MgO will promote the decomposition of PC.
Moreover, the shapes of the TGA curves of PC/MgO nanocomposite and PC alone are rather different. The TGA curve of PC alone at 450°C shows a gradual weight decrease with a slight transition range between 5 and 15 min from quick to slow loss. However, the TGA curve of PC/MgO nanocomposite at 450°C shows a sharp decrease from 5 min and almost has no change after 7 min. This clearly shows that, in the presence of MgO, PC decomposition has been completed within only 2 min at 450°C. Similarly, such sharp decrease was also observed from both lower (400°C) and higher (500°C) temperatures. In comparison to those of PC only at related temperature, we can assure that MgO will not only increase the weight loss of PC within a similar time range, but also MgO will accelerate the decomposition rate of PC significantly. The acceleration of decomposition by MgO may indicate that MgO could catalyze the thermal-oxidative degradation, which is in agreement with our hypothesis.
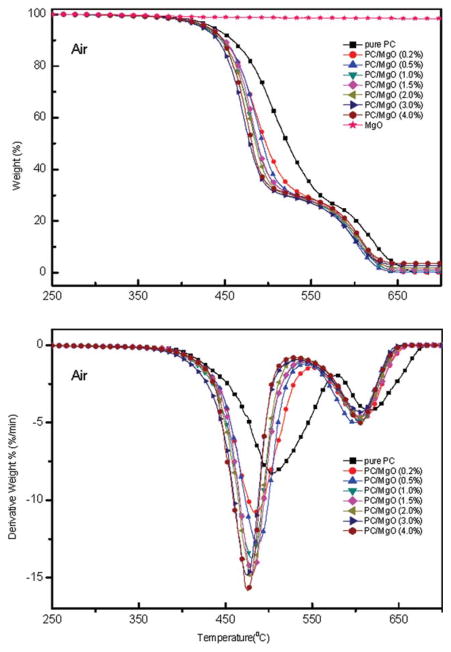
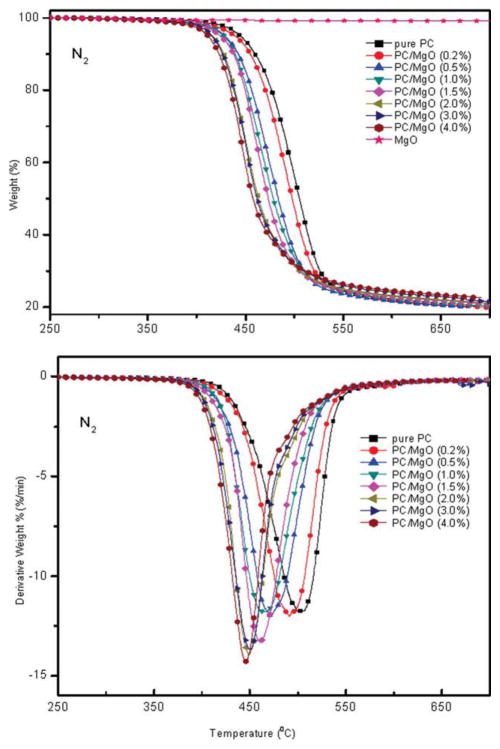
Dynamic TGA tests were performed at a heating rate of 10 °C/min under both air and N2 atmosphere. Typical TGA and DTG thermograms of pristine PC and PC/MgO composites are shown in Figures 5 and 6. It is found that all samples show a two-step decomposition process in air condition (Fig. 5) while only a single step in N2 atmosphere (Fig. 6). In addition, the TGA curves shift to lower temperature as the MgO content increases, confirming accelerating effect of MgO to the degradation of PC. Table I summarizes the temperatures at which 5 wt % weight loss occurs (T5%) and the temperatures of the maximum weight loss rate (Tmax1, peak of the derivative curve). It is demonstrated that both T5% and Tmax1 decrease in air and N2 atmosphere as the amount of MgO increase and this behavior maintains throughout the degradation, confirming that addition of MgO will accelerate the degradation of PC. Taking PC/MgO nanocomposite with 4% MgO as an example, the difference between PC alone and PC/MgO nanocomposite, ΔT5% (T5% of pure PC minus T5% of PC/MgO (4.0 wt %) composite) is 6°C in air atmosphere whereas it is as high as 33°C in N2 condition. This implies that MgO significantly influences the degradation of PC in N2 more than that in air.
Figure 5.
TGA and DTG curves of PC/MgO composites in air atmosphere. [Color figure can be viewed in the online issue, which is available at wileyonlinelibrary.com.]
Figure 6.
TGA and DTG curves of PC/MgO composites in nitrogen atmosphere. [Color figure can be viewed in the online issue, which is available at wileyonlinelibrary.com.]
TABLE I.
TGA Data for Neat PC and PC/MgO Composites (10 °C/min)
| MgO (wt %) | Air atmosphere
|
N2 atmosphere
|
||||
|---|---|---|---|---|---|---|
| T5%a (°C) | Tmax1b (°C) | tdc (min) | T5%a (°C) | Tmax1b (°C) | tdc (min) | |
| 0 | 436 | 505 | 12.25 | 445 | 504 | 7.71 |
| 0.2 | 428 | 486 | 11.34 | 439 | 491 | 7.65 |
| 0.5 | 428 | 488 | 10.40 | 428 | 472 | 7.74 |
| 1.0 | 426 | 481 | 10.28 | 428 | 465 | 7.71 |
| 1.5 | 431 | 481 | 9.82 | 424 | 461 | 7.92 |
| 2.0 | 429 | 479 | 9.63 | 416 | 449 | 8.61 |
| 3.0 | 423 | 475 | 9.82 | 416 | 450 | 9.26 |
| 4.0 | 430 | 476 | 9.41 | 412 | 445 | 9.98 |
The thermal degradation temperature at which 5 wt % weight loss occurs.
The thermal degradation temperature corresponding to the maximum loss rate in the first degradation stage.
The time needed for the sample degraded from 5 wt % to 70 wt %.
In air atmosphere, the thermal-oxidative decomposition was promoted. As shown in Figure 5, the first maximum mass loss rate increased significantly from 7.5%/min for pristine PC to 15.1%/min for PC/MgO (4.0 wt %) composite (Fig. 5) and td decreased from 12.25 min to 9.41 min (Table I), which meant thermal-oxidative degradation was accelerated by the additive. The final amount of each residue was close to the initial amount of additive (Fig. 5), indicating that MgO did not significantly enhance the char residue but accelerated the thermal-oxidative decomposition of PC.3,10 Based on the above results it can be concluded that MgO could accelerate the thermal-oxidative degradation process and promote the formation of char layer at the burning surface. The volatile in the pyrolysis acted as blowing agent and caused the swelling char-like layer at the burning surface. The char prevented volatilization of combustible volatiles by aromatization and charring, inhibited heat and oxygen transferring into the undecomposed bulk and slowed down the diffusion of the formed fuel toward the atmosphere. Interestingly, the maximum mass loss rate increased slightly (Fig. 6) but td increased from 7.71 min for pristine PC to 9.98 min (Table I) for PC/MgO (4.0 wt %) composite in N2 atmosphere, which meant that MgO played a different role during the thermal degradation process. To give a further perspective of the degradation, kinetics was investigated by TGA.
Kinetics analysis
TGA experiment has indicated that MgO could catalyze the degradation of PC, and it can additionally provide information to investigate the kinetics parameters such as activation energy, frequency factor, the rate of decomposition, and in some cases, the order of the decomposition reaction.24,25 Thus, the following kinetics study will provide in-depth information to understand the mechanism of degradation. In a pragmatic sense, the objective of kinetics is often to provide a mathematical relationship in time, temperature, and conversion. There are several mathematical models that could be used to obtain kinetics parameters from the solid-state kinetic data. Generally, these models fall into two groups namely model-fitting and model-free (isoconversional) methods. Model-fitting methods can only yield a single average value for any process, but the degradation of polymeric materials normally involves multiple steps characterized by different activation energies. Isoconversional methods have gained widespread usage as they are not model-special and assumed independent of the dynamic heating rate and temperature. Therefore, it is possible to calculate the apparent activation energy, Eα, as a function of the given extent of conversion (α).
In this study, the multiple heating rate kinetics method is used to estimate the apparent activation energy, applying the Flynn–Wall–Ozawa method24–28 specifically derived for heterogeneous chemical reaction under linear heating rates (2.5 °C/min, 5 °C/min, 7.5 °C/min, and 10 °C/min). The derivation of the Flynn–Wall–Ozawa method from the first principle was presented in 1965.26 After simplification, the method is expressed by the equation:
where f(x) denotes the conversional functional relationship; A, the pre-exponential factor; Eα, the apparent activation energy; R, the gas constant; β, the heating rate and T, the absolute temperature. Assuming that the reaction rate is only a function of temperature, the above equation can be further simplified to model-free expression as:
Activation energy was calculated from the slope of the isoconversional plots of log (β) versus 1/T for a fixed degree of conversion. As shown in Figure 7, the obtained apparent activation energies are plotted as a function of α. The initial activation energies (α is below 3%) for PC/MgO (4.0 wt %) composite are lower than those of neat PC, it can speculate that MgO catalyzes the degradation process in the initial stage. As the conversion increases, the activation energies of the composite are much higher than those of pure PC, especially in the final stage (α is higher than 50%). It is implied that the intermediate of the composite is more stable than that of pure PC owing to the addition of MgO. Thus the flame retarding property was enhanced and the degradation time (td) increased. It was reported that three degradation steps existed in the thermal degradation of pristine PC when applying high-resolution TGA technique.29 The similar tendency of the Eα values for PC/MgO (4.0 wt %) composite and pure PC in the whole range confirms the degradation mechanism.
Figure 7.
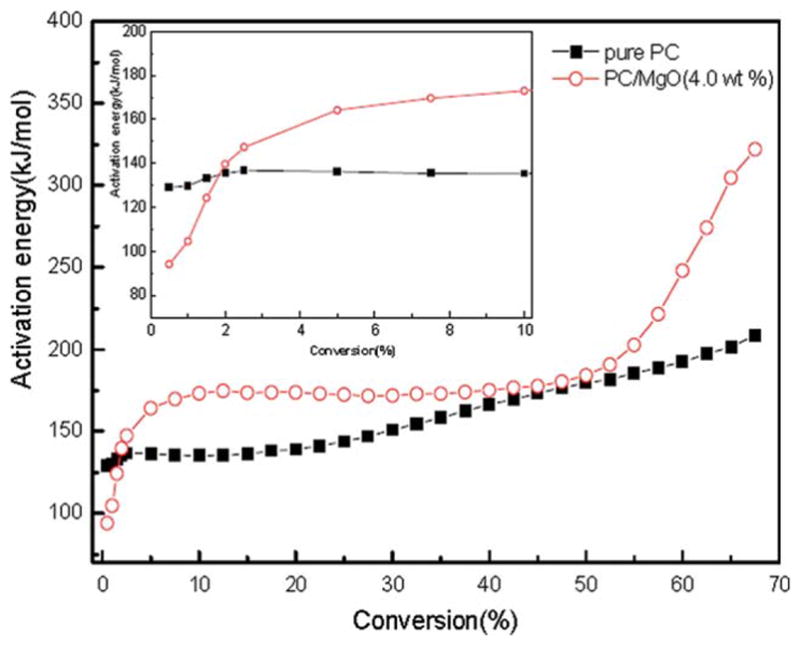
Plot of E versus extent of conversion for pure PC and PC/MgO (4.0 wt %) composite under nitrogen atmosphere. [Color figure can be viewed in the online issue, which is available at wileyonlinelibrary.com.]
Degradation mechanism and ATR/FTIR analysis
Generally, it is believed that the presence of oxygen accelerates the radical formation during heating irradiation. However, the involvement of oxygen in the degradation of the polymer during combustion is not clear. Although the environment of the decomposing sample may affect the degradation pathway, it has been pointed out that, in the case of combustion, there may be no oxygen effect during combustion because oxygen is not present with the degrading polymer beneath the burning surface.30 So thermal degradation in inert atmosphere directly correlates with the flame property of polymer, especially for the condensed-phase mechanism category.
Although a substantial number of works22,31–35 have paid attention to the thermal degradation mechanism of PC in inert atmosphere, controversies on the mechanisms are still existing. The representative controversies are whether xanthone functional group is generated and whether the chain scission of isopropylidene linkage occurs first during thermal degradation.3,22 Based on our findings about the three-step degradation from kinetics analysis, the used PC in this study is supposed to have a three-step degradation pathway (Scheme 1), which is similar to the previous report.3 First, PC is subjected Kolbe–Schmidt rearrangement to form acarboxylic acid transit species. Then, the formed carboxylic acid was subjected to either decarboxylation, dehydration, or crosslinking to form the char. It must be noted that different commercial product of PC might give rise to different degradation pathway.
Scheme 1.
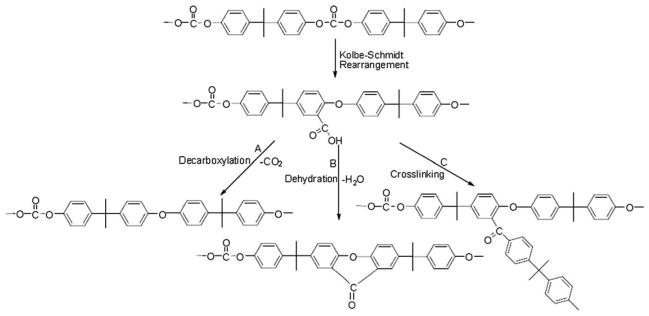
Proposed degradation pathway of PC.
To analyze the proposed mechanism, ATR/FTIR has been conducted to investigate the possibly formed species. The solid residues for ATR/FTIR characterization were obtained at different weight loss under N2 condition. Spectra were collected on different spots of the surface. Figures 8 and 9 are the ATR/FTIR spectra of pure PC and PC/MgO (4.0 wt %) composite at different mass loss. The peak at 827 cm−1 corresponds to para out-of-plane aromatic C—H wag; the peak at 1187 cm−1 is attributed to carbonate C—O stretch; the peak at 1362 cm−1 is due to CH3 symmetric deformation; the peak at 1504 cm−1 is ascribed to para aromatic ring semicircle stretch; the peak at 1768 cm−1 corresponds to carbonate C =O stretch and the band in 2800–3200 cm−1 region corresponds to C—H stretching vibrations of polycarbonate.1 According to the literature, the peak at 1660 cm−1 is ascribed to the characteristic carbonyl peak of xanthone.22,36
Figure 8.
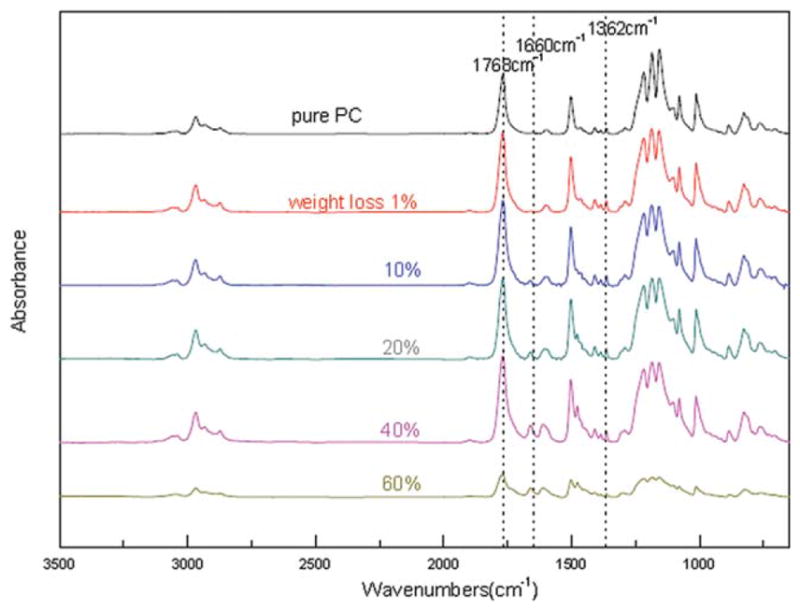
ATR/FTIR spectra: solid residue samples of PC at different mass loss. [Color figure can be viewed in the online issue, which is available at wileyonlinelibrary.com.]
Figure 9.
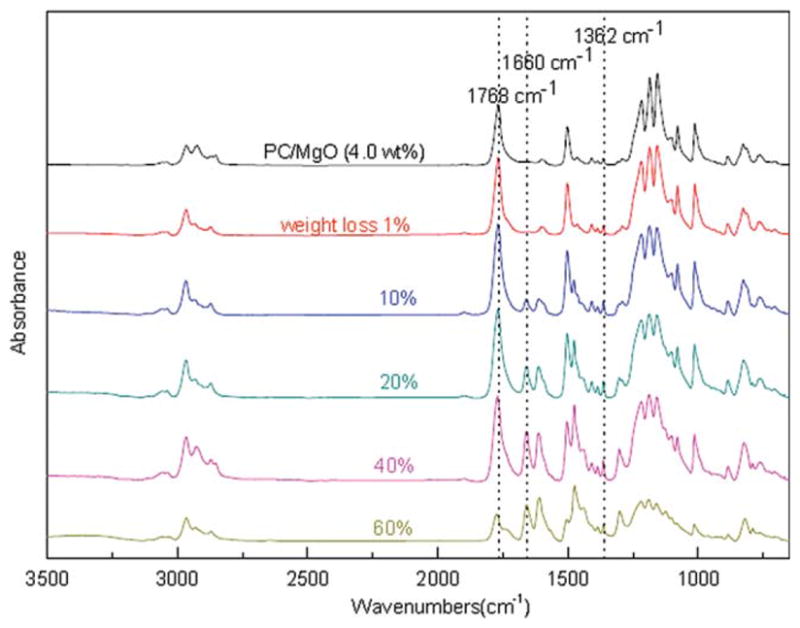
ATR/FTIR spectra: solid residue samples of PC/MgO (4.0 wt %) composite at different mass loss. [Color figure can be viewed in the online issue, which is available at wileyonlinelibrary.com.]
Figures 8 and 9 show the quantitative change of the related peaks during degradation. Little change of peak at 1362 cm−1 and the band in 2800–3200 cm−1 region at the initial stage suggests that methyl scission did not occur first in our experiments. The bands in the 1631–1676 cm−1 region and 1682–1863 cm−1 region show quantitative change as the degradation proceeds. The peak at 1660 cm−1 emerges and becomes stronger as the degradation proceeds, indicating the amount of formed xanthone becomes greater with the degradation.
The amount of formed carbonyl and xanthone were estimated by the quantitative analysis of the ATR/FTIR spectra on the specific peaks. The intensities of the peaks in ATR/FTIR spectra were normalized by dividing the intensities of the CH3 symmetric deformation peak at 1362 cm−1.37 The normalized intensities of the peak 1768 cm−1 were measured in the sample before ( ) and after ( ) thermal degradation. The ratio is used to quantify the variation of C =O concentration in the samples. The amount of xanthone group in each sample is also evaluated by introducing a xanthone index (Rxanthone defined as the normalized intensity of the xanthone peak at 1660 cm−1). The reported data here are an average of at least five different measurements.
Figure 10 presents the quantitative change of ρc=o and Rxanthone. It can be found that ρc=o decreases significantly and no xanthone group is generated in the initial stage (α is below 3%). It suggests that carbonyl is consumed by the Kolbe–Schmidt rearrangement,36 following by decarboxylations shown in Scheme 1(A). For PC/MgO (4.0 wt %) composite, ρc=o decreases sharply than that of pure PC. It means that MgO reduces the activation energies and accelerates the evolution of incombustible gas (CO2) in the initial degradation stage, which is favorable for improving the flame retardancy. ρc=o decreases as the conversion proceeds, suggesting that carbonyl is consumed by dehydration reaction as shown in Scheme 1(B),36 thus Rxanthone increases. MgO accelerates the formation of xanthone group in this process, thus more incombustible gas (H2O) was released in this step. The released vapor is favorable for improving the flame retardancy. Alkaline earth metal compounds were reported as effective catalyst for trans-esterification.21,38 Maybe esterification reaction Scheme 1(C) is catalyzed in the last stage (α is higher than 50%). Therefore, the activation energies are significantly improved. The intermediate is difficult to degrade; the residue char would be more stable. It is well known that the stable carbonaceous char could resist transfer of heat and mass during a fire, thus the flame retardancy is improved. However, to further understand how MgO particles affect the flame retarding property, additional studies, including other flame retardant characterization methods, rheology studies, melt viscosity measurements, and electron micrograph work of samples in different states of thermal decomposition (pre- and postignition samples as well as postfire samples), are required. A three step thermal degradation of PC is proposed. Addition of MgO can accelerate the degradation process. The contributions to improving the flame retardancy are that MgO could decrease activation energy in the initial step and improve thermal stability in the final period.
Figure 10.
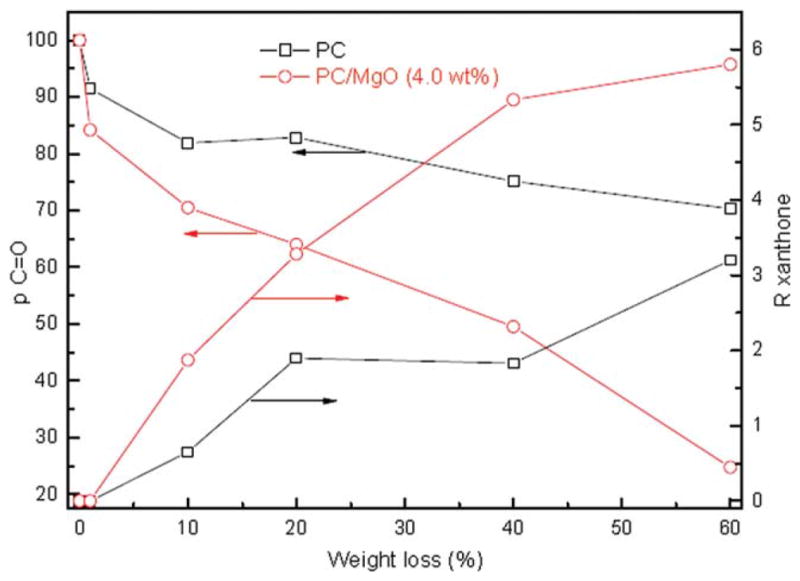
R and ρ index versus mass loss. [Color figure can be viewed in the online issue, which is available at wileyonlinelibrary.com.]
CONCLUSIONS
PC/MgO nanocomposites were prepared by melt compounding. The thermal properties and flame retardancy have been investigated. LOI studies conclude that a little amount of MgO within PC can significantly improve the flame retardancy. Three obvious degradation kinetic steps in the thermal degradation kinetics after incorporation of MgO in the matrix were observed. TGA and ATR/FTIR analysis concluded that the flame retardancy of PC was influenced by MgO through two aspects. One was that MgO catalyzed the thermal-oxidative degradation and accelerated a thermal protection/mass loss barrier at burning surface; the other was that the filler decreased activation energy in the initial step and improved thermal stability in the final period. The flame retardancy mechanism is likely a condensed-phase phenomenon.
Acknowledgments
Contract grant sponsor: National Natural Science Foundation of China; contract grant numbers: 50973115, 21074142.
Contract grant sponsor: National High Technology Research and Development Program of China (863 Program); contract grant number: 2009AA033601.
References
- 1.Mark JE. Polymer Data Handbook. Oxford University Press; New York: 1999. [Google Scholar]
- 2.Balart R, Sanchez L, Lopez J, Jimenez A. Polym Degrad Stab. 2006;91:527. [Google Scholar]
- 3.Ballistreri A, Montaudo G, Scamporrino E, Puglisi C, Vitalini D, Cucinella S. J Polym Sci Part A Polym Chem. 1988;26:2113. [Google Scholar]
- 4.Nodera A, Kanai T. J Appl Polym Sci. 2004;94:2131. [Google Scholar]
- 5.Wang YZ, Yi B, Wu B, Yang B, Liu Y. J Appl Polym Sci. 2003;89:882. [Google Scholar]
- 6.Liu SM, Ye H, Zhou YS, He JH, Jiang ZJ, Zhao JQ, Huang XB. Polym Degrad Stab. 2006;91:1808. [Google Scholar]
- 7.Higginbotham AL, Lomeda JR, Morgan AB, Tour JM. ACS Appl Mater Interfaces. 2009;1:2256. doi: 10.1021/am900419m. [DOI] [PubMed] [Google Scholar]
- 8.Grause G, Sugawara K, Mizoguchi T, Yoshioka T. Polym Degrad Stab. 2009;94:1119. [Google Scholar]
- 9.Dong QX, Chen QJ, Yang W, Zheng YL, Liu X, Li YL, Yang MB. J Appl Polym Sci. 2008;109:659. [Google Scholar]
- 10.Huang XB, Ouyang XY, Ning FL, Wang JQ. Polym Degrad Stab. 2006;91:606. [Google Scholar]
- 11.Zhou W, Yang H. Thermochim Acta. 2007;452:43. [Google Scholar]
- 12.Pawlowski KH, Schartel B. Polym Int. 2007;56:1404. [Google Scholar]
- 13.Li LK, Wei P, Li J, Jow J, Su K. J Fire Sci. 2010;28:523. [Google Scholar]
- 14.Caschili S, Delogu F, Cao G. Ann Chim (Rome) 2005;95:813. doi: 10.1002/adic.200590094. [DOI] [PubMed] [Google Scholar]
- 15.Zhang W, Li X, Guo X, Yang R. Polym Degrad Stab. 2010;95:2541. [Google Scholar]
- 16.Soyama M, Inoue K, Iji M. Polym Adv Technol. 2007;18:386. [Google Scholar]
- 17.Feng J, Hao JW, Du JX, Yang R. J Polym Degrad Stab. 2010;2041:95. [Google Scholar]
- 18.He QL, Song L, Hu Y, Zhou S. J Mater Sci. 2009;44:1308. [Google Scholar]
- 19.Peeterbroeck S, Laoutid F, Swoboda B, Lopez-Cuesta JM, Moreau N, Nagy JB, Alexandre M, Dubois P. Macromol Rapid Commun. 2007;28:260. [Google Scholar]
- 20.Li XJ, Hayashi J, Li CZ. Fuel. 2006;85:1509. [Google Scholar]
- 21.Kouzu M, Kasuno T, Tajika M, Yamanaka S, Hidaka J. Appl Catal A. 2008;334:357. [Google Scholar]
- 22.Jang BN, Wilkie CA. Polym Degrad Stab. 2004;86:419. [Google Scholar]
- 23.Pawlowski KH, Schartel B. Polym Degrad Stab. 2008;93:657. [Google Scholar]
- 24.Menczel JD, Prime RB. Thermal Analysis of Polymers—Fundamentals and Applications. Wiley; New Jersey: 2009. [Google Scholar]
- 25.Chigwada G, Kandare E, Wang DY, Majoni S, Mlambo D, Wilkie CA, Hossenlopp JM. J Nanosci Nanotechnol. 2008;1927:8. [PubMed] [Google Scholar]
- 26.Ozawa TB. Chem Soc Jpn. 1965;38:1881. [Google Scholar]
- 27.Flynn JH, Wall LA. J Polym Sci Part B Polym Lett. 1966;4:323. [Google Scholar]
- 28.Flynn JH. J Therm Anal. 1983;27:95. [Google Scholar]
- 29.Li XG, Huang MR. Polym Int. 1999;48:387. [Google Scholar]
- 30.Jang BN, Wilkie CA. Thermochim Acta. 2005;426:73. [Google Scholar]
- 31.Wiley RH. Macromolecules. 1971;4:254. [Google Scholar]
- 32.Montaudo G, Carroccio S, Puglisi C. J Anal Appl Pyrol. 2002;64:229. [Google Scholar]
- 33.Puglisi C, Sturiale L, Montaudo G. Macromolecules. 1999;32:2194. [Google Scholar]
- 34.Puglisi C, Samperi F, Carroccio S, Montaudo G. Macromolecules. 1999;32:8821. [Google Scholar]
- 35.Davis A, Golden JH. J Gas Chromatogr. 1967;5:81. [Google Scholar]
- 36.Oba K, Ohtani H, Tsuge S. Polym Degrad Stab. 2001;74:171. [Google Scholar]
- 37.Zammarano M, Gilman JW, Nyden M, Pearce EM, Lewin M. Macromol Rapid Commun. 2006;27:693. [Google Scholar]
- 38.Kouzu M, Kasuno T, Tajika M, Sugimoto Y, Yamanaka S, Hidaka J. Fuel. 2008;87:2798. [Google Scholar]


