Abstract
A strategy for simultaneous study of the structure and internal dynamics of a membrane protein is described using the REDCRAFT algorithm. The membrane-bound form of the Pf1 major coat protein (mbPf1) was used as an example. First, synthetic data is utilized to validate the simultaneous study of structure and dynamics with REDCRAFT using dihedral restraints and backbone N-H RDCs from two different alignments. Subsequently, the validated analysis is applied to experimental data and confirms that REDCRAFT produces meaningful structures from sparse RDC data. Furthermore, simulated data from a two state jump motion is used to illustrate the necessity for simultaneous consideration of structure and dynamics. Disregarding internal dynamics during the course of structure determination is shown to produce an average-state that is not related to the two intermediate states. During the analysis of RDC data from the dynamic model, REDCRAFT appropriately identifies the region separating the static and dynamic domains of the protein. Finally, analysis of experimental data strongly suggests the existence of internal motion between the amphipathic and the transmembrane helices of the membrane-bound form of the protein. The ability to perform fragmented structure determination of each domain without a priori assumption of the order tensors allows an independent determination of the order tensors, which yields a more comprehensive description of protein structure and dynamics and is particularly relevant to the study of membrane proteins.
Keywords: REDCRAFT, simultaneous, backbone, protein, structure, motion, residual dipolar coupling, dynamics
1. Introduction
Nuclear Magnetic Resonance (NMR) structure determination of proteins has traditionally relied largely on Nuclear Overhauser Effect (NOE) data, which yield short-distance restraints between atoms in close proximity. In recent years, however, residual dipolar couplings (RDCs) have played an increasingly important role in structure determination of protein structures by NMR, due in part to their ability to orient distant portions of a protein with respect to a common frame of reference. Furthermore, for some classes of proteins, such as membrane proteins, NOEs are an insufficient source of structural restraints and have largely been replaced by RDCs.
RDCs have additional value for use in structure determination. Their sensitivity to internal motions on picosecond to millisecond time scales [1–3] is valuable in elucidating the internal dynamics of a protein. Studies of dynamics have traditionally been performed in separate steps; the protein’s structure is determined under the assumption of static positions of the atoms using a fixed order tensor, and only later are its motions characterized. The structure determination protocols based on the assumption of molecular rigidity produce a single structure based on data that are perturbed by internal dynamics. The degree of similarity between the static model of a protein structure and many conformations of a dynamic model is not always clear and merits further investigation. A more appealing, rigorous approach is simultaneous treatment of both the structure and dynamics of a protein. The REDCRAFT algorithm [4] provides this capability. Here we analyze the membrane bound form of Pf1 coat protein as an example of a membrane protein using REDCRAFT. We demonstrate REDCRAFT’s ability to determine this protein’s structure and internal dynamics in the complete absence of NOE data by utilizing only RDCs and TALOS torsion angle constraints. We define internal motion as dynamics of domains or rigid fragments of a macromolecule relative to each other. The membrane-bound form of Pf1 coat protein consists of two α-helices separated by a short loop. We further show that REDCRAFT provides strong evidence for the existence of internal motion between the two helices, and that the helices exhibit markedly different order tensors when treated separately. Finally, we compare the REDCRAFT structure to structures determined under the static assumption. The complete software binary, source code and manuals are available for public access via the web at http://ifestos.cse.sc.edu. REDCRAFT is distributed with tools to provide REDCAT [5] input files and XPLOR-NIH [6] constraint files for further refinement.
2. Theoretical Background
2.1. Residual Dipolar Coupling
Residual dipolar coupling (RDCs) data have been used extensively in recent years for structural studies of a broad range of macromolecules, including globular proteins [7–13], membrane proteins [14; 15], nucleic acids [16–20], and carbohydrates [21–24]. They have also been used to provide insights into the internal dynamics of protein structures [3; 25; 26]. A thorough description of RDCs can be found in Section S1.
The RDCs for a protein can be collected into a single formulation as shown in Equation 1.
| (1) |
In this equation, xi , yi and zi are the Cartesian coordinates of the normalized ith internuclear vector and ri is the ith RDC. The Saupe order tensor matrix S = [Sxx Syy Sxy Sxz Syz]T[27] provides information about the anisotropy introduced by partial alignment [28–30]. This symmetric, traceless, 3×3 matrix contains five degrees of freedom. Given the vectors and collected RDCs, an order tensor can be estimated for the sample in an alignment medium [5; 33]. Substituting this estimate into Equation 1 yields a set of backcomputed RDCs c1…cn. The RMSD between these back-computed RDCs and the experimental RDCs provides a measure of fitness between the RDCs and the assigned vectors :
| (2) |
where m is the number of alignment media. Under practical conditions the experimental error should provide an upper bound to the RMSD score shown in equation 2. An RMSD score that exceeds the magnitude of the experimental error has several possible causes such as: mis-assigned RDCs, a severe violation of acceptable peptide geometry, or the existence of internal motion. The analysis presented here assumes properly assigned RDCs and no severe violations of peptide geometry; high RMSD values are attributed solely to the presence of internal motions.
Some proteins exhibit a modular structure with several rigid fragments. These fragments may either be domains or sections of a single domain. When these fragments undergo motion relative to one another, each fragment will yield a separate order tensor describing its average orientation and strength of alignment [34–36]. Elucidation of these individual order tensors yields information about the relative alignments of these average fragment orientations. It is also possible for order tensors from different fragments to yield a complete description of the internal dynamics of a protein on biologically relevant time scales [34; 35; 37].
2.2. Simultaneous Structure and Motion with REDCRAFT
REDCRAFT [4; 38; 39] is an RDC data analysis tool that is capable of simultaneous structure determination and identification of internal motion. RDCs play an increasingly important role in NMR structure determination because of their unique advantages over traditional NOE data [40]. Structure determination based primarily on RDC data requires algorithms that operate in fundamentally different ways from those that use NOE data, and several new programs have been proposed for this purpose [7; 12; 41–45]. However, the rich information content and complexity of RDC data continues to challenge current analysis tools. Furthermore, identification of the mobile domains or fragments of macromolecules is critical not only for the study of the molecule’s internal motion, but also for accurate structure determination. Other software packages like Xplor-NIH [6], CNS [46], or CYANA [47] are capable of using RDCs during the process of structure determination, however, they rely on an accurate a priori estimate of the order parameters (Sxx, Syy, Szz or Da/R). The estimate is often obtained from an unrefined NOE based structure, although recent developments have enabled the calculation of order tensors in the absence of assignment or an initial structure [14; 48]. This process for structure determination uses a single order tensor that applies to the whole molecule, which imposes the assumption that the entire protein is rigid. This approach may perturb portions of the structure with different dynamics with respect to remainder of the molecule. Structural deviations may not be confined just to the mobile regions, since the rigid fragments of a protein may not even be oriented correctly with respect to one another [35]. REDCRAFT provides the ability to determine a protein’s structure while recognizing fragments that are mobile with respect to each another. Once the dynamic fragments of a protein are identified, each of them can be individually subjected to structure determination. This process allows each fragment to be characterized using a separate order tensor that describes its anisotropic alignment.
REDCRAFT’s approach to structure determination proceeds in two stages: Stage-I and Stage-II. During Stage-I a list of all possible torsion angles between any two adjoining peptide planes is pruned (using data such as scalar couplings or Ramachandran constraints) and ranked based on structural fitness to the RDC data. Stage-II of REDCRAFT extends a given fragment of size N peptide planes (initially a single peptide seed) by addition of one peptide plane at a time. All backbone torsion angles retained from Stage-I are considered for the new peptide plane, yielding a large number of candidate structures. Typically the 2,000–10,000 structural candidates that best fit the RDC data are propagated forward for the next iteration of adding a peptide plane. The number of structures propagated forward is called the search depth. This process provides a sufficiently diverse population of conformers to prevent entrapment in local minima.
Stage-II provides the unique ability to identify points of internal motion during the process of structure extension. REDCRAFT reports the fitness between the given RDCs and the best structure at each residue; the metric used to quantify this fitness is the RMSD between the experimental and back-computed RDCs. The plot of RDC fitness as a function of residue number is called the dynamic profile. Analyzing the dynamic profile provides insight into the quality of the final structure and the likelihood that the data represent a rigid structure. A dynamic-profile of REDCRAFT analysis may consist of a number of distinct phases. A typical dynamic-profile for a static structure consists of three distinct phases. During the first phase the REDCRAFT score (also the RDC fitness as described in equation 2), will be zero while the system remains under-determined (less than 5–7 RDCs). The score gradually increases as a function of fragment size as the initial fragment elongates to include a sufficient number of RDCs (> 7 RDCs). Finally, the increasing score will stabilize with a value near that expected from experimental error. Final scores slightly higher than the expected values are not diagnostic and are artifacts of the algorithm. In contrast, for a protein with internal motions, the dynamic profile will show a marked increase in RDC fitness at the residue separating two fragments that are moving relative to one another. The actual residue at which motion occurs may not be the residue at which the increase is observed. Several residues after the point of motion may need to be incorporated for the effect of motion to become recognizable in the dynamic profile. This lag is due to the number of RDC data points per residue. A portion of a dynamic-profile with decreasing score may be indicative of a region with exceptionally high-quality of data or a region with sparse data.
2.3. Pf1 Major Coat Protein
Pf1 is a filamentous bacteriophage that infects Pseudomonas aeruginosa. The major coat protein of Pf1 contains 46 residues and plays two major roles in the viral lifecycle. During infection, newly synthesized copies of the protein are stored within the host cell’s membrane prior to virus assembly, which occurs at the cell membrane. After the virus particles are extruded from the membrane and assembled, the coat protein forms the capsid surrounding the DNA and constitutes the bulk of the virus particles. Static structures have been previously determined for the membrane-bound form (PDB: 2KLV) and the viral coat form (PDB: 1PJF). In both cases, the structure of the major coat protein consists of two α-helices connected by a short stretch of residues with irregular conformations. The major difference between these two structures is the orientation of the N-terminal amphipathic helix. Here we examine the ane-bound form of the Pf1 major coat protein, which we refer to as mbPf1. In the membrane-bound form of the protein the N-terminal helix contacts the membrane surface (the amphipathic helix) and the C-terminal helix is inserted into the membrane (the transmembrane helix). The main question that we investigate here is what effects do the amphipathic helix’s motions relative to the transmembrane helix have on the structure determined for the protein in micelles by solution NMR spectroscopy
2.4. Simulated RDC Data
Simulated RDC data are often crucial in establishing the fundamentals of any algorithmic approach. Simulated RDC data are used to validate REDCRAFT’s ability to identify internal dynamics for mbPf1. Although this has been established in a general context [4], it is possible that any observed evidence of internal dynamics for mbPf1 is an anomaly related to the special nature of this protein’s structure. The structure of mbPf1 is non-globular, consisting of two α-helical regions joined by a loop. In α-helices, backbone N-H vectors exhibit a near-parallel orientation and may provide a less than optimal number of independent data values. The non-globular structure of mbPf1 (with its apparently perpendicular helices) may lead to a condition that is problematic for REDCRAFT; anomalous features of the dynamic-profile may resemble that of internal dynamics. Structure determination of this protein using simulated data can help to eliminate the structural characteristics of this protein as the source of any observed internal dynamics. We therefore utilize simulated RDC data from a sample mbPf1 structure under static and dynamic conditions to illustrate and validate the performance of REDCRAFT on this system.
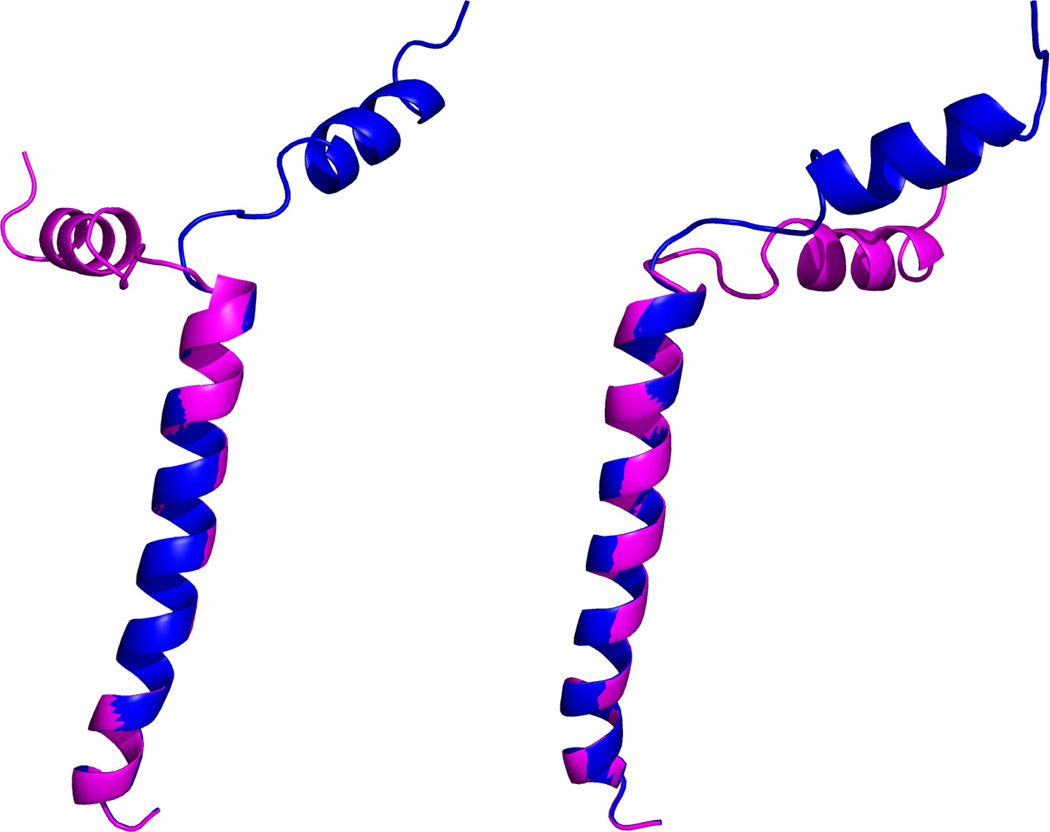
The two order tensors shown in Table 1 were used to generate simulated RDC data. These two order tensors produce a range of RDCs very similar to the experimental data. The first model from the ensemble of previously determined structures for this protein was used to generate simulated data. A derivative structure was created to model a two-state motion. The second state of the simulated motion was derived from the first state by altering the φ angle of the 19th residue by 60°. This corresponds to a motion in the amphipathic helix, as shown in Figure 1. This model of motion is similar to that speculated for mbPf1 in lipid environments. Molmol [49] was used for manipulation of the protein structure. The dynamic averaging function of REDCAT was used to calculate RDC data for the simulated two-state jump motion. The final calculated RDC data for both the static and dynamic cases were altered through the addition of ±0.5Hz of uniformly distributed noise; this level of noise corresponds to the previously reported experimental error. The simulated motion influences the overall observed alignment of the molecule and manifests itself as an alteration of the simulated order tensors. Table 2 lists the values for the effective principal order parameters obtained after simulation of motion and addition of ±0.5Hz of error. Minor differences between the values listed in Table 1 and Table 2 are due to the addition of noise, while major differences are due to the effect of internal motion.
Table 1.
Order tensors used to simulate RDC data from two alignment media. These order tensors were used for both the static and dynamic cases.
| Alignment medium |
Sxx | Syy | Szz | α | β | γ | Da | R |
|---|---|---|---|---|---|---|---|---|
| M1 | 3.00E-004 | 5.00E-004 | −8.00E-004 | 0 | 0 | 0 | −9.74 | 0.17 |
| M2 | −4.00E-004 | −6.00E-004 | 1.00E-003 | −40 | −50 | 60 | 12.18 | 0.13 |
Figure 1.
The simulated two state motion of mbPf1, with the two states in blue (original model) and purple (second state model), as shown from two perspectives. The φ angle of the 19th residue is modified by 60°to produce the second model.
Table 2.
Order tensors reported from the simulated RDC data from two regions of mbPf1 under the assumption of two rigid fragments that undergo motion relative to one another. Residues 1–13 are simulated to undergo motion with respect to the static region residues 20–45. Residues from the loop region are excluded.
| Residues | Alignment medium |
Sxx | Syy | Szz | Da | R |
|---|---|---|---|---|---|---|
| 1–13 | M1 | 3.78E-06 | 4.89E-04 | −4.93E-04 | −6.00 | 0.66 |
| M2 | 4.95E-05 | 5.43E-04 | −5.92E-04 | −7.21 | 0.56 | |
| 20–45 | M1 | 3.01E-04 | 4.99E-04 | −8.00E-04 | −9.74 | 0.17 |
| M2 | −4.01E-04 | −5.97E-04 | 9.98E-04 | 12.15 | 0.13 |
2.5. Experimental RDC Data
Isotopically labeled Pf1 coat protein was prepared as described previously [50]. NMR samples were prepared by dissolving the purified protein in 400 µl of 100 mM deuterated DHPC (1,2-dihexyl-sn-glycero-3-phosphocholine; www.isotope.com) containing 10% (v/v) 2H2O, at pH 6.7. Weakly aligned samples for RDC measurement were prepared either by soaking the micellar sample into a dried 6% polyacrylamide gel overnight, with the length of the gel restricted to 22 mm from an initial length of 30 mm, or by adding fd bacteriophage at a final concentration of 28 mg/ml [48], yielding two independent alignments of the protein.
NMR experiments were performed on a Bruker DRX 600 MHz spectrometer equipped with a 5 mm triple-resonance cryogenic probe and a z-axis gradient at 40°C. 1H-15 N IPAP-HSQC [48] spectra obtained on isotropic and weakly aligned samples were used to measure the 1H-15 N RDCs. The NMR data were processed using the programs NMRPipe/NMRDraw and NMRView [51].
2.6. Dihedral Constraints
Dihedral angle restraints were derived from TALOS [11] analysis of the chemical shifts measured by solution NMR from isotropic micelle samples and from Dipolar wave analyses [52; 53] of 1H/15N RDCs with weakly aligned micelle samples. The helical regions of the protein included those residues for which the RMSD between the experimental values and the data fit to helix was less than the experimental error (0.5Hz for RDCs).
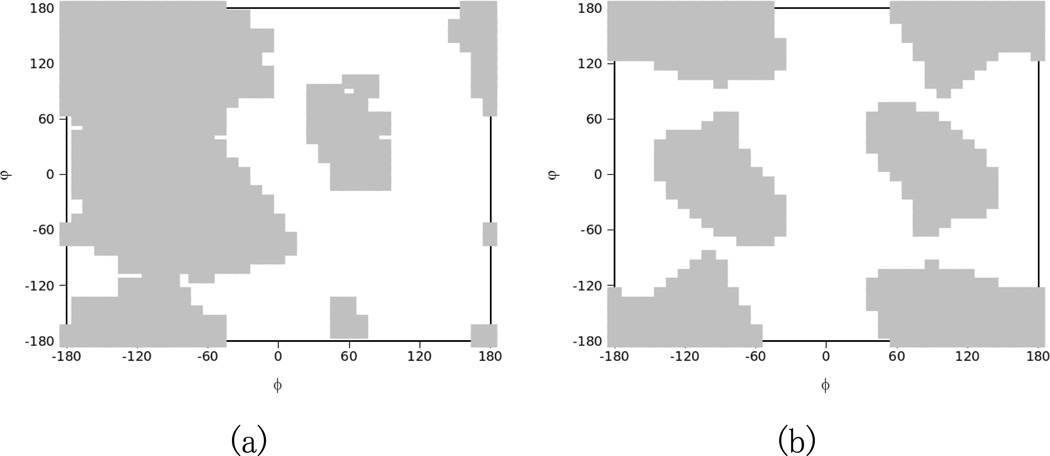
Typical dihedral restraints (shown in Figure 2a) based on Ramachandran plots were used for residues 14–19 that constitute the loop region of this protein. An alternative dihedral restraint space that was used for glycines located in the loop region is shown in Figure 2b.
Figure 2.
Ramachandran based dihedral constraints for a non-glycine (a) or a glycine (b) residue for use as REDCRAFT torsion angle constraints. Gray blocks represent the allowed torsion angles for consideration during REDCRAFT computations. The solution space for glycine differs due to its unique flexibility.
3. Results
3.1. Simulated Data and Static Structure
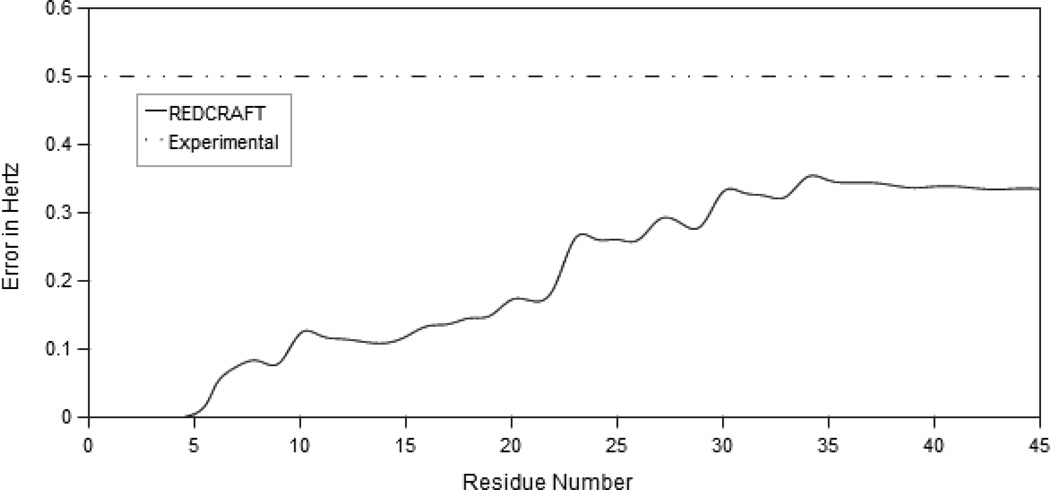
Simulated RDC data generated from the static structure and the dihedral restraints were converted to the REDCRAFT format [4]. REDCRAFT was used to calculate the structure with a search depth of 2,000. Figure 3 provides the dynamic profile for these data, showing the REDCRAFT score as a function of the number of residues in a fragment. The REDCRAFT score reflects the fitness of the RDC data to the calculated structure, with a smaller value indicating a better fitness. The final structure calculated by REDCRAFT clearly satisfies the expected experimental error. The lack of a sharp increase in the REDCRAFT score, and the fact that the final REDCRAFT score is below the experimental error, clearly demonstrate that there are no points of internal motion.
Figure 3.
The dynamic profile of REDCRAFT for the static structure mbPf1 using simulated data. REDCRAFT’s computed error stays consistently below the expected experimental error. This is indicative of a well determined structure.
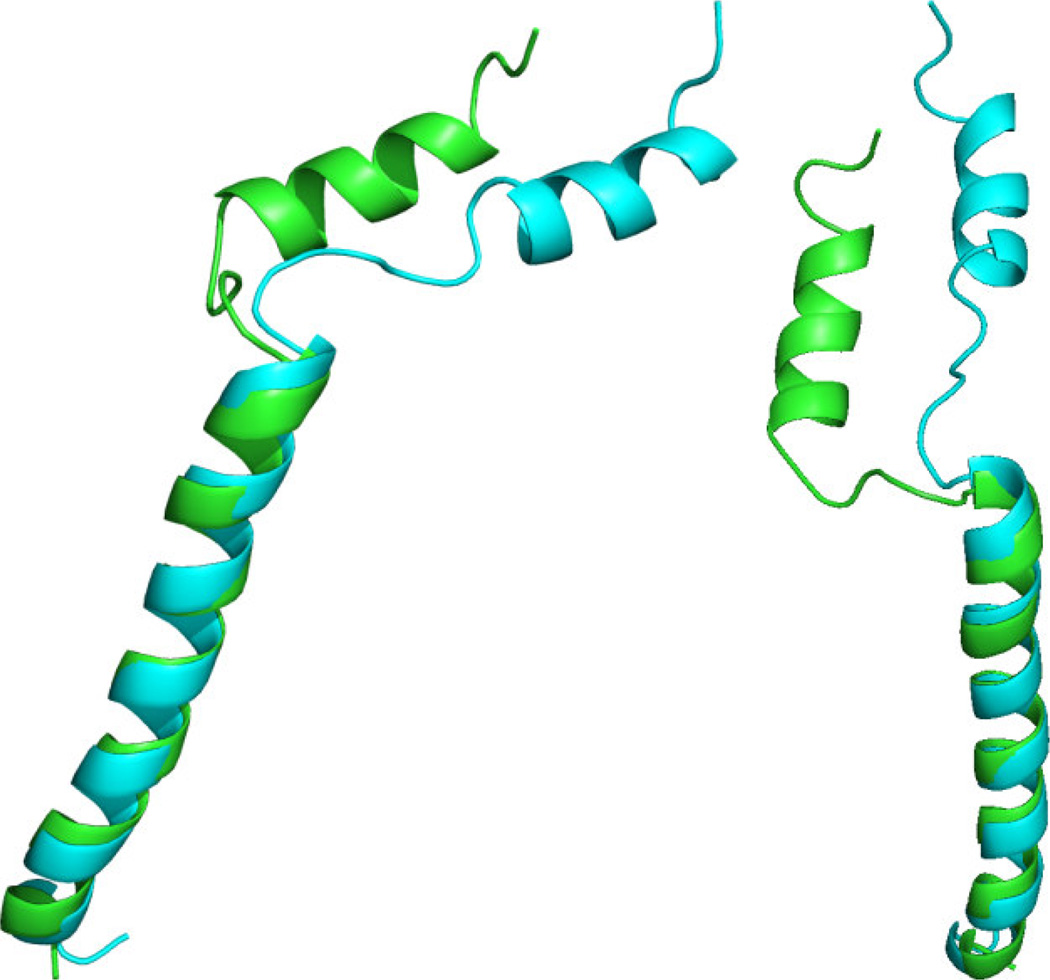
The REDCRAFT structure and the original structure from which the RDC data were generated are shown in Figure 4. These two structures exhibit less than 0.5Å of difference over the two helical regions (residues 1–13 and 20–45). The structure of the loop region is underdetermined due to an inadequate number of structural constraints, therefore several indistinguishable conformers of this region exist. Despite the lack of data for the loop region, the helices are oriented correctly. This same phenomenon was observed with the previously determined NMR structure ensemble (PDB: 2KLV); when the transmembrane helices from the NMR ensemble are superimposed, the amphipathic helices have the correct orientation but do not overlap. The back-calculated order parameters from the calculated structure are shown in Table 3. Note the degree of similarity between these order parameters and those used to simulate the data. These findings agree with theoretical expectations.
Figure 4.
Structure from REDCRAFT (green) determined under the assumption of molecular rigidity, as compared to that of the actual structure (blue), shown from two different perspectives. The two structures are aligned by the transmembrane helix and display near parallel alignment of amphipathic helices.
Table 3.
Order parameters from the final REDCRAFT static structure.
| Medium | Sxx | Syy | Szz | Da | R |
|---|---|---|---|---|---|
| M1 | 3.13E-04 | 5.51E-04 | −8.64E-04 | −10.52 | 0.18 |
| M2 | −4.12E-04 | −6.19E-04 | 1.03E-03 | 12.55 | 0.13 |
3.2. Simulated Data and Internal Dynamics
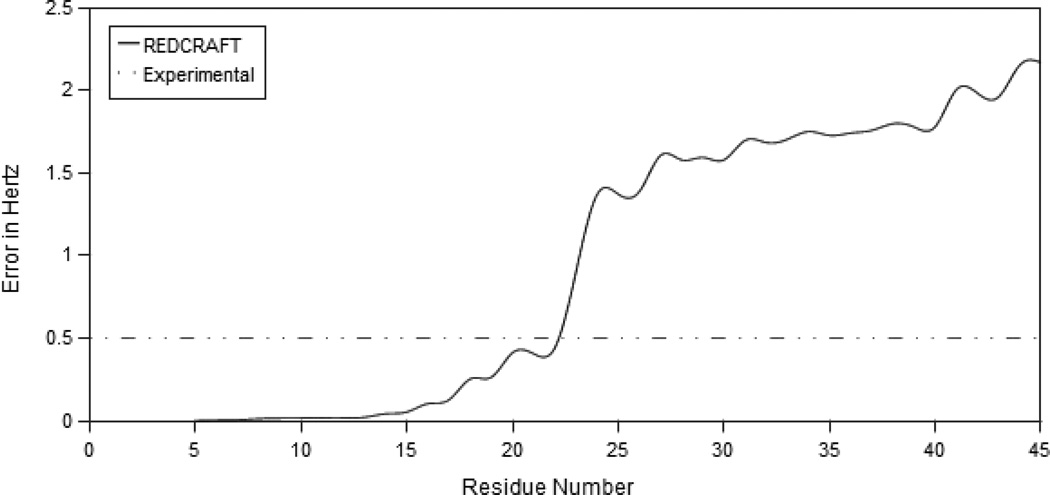
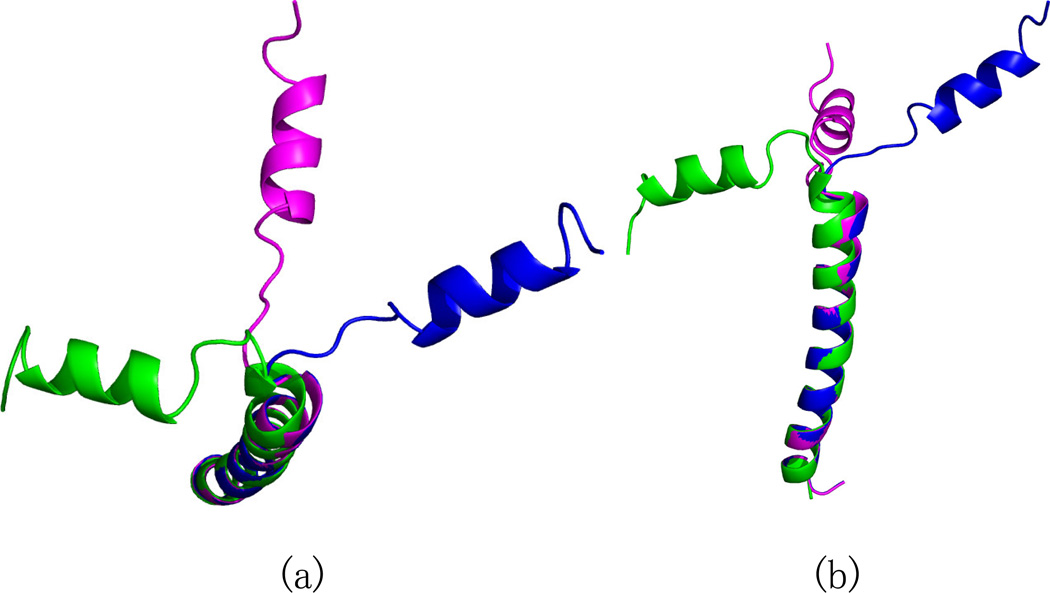
REDCRAFT was used to determine the structure of the protein with a two state motion (shown in Figure 1) using time-averaged RDC data and dihedral restraints with a search depth of 20,000. The dynamic profile of the REDCRAFT analysis is shown in Figure 5. Note the significant jump in the RDC fitness between residues 22 and 23. The resulting score is well above that of the experimental error, which indicates the presence of internal dynamics. This observed jump is due to the lack of a single order tensor that can consistently describe the alignment of the entire protein. The extensive search depth of 20,000 eliminates a shallow search depth as the origin of the observed increase in RDC fitness. The final structure that was produced by REDCRAFT is shown in green in Figure 6. The structures in blue and purple correspond to the conformations of the two-state dynamic structure. Ignoring the dynamics in the analysis produces severely misaligned secondary structural elements. Once the location of the internal dynamics in the sequence has been identified, the structure of each fragment can be obtained independently without introducing further discrepancies. The dynamic profile indicates that the two fragments consist of residues 1–13 and 21–45. Residues 14–18 were ignored due to lack of dihedral restraints. Individual study of each fragment by REDCRAFT produced dynamic profiles with no unexpected internal anomolies.
Figure 5.
Dynamic profile from REDCRAFT using simulated data for the structure with internal dynamics. Motion is simulated at residue 19 and precedes a sudden jump in the REDCRAFT score, where it exceeds the experimental error. For mobile domains no single consistent order tensor exists, so the error grows during the analysis of these regions.
Figure 6.
The REDCRAFT structure (in green) computed using data from a protein undergoing internal dynamics is compared to the structures used to simulate a two-state jump (blue and purple). The structures are shown from different viewpoints in (a) and (b). These structures were aligned using the transmembrane helix.
Three sets of calculated order tensors are shown in Table 4. The first set of order parameters are based on the full structure (residues 1–45). Determining the structure of the entire protein while disregarding dynamics can produce incorrect order parameters. The second and third entries in Table 4 correspond to the order parameters that are produced after fragmented analysis of the data. Note the degree of similarity between the order parameters obtained from the corresponding fragments in Table 4 and the order tensors used to generate the data (shown in Table 2).
Table 4.
Order parameters from different regions of mbPf1 under the assumption of motion with simulated data. Data is presented separately for the full protein and for the two rigid fragments that undergo motion with respect to one another. Residues from the mobile loop region are omitted for the fragment analysis.
| Fragment | Medium | Sxx | Syy | Szz | Da | R |
|---|---|---|---|---|---|---|
| Residue 1–45 | M1 | 5.27E-05 | 5.06E-04 | −5.59E-04 | −6.81 | 0.54 |
| M2 | −1.58E-04 | −4.97E-04 | 6.55E-04 | 7.98 | 0.35 | |
| Residue 1–13 | M1 | 5.95E-06 | 5.07E-04 | −5.13E-04 | −6.24 | 0.61 |
| M2 | 9.44E-05 | 4.99E-04 | −5.93E-04 | −7.22 | 0.45 | |
| Residue 23–45 | M1 | 3.51E-04 | 5.03E-04 | −8.54E-04 | −10.40 | 0.12 |
| M2 | −4.22E-04 | −7.28E-04 | 1.15E-03 | 14.00 | 0.18 |
3.3. Experimental Data
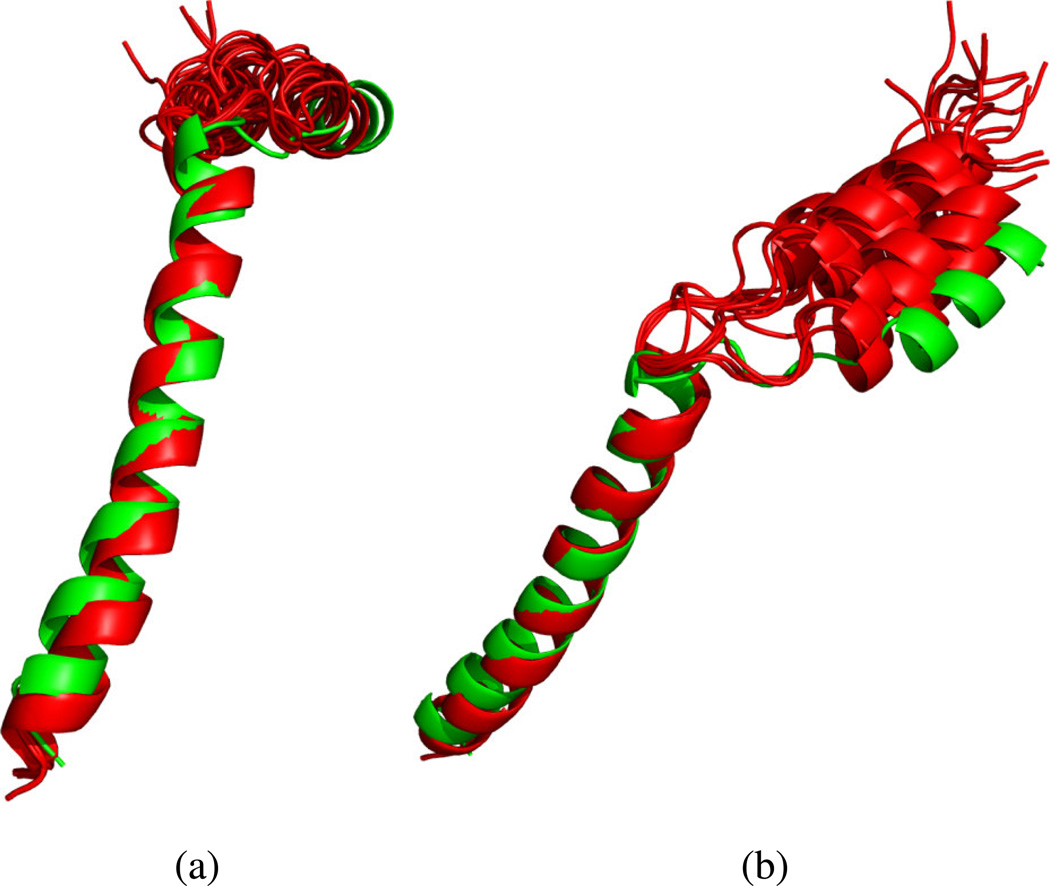
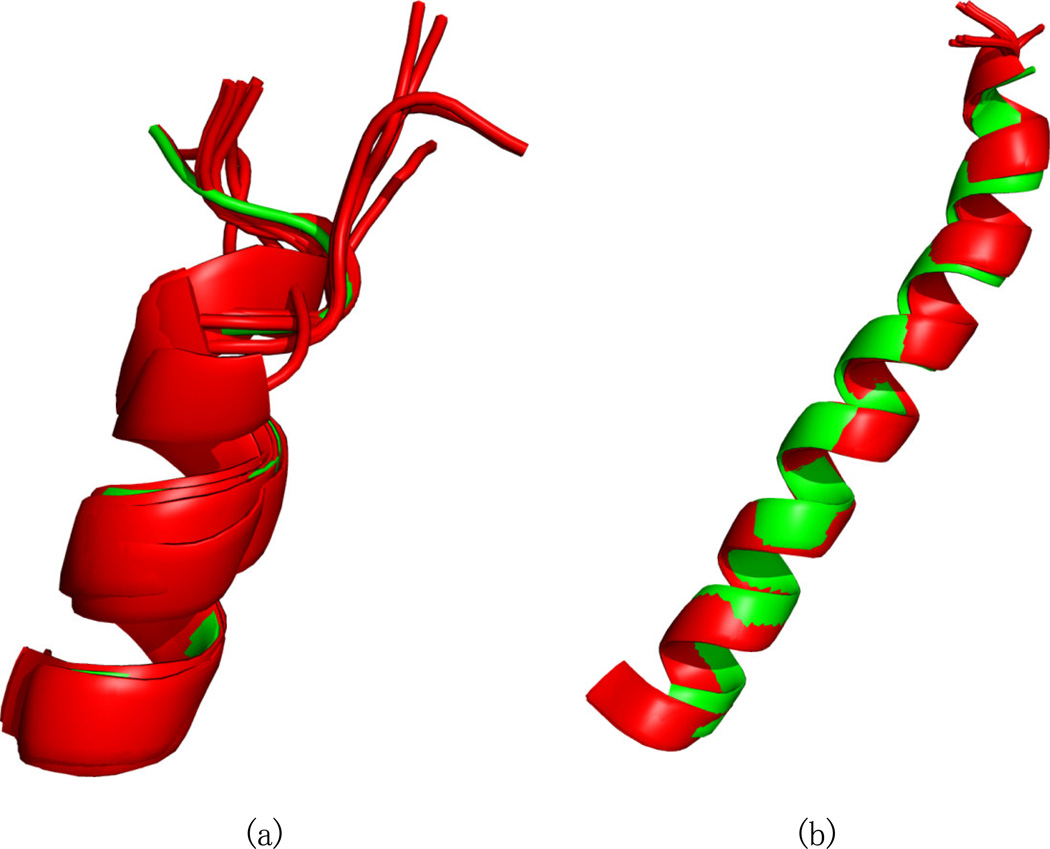
Previously reported [14; 50] experimental RDC data and dihedral restraints were analyzed using REDCRAFT. The first experimental data were analyzed under the assumption of structural rigidity by producing a structure that spans residues 4–45. The initial three residues were not included due to insufficient data. The final REDCRAFT structure is shown in Figure 7. The green structure in this Figure is the REDCRAFT result, and the ensemble of 15 red structures is the previously determined mbPf1 result. The ensemble was calculated with Xplor-NIH using the same data and restraints as in this exercise, along with the estimates of the two order tensors determined from unassigned RDCs by the 2D-RDC method [14; 54]. The REDCRAFT structure exhibited a backbone RMSD of 1.8–2.7Å (Figure 7(a)) with respect to the ensemble. This is within the 0.3Å – 2.7Å range observed between the ensemble structures. The main contributor to the structural variation is the loop region, which is poorly restrained. Superimposing the transmembrane region of this protein results in modest positional differences in the amphipathic region as shown in Figure 7(b). It is clear that although the structure of the loop region is poorly defined, enough information is present to restrain the orientation of the two helices with respect to each other.
Figure 7.
The structure of mbPf1 computed by REDCRAFT under the assumption of a static structure, using experimental data, is shown from different viewpoints in (a) and (b). The REDCRAFT structure (in green) is superimposed with the previously determined ensemble of NMR structures (in red).
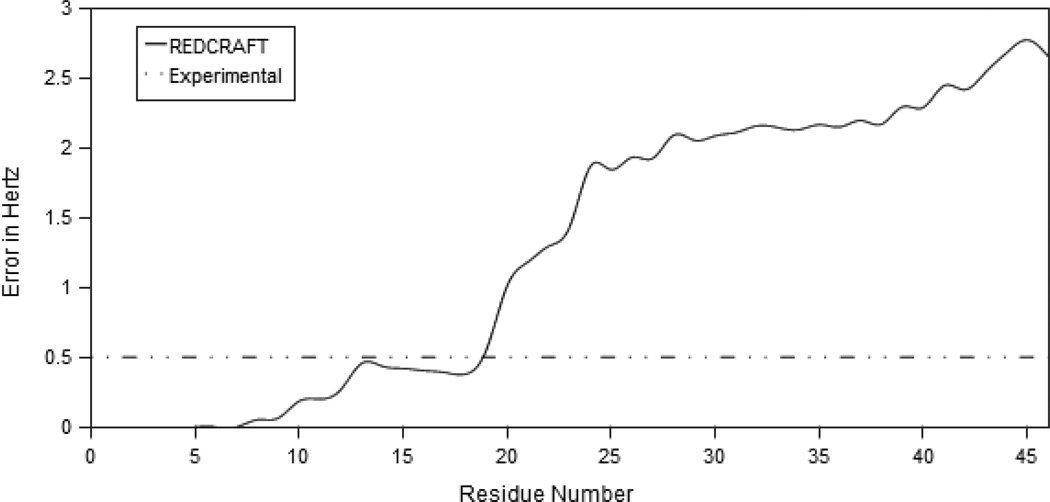
The dynamic profile from REDCRAFT is shown in Figure 8. This profile contains a clear indication of internal dynamics between the two helices. The RDC fitness demonstrates that the alignments of the two helices are described by two distinctly different order tensors. Individual study of each fragment by REDCRAFT produced dynamic profiles with final errors below the expected error. Three sets of order parameters were obtained in a manner similar to the previous section and are listed in Table 5.
Figure 8.
The dynamic profile of REDCRAFT in application to experimental data. The observed increase in error is consistent with that of simulated motion.
Table 5.
Principal order parameters reported by REDCRAFT from different regions of mbPf1 using experimental data. When treated separately, regions 4–13 and 20–45 clearly exhibit different order parameters.
| Residues | Medium | Sxx | Syy | Szz | Da | R |
|---|---|---|---|---|---|---|
| 4–45 | M1 | 1.42E-04 | 7.25E-04 | −8.67E-04 | −10.56 | 0.45 |
| M2 | −2.12E-04 | −2.77E-04 | 4.89E-04 | 5.95 | 0.09 | |
| 4–13 | M1 | 1.35E-04 | 4.85E-04 | −6.20E-04 | −7.55 | 0.38 |
| M2 | −1.35E-04 | −2.80E-04 | 4.15E-04 | 5.05 | 0.23 | |
| 20–45 | M1 | 2.70E-04 | 7.02E-04 | −9.72E-04 | −11.83 | 0.30 |
| M2 | 3.45E-04 | 9.03E-04 | −1.25E-03 | −15.22 | 0.30 |
Based on the observed dynamic profile in Figure 8, we conclude that there are two distinct rigid fragments in mbPf1, corresponding to residues 4–13 and 20–45. The structure of each domain was determined separately using REDCRAFT. The first fragment, shown in Figure 9(a), has an excellent fit to the ensemble of previously reported structures, with a backbone RMSD of 0.33Å – 0.98Å with the ensemble compared to 0.05 Å – 1.45Å among the ensemble. The second fragment, shown in Figure 9(b), also exhibits a reasonable fit to the ensemble, with an RMSD of 0.73Å – 0.94Å to the ensemble compared to 0.05Å – 0.84Å among the ensemble. It is important to note that helical structures with the backbone dihedral restraints utilized here can exhibit as much as 1.8Å of deviation measured over the backbone atoms. Given the lack of dihedral constraints and experimental data from the residues in the loop region, it is not possible to determine a unique structure for the portion of the protein between the two helices.
Figure 9.
Structure of fragments 4–13 and 20–45 determined individually using experimental data are shown in (a) and (b) respectively. The REDCRAFT structure is shown in green, with the previously reported NMR structures in red.
4. Discussion
It is feasible to determine the structure of a membrane protein with sparse experimental data. The procedure described here is both reliable and complete. Assuming ideal geometries, a 46-residue protein can be described with 45 sets of backbone dihedral angles (ϕ, φthe first and last torsion angles are inconsequential to the position of the backbone atoms). This presents a problem with 90 degrees of freedom. REDCRAFT’s approach to structure determination allows the order tensors for the two alignment media to freely float without any a priori assumptions regarding their orientation or order parameters. This introduces ten additional degrees of freedom, five for each order tensor. Thus, our formulation of the problem can be summarized with 100 degrees of freedom, but there are only 90 experimental data. This is clearly an underdetermined problem, and with no other constraints, there are a number of random-coil structures that consistently satisfy the RDC data. However, based on our observations, the dihedral restraints have reduced the effective degrees of freedom sufficiently to enable a meaningful structure determination. Furthermore, both REDCRAFT and Xplor-NIH produce structures with finite RDC fitness scores close to the experimental error. This provides additional evidence that the problem structure may not be underdetermined, since that would produce an RDC fitness score of zero. An additional factor is the geometrical relationship between the N-Cα and Cα-C′ bonds. If these two bonds were perpendicular to one another, a given set of torsion angles would have the maximum number of degrees of independence. However, the tetrahedral Cα carbon imposes a bond angle of 109.5°, which renders two adjacent degrees of freedom somewhat dependent. This has been widely used in the calculation of protein structures determined by oriented sample (OS) solid-state NMR [57–59]. Finally, it is important to note that the dihedral restraints originally obtained from TALOS resulted from experimental data that are not directly acknowledged in this context. Based on this, the effective number of data points exceeds the total degrees of freedom of the problem.
Figure 8 provides clear evidence to support the existence of internal dynamics in the residues between the transmembrane and the amphipathic helices. Although this feature of REDCRAFT has previously been demonstrated with other proteins and is theoretically sound, it could have been possible for membrane proteins, like the example mbPf1 coat protein, to yield an anomalous dynamic-profile. The observed anomalies could be due to the none-globular nature of this protein, which has a small number of secondary structural elements, and orthogonal α-helices. These new anomalies could have potentially produced dynamic-profiles that falsely indicate internal motion. We investigated mbPf1 with synthetic data to eliminate this as a possibility. If the observed anomaly in the dynamic-profile is due to a global or local structural feature and not internal dynamics, then the same phenomenon should have been observed with synthetic data from a static structure. Furthermore, the dynamic-profile observed with synthetic data from a dynamic structure is remarkably similar to the profile observed with the experimental data. Finally, a potential source of the observed jump in the dynamic profile could be overly restrained dihedral angles. Although not shown here, our studies included expanded dihedral restraints for the helical regions by as much as ±20° beyond the original restraints. These restraints lead to a nearly identical dynamic profile, with a maximum RDC fitness of 2.4Hz, versus 2.7Hz in the original analysis.
Additional evidence supports the existence of internal dynamics in mbPf1. The experimental heteronuclear 1H-15 N NOEs for the backbone amide sites of Pf1 coat protein in SDS micelles have shown that the residues in the terminal regions as well as in the loop connecting the helices are more mobile than the other residues [55]. Recent NMR data also provide additional support for the existence of internal dynamics. The backbone amide signal intensity profile in the HSQC spectra was analyzed for the mbPf1 in isotropic bicelles by altering the q parameter, which indicates the molar ratio of long-chain to short-chain phospholipids. In micelles, with q=0, resonances from both helices are readily observed. Increasing q leads to decreasing intensities from resonances in the transmembrane helix; these resonances are no longer observed at q=1 [50]. These experimental observations further strengthen our finding of motion in the amphipathic helix.
Many structure determination methods assume a static structure for the entire protein. However, the impact of this assumption on the final structure when using data collected from a dynamic structure can be extensive. Here we have presented one example of this effect based on synthetic data. Figure 6 illustrates the simulated two state jump motion of the amphipathic portion of mbPf1. Computing a structure using simulated data and insisting on the assumption of molecular rigidity has yielded the blue structure shown in Figure 6. It is important to note that the orientation of the mobile region is strongly affected by internal motion; the amphipathic helix lies well outside the region spanned by the helices in the two states that were used to generate the synthetic data. There is no possibility of an inverted orientation due to our use of RDC data from two independent alignment media [56]. Although the effect of internal dynamics is normally discussed in terms of altered order parameters, a perturbation of the orientational component of the anisotropy is often accompanied by a change in the order parameters. Therefore, by taking internal dynamics into account in the calculations, it is possible to obtain a more accurate structure determination of a membrane protein.
Supplementary Material
Acknowledgments
This work was supported by grant number R01GM081793 from National Institutes of Health to Dr. Homayoun Valafar and NIH grants to Dr. Stanley Opella. It utilized the Biomedical Technology Resource for NMR Molecular Imaging of Proteins at the University of California, San Diego, which is supported by grant P41EB002031.
Footnotes
Publisher's Disclaimer: This is a PDF file of an unedited manuscript that has been accepted for publication. As a service to our customers we are providing this early version of the manuscript. The manuscript will undergo copyediting, typesetting, and review of the resulting proof before it is published in its final citable form. Please note that during the production process errorsmaybe discovered which could affect the content, and all legal disclaimers that apply to the journal pertain.
References
- 1.Bouvignies G, Bernadó P, Meier S, Cho K, Grzesiek S, Brüschweiler R, Blackledge M. Identification of slow correlated motions in proteins using residual dipolar and hydrogen-bond scalar couplings. Proc Natl Acad Sci U S A. 2005;102:13885–13890. doi: 10.1073/pnas.0505129102. [DOI] [PMC free article] [PubMed] [Google Scholar]
- 2.Clore GM, Schwieters CD. Amplitudes of protein backbone dynamics and correlated motions in a small alpha/beta protein: correspondence of dipolar coupling and heteronuclear relaxation measurements. Biochemistry. 2004;43:10678–10691. doi: 10.1021/bi049357w. [DOI] [PubMed] [Google Scholar]
- 3.Tolman JR, Flanagan JM, Kennedy MA, Prestegard JH. NMR evidence for slow collective motions in cyanometmyoglobin. Nat Struct Biol. 1997;4:292–297. doi: 10.1038/nsb0497-292. [DOI] [PubMed] [Google Scholar]
- 4.Bryson M, Tian F, Prestegard JH, Valafar H. REDCRAFT: a tool for simultaneous characterization of protein backbone structure and motion from RDC data. J Magn Reson. 2008;191:322–334. doi: 10.1016/j.jmr.2008.01.007. [DOI] [PMC free article] [PubMed] [Google Scholar]
- 5.Valafar H, Prestegard J. REDCAT: a residual dipolar coupling analysis tool. J Magn Reson. 2004;167:228–241. doi: 10.1016/j.jmr.2003.12.012. [DOI] [PubMed] [Google Scholar]
- 6.Schwieters CD, Kuszewski JJ, Tjandra N, Clore GM. The Xplor-NIH NMR molecular structure determination package. J Magn Reson. 2003;160:65–73. doi: 10.1016/s1090-7807(02)00014-9. [DOI] [PubMed] [Google Scholar]
- 7.Andrec M, Du PC, Levy RM. Protein backbone structure determination using only residual dipolar couplings from one ordering medium. J Biomol NMR. 2001;21:335–347. doi: 10.1023/a:1013334513610. [DOI] [PubMed] [Google Scholar]
- 8.Assfalg M, Bertini I, Turano P, Mauk AG, Winkler JR, Gray H. N-15-H-1 residual dipolar coupling analysis of native and alkaline-K79A Saccharomyces cerevisiae cytochrome c. Biophys J. 2003;84:3917–3923. doi: 10.1016/S0006-3495(03)75119-4. [DOI] [PMC free article] [PubMed] [Google Scholar]
- 9.Bertini I, Luchinat C, Turano P, Battaini G, Casella L. The magnetic properties of myoglobin as studied by NMR spectroscopy. Chemistry-a European Journal. 2003;9:2316–2322. doi: 10.1002/chem.200204562. [DOI] [PubMed] [Google Scholar]
- 10.Clore GM, Bewley CA. Using conjoined rigid body/torsion angle simulated annealing to determine the relative orientation of covalently linked protein domains from dipolar couplings. J Magn Reson. 2002;154:329–335. doi: 10.1006/jmre.2001.2489. [DOI] [PubMed] [Google Scholar]
- 11.Cornilescu G, Delaglio F, Bax A. Protein backbone angle restraints from searching a database for chemical shift and sequence homology. J Biomol NMR. 1999;13:289–302. doi: 10.1023/a:1008392405740. [DOI] [PubMed] [Google Scholar]
- 12.Fowler CA, Tian F, Al-Hashimi HM, Prestegard J. Rapid determination of protein folds using residual dipolar couplings. J Mol Biol. 2000;304:447–460. doi: 10.1006/jmbi.2000.4199. [DOI] [PubMed] [Google Scholar]
- 13.Tian F, Valafar H, Prestegard JH. A dipolar coupling based strategy for simultaneous resonance assignment and structure determination of protein backbones. J Am Chem Soc. 2001;123:11791–11796. doi: 10.1021/ja011806h. [DOI] [PubMed] [Google Scholar]
- 14.Mukhopadhyay R, Miao X, Shealy P, Valafar H. Efficient and accurate estimation of relative order tensors from lambda-maps. J Magn Reson. 2009;198:236–247. doi: 10.1016/j.jmr.2009.02.014. [DOI] [PMC free article] [PubMed] [Google Scholar]
- 15.Opella SJ, Marassi FM. Structure determination of membrane proteins by NMR spectroscopy. Chem Rev. 2004;104:3587–3606. doi: 10.1021/cr0304121. [DOI] [PMC free article] [PubMed] [Google Scholar]
- 16.Al-Hashimi HM, Bolon PJ, Prestegard JH. Molecular symmetry as an aid to geometry determination in ligand protein complexes. J Magn Reson. 2000;142:153–158. doi: 10.1006/jmre.1999.1937. [DOI] [PubMed] [Google Scholar]
- 17.Al-Hashimi HM, Gorin A, Majumdar A, Gosser Y, Patel DJ. Towards structural Genomics of RNA: Rapid NMR resonance assignment and simultaneous RNA tertiary structure determination using residual dipolar couplings. J Mol Biol. 2002;318:637–649. doi: 10.1016/S0022-2836(02)00160-2. [DOI] [PubMed] [Google Scholar]
- 18.Al-Hashimi HM, Gosser Y, Gorin A, Hu WD, Majumdar A, Patel DJ. Concerted motions in HIV-1 TAR RNA may allow access to bound state conformations: RNA dynamics from NMR residual dipolar couplings. J Mol Biol. 2002;315:95–102. doi: 10.1006/jmbi.2001.5235. [DOI] [PubMed] [Google Scholar]
- 19.Tjandra N, Tate S, Ono A, Kainosho M, Bax A. The NMR structure of a DNA dodecamer in an aqueous dilute liquid crystalline phase. J Am Chem Soc. 2000;122:6190–6200. [Google Scholar]
- 20.Vermeulen A, Zhou HJ, Pardi A. Determining DNA global structure and DNA bending by application of NMR residual dipolar couplings. J Am Chem Soc. 2000;122:9638–9647. [Google Scholar]
- 21.Adeyeye J, Azurmendi HF, Stroop CJM, Sozhamannan S, Williams AL, Adetumbi AM, Johnson JA, Bush CA. Conformation of the hexasaccharide repeating subunit from the Vibrio cholerae O139 capsular polysaccharide. Biochemistry. 2003;42:3979–3988. doi: 10.1021/bi026700t. [DOI] [PubMed] [Google Scholar]
- 22.Azurmendi HF, Bush CA. Conformational studies of blood group A and blood group B oligosaccharides using NMR residual dipolar couplings. Carbohydr Res. 2002;337:905–915. doi: 10.1016/s0008-6215(02)00070-8. [DOI] [PubMed] [Google Scholar]
- 23.Azurmendi HF, Martin-Pastor M, Bush CA. Conformational studies of Lewis X and Lewis A trisaccharides using NMR residual dipolar couplings. Biopolymers. 2002;63:89–98. doi: 10.1002/bip.10015. [DOI] [PubMed] [Google Scholar]
- 24.Tian F, Al-Hashimi HM, Craighead JL, Prestegard JH. Conformational analysis of a flexible oligosaccharide using residual dipolar couplings. J Am Chem Soc. 2001;123:485–492. doi: 10.1021/ja002900l. [DOI] [PubMed] [Google Scholar]
- 25.Meiler J, Prompers JJ, Peti W, Griesinger C, Bruschweiler R. Model-free approach to the dynamic interpretation of residual dipolar couplings in globular proteins. J Am Chem Soc. 2001;123:6098–6107. doi: 10.1021/ja010002z. [DOI] [PubMed] [Google Scholar]
- 26.Peti W, Meiler J, Bruschweiler R, Griesinger C. Model-free analysis of protein backbone motion from residual dipolar couplings. J Am Chem Soc. 2002;124:5822–5833. doi: 10.1021/ja011883c. [DOI] [PubMed] [Google Scholar]
- 27.Saupe A, Englert G. High-Resolution Nuclear Magnetic Resonance Spectra of Orientated Molecules. Phys Rev Lett. 1963;11:462–464. [Google Scholar]
- 28.Prestegard JH, al-Hashimi HM, Tolman JR. NMR structures of biomolecules using field oriented media and residual dipolar couplings. Q Rev Biophys. 2000;33:371–424. doi: 10.1017/s0033583500003656. [DOI] [PubMed] [Google Scholar]
- 29.Tjandra N, Grzesiek S, Bax A. Magnetic field dependence of nitrogen-proton J splittings in N-15-enriched human ubiquitin resulting from relaxation interference and residual dipolar coupling. J Am Chem Soc. 1996;118:6264–6272. [Google Scholar]
- 30.Tolman JR, Flanagan JM, Kennedy MA, Prestegard J. Nuclear Magnetic Dipole Interactions in Field-Oriented Proteins - Information for Structure Determination in Solution. Proc Natl Acad Sci U S A. 1995;92:9279–9283. doi: 10.1073/pnas.92.20.9279. [DOI] [PMC free article] [PubMed] [Google Scholar]
- 31.Greshenfeld NA. The Nature of Mathematical Modeling. Cambridge: University Press; 1998. [Google Scholar]
- 32.Press W, Saul ATeukolsky, William TVetterling, Brian PFlannery. Numerical Recipes in C, The Art of Scientific Computing. 2002 [Google Scholar]
- 33.Losonczi JA, Andrec M, Fischer MWF, Prestegard JH. Order matrix analysis of residual dipolar couplings using singular value decomposition. J Magn Reson. 1999;138:334–342. doi: 10.1006/jmre.1999.1754. [DOI] [PubMed] [Google Scholar]
- 34.Tolman J, Al-Hashimi H. NMR studies of biomolecular dynamics and structural plasticity using residual dipolar couplings. ANNUAL REPORTS OF NMR SPECTROSCOPY. 2003;51:106–167. [Google Scholar]
- 35.Tolman JR, Al-Hashimi HM, Kay LE, Prestegard JH. Structural and dynamic analysis of residual dipolar coupling data for proteins. J Am Chem Soc. 2001;123:1416–1424. doi: 10.1021/ja002500y. [DOI] [PubMed] [Google Scholar]
- 36.Tolman JR. Dipolar couplings as a probe of molecular dynamics and structure in solution. Curr Opin Struct Biol. 2001;11:532–539. doi: 10.1016/s0959-440x(00)00245-1. [DOI] [PubMed] [Google Scholar]
- 37.Tolman JR. A novel approach to the retrieval of structural and dynamic information from residual dipolar couplings using several oriented media in biomolecular NMR spectroscopy. J Am Chem Soc. 2002;124:12020–12030. doi: 10.1021/ja0261123. [DOI] [PubMed] [Google Scholar]
- 38.Prestegard JH, Mayer KL, Valafar H, Benison GC. Determination of protein backbone structures from residual dipolar couplings. Methods Enzymol. 2005;394:175–209. doi: 10.1016/S0076-6879(05)94007-X. [DOI] [PMC free article] [PubMed] [Google Scholar]
- 39.Valafar H, Mayer K, Bougault C, LeBlond P, Jenney F, Brereton P, Adams M, Prestegard J. Backbone solution structures of proteins using residual dipolar couplings: application to a novel structural genomics target. J Struct Funct Genomics. 2005;5:241–254. doi: 10.1007/s10969-005-4899-5. [DOI] [PMC free article] [PubMed] [Google Scholar]
- 40.Roy S, Redfield AG. Nuclear Overhauser Effect Study And Assignment Of D-Stem And Reverse-Hoogsteen Base Pair Proton Resonances In Yeast Transfer Rna-Asp. 1981;9:7073–7083. doi: 10.1093/nar/9.24.7073. [DOI] [PMC free article] [PubMed] [Google Scholar]
- 41.Delaglio F, Kontaxis G, Bax A. Protein structure determination using molecular fragment replacement and NMR dipolar couplings. J Am Chem Soc. 2000;122:2142–2143. [Google Scholar]
- 42.Hus JC, Marion D, Blackledge M. Determination of protein backbone structure using only residual dipolar couplings. J Am Chem Soc. 2001;123:1541–1542. doi: 10.1021/ja005590f. [DOI] [PubMed] [Google Scholar]
- 43.Jung Y, Sharma M, Zweckstetter M. Simultaneous assignment and structure determination of protein backbones by using NMR dipolar couplings. Angew Chem Int Ed Engl. 2004;43:3479–3481. doi: 10.1002/anie.200353588. [DOI] [PubMed] [Google Scholar]
- 44.Lindorff-Larsen K, Best RB, Depristo MA, Dobson CM, Vendruscolo M. Simultaneous determination of protein structure and dynamics. Nature. 2005;433:128–132. doi: 10.1038/nature03199. [DOI] [PubMed] [Google Scholar]
- 45.Wang LC, Donald BR. Exact solutions for internuclear vectors and backbone dihedral angles from NH residual dipolar couplings in two media, and their application in a systematic search algorithm for determining protein backbone structure. J Biomol NMR. 2004;29:223–242. doi: 10.1023/B:JNMR.0000032552.69386.ea. [DOI] [PubMed] [Google Scholar]
- 46.Brunger A, Adams P, Clore G, DeLano W, Gros P, Grosse-Kunstleve R, Jiang J, Kuszewski J, Nilges M, Pannu N, Read R, Rice L, Simonson T, Warren G. Crystallography & NMR system: A new software suite for macromolecular. Acta Crystallogr D Biol Crystallogr. 1998;54:905–921. doi: 10.1107/s0907444998003254. [DOI] [PubMed] [Google Scholar]
- 47.Güntert P. Automated NMR structure calculation with CYANA. Methods Mol Biol. 2004;278:353–378. doi: 10.1385/1-59259-809-9:353. [DOI] [PubMed] [Google Scholar]
- 48.Park SH, Son WS, Mukhopadhyay R, Valafar H, Opella SJ. Phage-induced alignment of membrane proteins enables the measurement and structural analysis of residual dipolar couplings with dipolar waves and lambda-maps. J Am Chem Soc. 2009;131:14140–14141. doi: 10.1021/ja905640d. [DOI] [PMC free article] [PubMed] [Google Scholar]
- 49.Koradi R, Billeter M, Wuthrich K. MOLMOL: A program for display and analysis of macromolecular structures. J Mol Graphics. 1996;14:51–55. doi: 10.1016/0263-7855(96)00009-4. [DOI] [PubMed] [Google Scholar]
- 50.Park S, Marass IF, Black D, Opella S. Structure and Dynamics of the Membrane-bound form of Pf1 Coat Protein: Implications for Structural Rearrangement During Virus Assembly. Biophys J. 2010 doi: 10.1016/j.bpj.2010.06.009. [DOI] [PMC free article] [PubMed] [Google Scholar]
- 51.Delaglio F, Grzesiek S, Vuister GW, Zhu G, Pfeifer J, Bax A. NMRPipe: a multidimensional spectral processing system based on UNIX pipes. J Biomol NMR. 1995;6:277–293. doi: 10.1007/BF00197809. [DOI] [PubMed] [Google Scholar]
- 52.Mesleh MF, Veglia G, DeSilva TM, Marassi FM, Opella SJ. Dipolar waves as NMR maps of protein structure. J Am Chem Soc. 2002;124:4206–4207. doi: 10.1021/ja0178665. [DOI] [PMC free article] [PubMed] [Google Scholar]
- 53.Mesleh MF, Lee S, Veglia G, Thiriot DS, Marassi FM, Opella SJ. Dipolar Waves Map the Structure and Topology of Helices in Membrane Proteins. J Am Chem Soc. 2003;125:8928–8935. doi: 10.1021/ja034211q. [DOI] [PMC free article] [PubMed] [Google Scholar]
- 54.Miao X, Mukhopadhyay R, Valafar H. Estimation of relative order tensors, and reconstruction of vectors in space using unassigned RDC data and its application. J Magn Reson. 2008;194:202–211. doi: 10.1016/j.jmr.2008.07.005. [DOI] [PMC free article] [PubMed] [Google Scholar]
- 55.Lee S, Mesleh MF, Opella SJ. Structure and dynamics of a membrane protein in micelles from three solution NMR experiments. J Biomol NMR. 2003;26:327–334. doi: 10.1023/a:1024047805043. [DOI] [PubMed] [Google Scholar]
- 56.Al-Hashimi HM, Valafar H, Terrell M, Zartler ER, Eidsness MK, Prestegard JH. Variation of molecular alignment as a means of resolving orientational ambiguities in protein structures from dipolar couplings. J Magn Reson. 2000;143:402–406. doi: 10.1006/jmre.2000.2049. [DOI] [PubMed] [Google Scholar]
- 57.Cross TA, Opella SJ. Protein structure by solid-state nuclear magnetic resonance: Residues 40 to 45 of bacteriophage fd coat protein. J. Mol. Biol. 1985;182:367–381. doi: 10.1016/0022-2836(85)90197-4. [DOI] [PubMed] [Google Scholar]
- 58.Quine JR, Brenneman MT, Cross TA. Protein structural analysis from solid-state NMRderived orientational constraints. Biophys. J. 1997;72:2342–2348. doi: 10.1016/S0006-3495(97)78878-7. [DOI] [PMC free article] [PubMed] [Google Scholar]
- 59.Nevzorov AA, Mesleh MF, Cross TA. Structure determination of aligned samples of membrane proteins by NMR spectroscopy. Magn. Reson. Chem. 2004;42:162–171. doi: 10.1002/mrc.1320. [DOI] [PubMed] [Google Scholar]
Associated Data
This section collects any data citations, data availability statements, or supplementary materials included in this article.


