In most eukaryotic cells, microtubules undergo post-translational modifications such as acetylation of α-tubulin on lysine 40 (K40), a widespread modification restricted to a subset of microtubules that turns over slowly 1. This subset of stable microtubules accumulates in cell protrusions 2 and regulates cell polarization 3, migration and invasion 4-7. However, mechanisms restricting acetylation to these microtubules are unknown. Here, we report that clathrin-coated pits (CCPs) control microtubule acetylation through a direct interaction of the α-tubulin acetyltransferase αTAT1 8,9 with the clathrin adaptor AP-2. We observed that about one-third of growing microtubule (+) ends contacted and paused at CCPs and that loss of CCPs decreased K40 acetylation levels. We showed that αTAT1 localised to CCPs through a direct interaction with AP-2 that is required for microtubule acetylation. In migrating cells, the polarized orientation of acetylated microtubules correlated with CCP accumulation at the leading edge 10, and interaction of αTAT1 with AP-2 was required for directional migration. We conclude that microtubules contacting CCPs become acetylated by αTAT1. In migrating cells, this mechanism ensures the acetylation of microtubules oriented towards the leading edge, thus promoting directional cell locomotion and chemotaxis.
Clathrin-mediated endocytosis is a fundamental process that regulates a wide variety of cell functions including signalling, migration and cell division. In migrating cells, CCPs are asymmetrically distributed 10 and endocytic carriers are enriched at the leading edge probably providing a mechanism for rapid turn-over of membrane components required for lamellipodia and adhesion site dynamics 11,12. In addition, close contacts between CCPs and microtubules have been reported 13, although the functional consequences of these interactions remained elusive. We set out here to investigate the interaction between CCPs and the stable subset of microtubules that are oriented in the direction of protrusion.
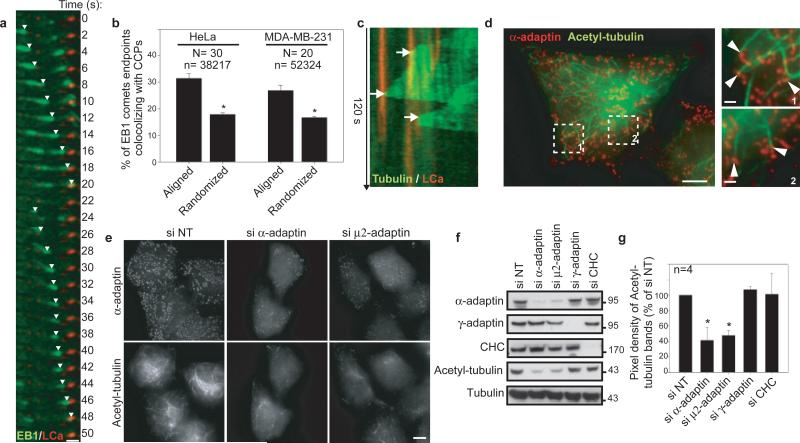
We observed by total internal reflection fluorescence microscopy (TIRF-M) that a large proportion of GFP-EB1-labelled microtubules (+)-ends disappeared upon contact with CCP labelled with mRFP-tagged clathrin light chain (mRFP-LCa) (Fig. 1a). Automated tracking and statistical colocalisation analysis revealed that 31% of disappearances occurred when an EB1-positive comet contacted a CCP in HeLa cells (Fig. 1b), whereas remaining comets disappeared in CCP-free regions. This percentage was significantly higher than prediction given by random superposition of disappearing EB1 events and CCPs (Fig. 1b and see Methods). Approximately 28% of growing GFP-α-tubulin-labelled microtubule ends that passed over a CCP paused at this structure in MDA-MB-231 cells (Fig. 1c), similar to the 27% of EB1 comets that stopped at CCPs in these cells (Fig. 1b); the pause time was highly variable with an average of 16.8 ± 15.1 s (mean ± s.e.m). When CCPs were disrupted by silencing the α-adaptin subunit of AP-2, EB1 comets travelled significantly longer distances: ~2.6 μm compare to ~2 μm in control cells (Extended Data Fig. 1). Collectively, these data suggest that microtubules can pause and anchor transiently at CCPs.
Figure 1. Microtubules pause at CCPs and are acetylated in an AP-2-dependent manner.
a, b, GFP-EB1 comets stopping at CCPs (a, TIRF-M, HeLa cells) and quantification (b, see Method section; number of cells (N) and EB1 comets (n)). c, GFP-tubulin-positive microtubule contacting CCP. d, e, Control (d) or siRNAs-treated (e) HeLa cells stained for α-adaptin and K40 acetyl-tubulin. f, g, Proteins expression in HeLa cells treated with indicated siRNAs (molecular weights in kDa). Quantification in percentage ± s.e.m of siNT, * P<0.001. Scale bars, 10 μm or 2 μm in insets.
Extended Data Figure 1. Effects of AP-2 knockdown on EB1 comets run length.
a, HeLa cells treated with non-targeting (NT) or α-adaptin-specific siRNAs and overexpressing GFP-EB1 were imaged by TIRF-M at 1 frame/s. Maximal projection of 15 consecutive frames is represented. Scale bars, 10 μm. b, Average run length in μm of EB1 comets from HeLa cells treated with non-targeting (NT) or α-adaptin-specific siRNAs (at least 20000 comets were analysed per conditions from 10 different cells from two independent experiments using ICY software, * P<0.001).
Anchoring events at the cell periphery play a role in the generation of stable microtubules 14. We found that 17 ± 0.7 % (mean ± s.e.m) of the visible acetylated microtubule extremities were in contact with CCPs at the cell periphery (Fig. 1d). Strikingly, the amount of K40-acetylated tubulin was dramatically reduced when CCPs were disrupted, although there was no global change in microtubule network organisation nor on levels of other microtubule modifications (Fig. 1e-g and Extended Data Fig. 2a and 3). In addition, depletion of AP-1 subunit γ-adaptin did not affect K40 acetylation (Fig. 1f-g and Extended Data Fig. 2b). Silencing of clathrin heavy chain (CHC), which did not modify AP-2 localisation at the plasma membrane (15 and Extended Data Fig.2), did not affect K40 acetylation levels (Fig. 1fg and Extended Data Fig. 2b) suggesting that AP-2's role in microtubule acetylation is independent of endocytosis. Thus, we conclude that there is a positive correlation between CCP density and K40 acetylation levels. Along this line, loss of dynamin function was reported to increase the density of CCPs at the plasma membrane and to enhance tubulin acetylation 16,17.
Extended Data Figure 2. AP-2 knockdown inhibits microtubule acetylation but does not affect overall microtubule organization.
a, b, HeLa cells treated with the indicated siRNAs were stained for α-adaptin and total α-tubulin (a) or K40 acetyl-tubulin (b). Scale bars, 10 μm.
Extended Data Figure 3. Effects of AP-2 knockdown on microtubule post-translational modifications in MDA-MB-231 cells.
a, MDA-MB-231 cells treated with non-targeting siRNAs (NT) or with α-adaptin or μ2-adaptin specific siRNAs were stained for α-adaptin and K40 acetyl-tubulin. Scale bar, 10 μm. b, MDA-MB-231 cells were treated with the indicated siRNA and the cell lysates were analysed by western blotting with using the indicated antibodies. c, Quantification of the pixel density of bands detected by the anti-K40 acetyl antibody in (b) expressed in percentage of siNT ± s.e.m (normalized to total tubulin levels, * P<0.001 compared to siNT).
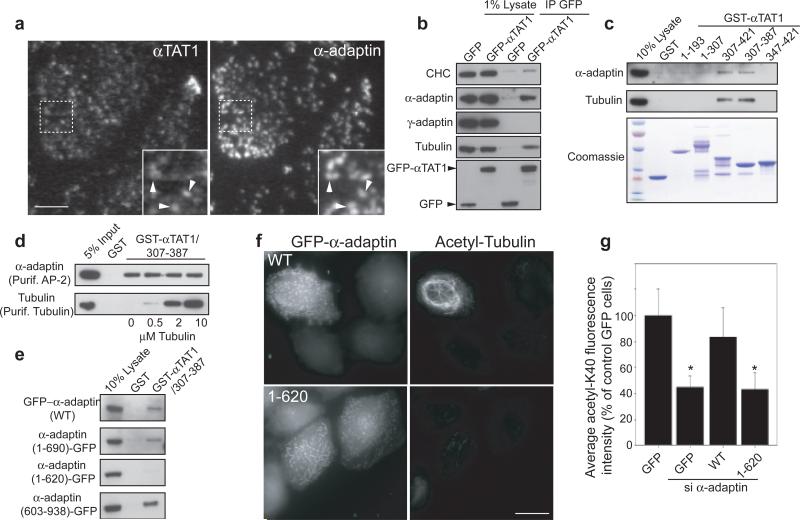
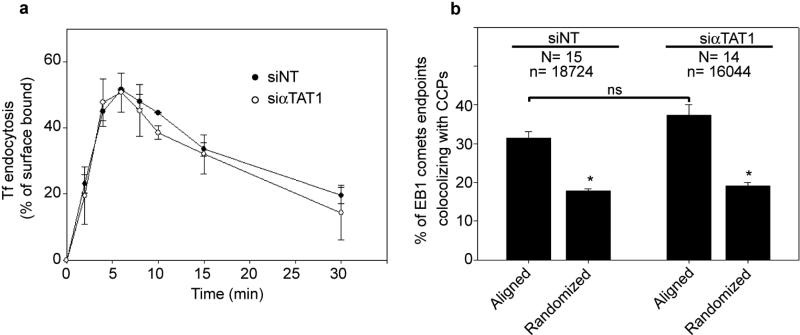
By TIRF-M, we observed that GFP-αTAT1 accumulated into CCPs in a microtubule-independent manner and ~35% of CCPs (302 of 853 CCPs analysed from 7 different cells) were positive for endogenous αTAT1 (Extended Data Fig. 4bc and Fig. 2a). GFP-αTAT1 was also found in focal adhesions and was associated with the microtubule network (Extended Data Fig. 4ad). In addition, co-immunoprecipitation assay with GFP-αTAT1 recovered tubulin as well as α-adaptin but not the AP-1 subunit γ-adaptin (Fig. 2b). Of note, αTAT1 knockdown did not affect microtubule pausing at CCPs nor clathrin-mediated endocytosis (Extended Data Fig. 5ab).
Extended Data Figure 4. Subcellular localization of endogenous and GFP-tagged αTAT1.
a, HeLa cells overexpressing GFP-αTAT1 and mCherry-tubulin were imaged by spinning disk microscopy. Insets show the indicated regions at higher magnification. Scale bar, 10 μm. b, HeLa cells overexpressing GFP-αTAT1 and mRFP-LCa were imaged by TIRF-M. Insets show the indicated regions at higher magnification. Arrowheads point to CCPs. Scale bar, 10 μm. c, HeLa cells treated with nocodazole for 5 hours were stained for endogenous αTAT1 and α-adaptin. Insets show the indicated regions at higher magnification. Arrowheads point to CCPs. Scale bar, 10 μm. d, HeLa cells overexpressing GFP-αTAT1 and mCherry-paxillin were treated with nocodazole and imaged by TIRF-M. Note that GFP-αTAT1 accumulation into paxillin-positive focal adhesions was also observed in untreated cells (not shown). Insets show the indicated regions at higher magnification. The arrowhead points to one focal adhesion. Scale bar, 10 μm.
Figure 2. αTAT1 interaction with AP-2 is required for α-tubulin acetylation.
a, HeLa cells stained for αTAT1 and α-adaptin (TIRF-M). b, c, Immunoprecipitation (b) or GST-pull-down (c) experiments of GFP-αTAT1 or GST-αTAT1 fragments, respectively, with HeLa cell lysate. d, in vitro direct binding assay between GST-αTAT1/307-387 and purified AP-2 and tubulin. e, Pull-down assays of GST-αTAT1/307-387 with GFP-tagged α-adaptin variants from HeLa cells lysate. f, g, Acetylated-K40 levels in α-adaptin-depleted HeLa cells transfected with the indicated construct. Fluorescence intensity of acetylated-K40 expressed as percentage ± s.e.m of siNT-treated, GFP-transfected cells (* P<0.001). Scale bars, 10 μm.
Extended Data Figure 5. Effects of αTAT1 knockdown on transferrin endocytosis and EB1 disappearance at CCPs.
a, HeLa cells treated with non-targeting (NT) or αTAT1-specific siRNAs were assessed for endocytosis of Alexa488-transferrin (Tf). Data expressed as average percentage ± s.e.m of surface bound Tf at time 0. b, HeLa cells treated with non-targeting (NT) or αTAT1-specific siRNAs and overexpressing GFP-EB1 and mRFP-LCa were imaged by TIRF-M (for 120 s at 1 frame/s). The percentage of EB1 comets that stopped upon contact with CCPs was quantified and compared with randomized scenarios obtained by shifting the LCa mask of 5 pixels in all four orthogonal directions (N, number of cells analysed; n, number of EB1 comets analysed; * P<0.001, ns: no significant difference).
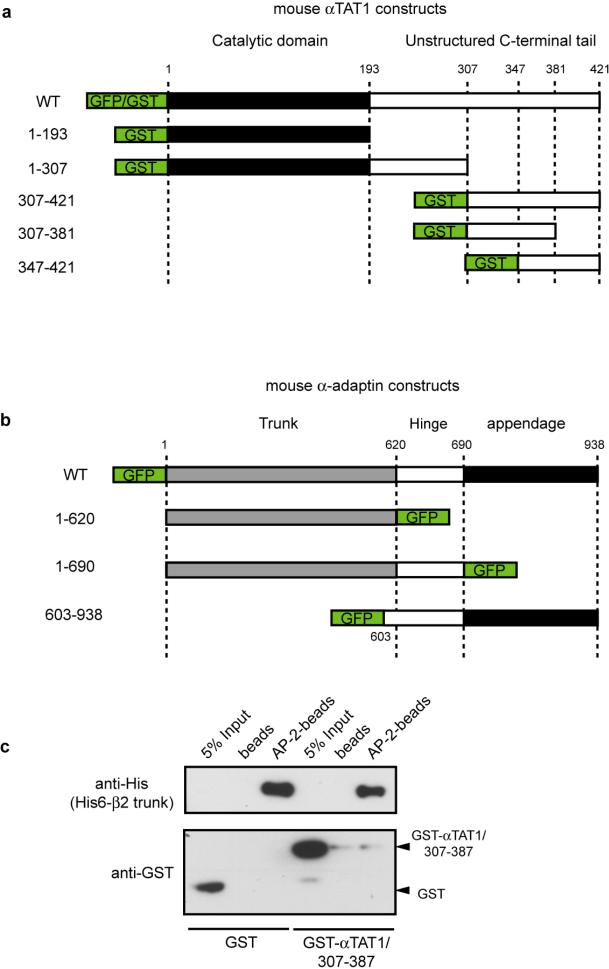
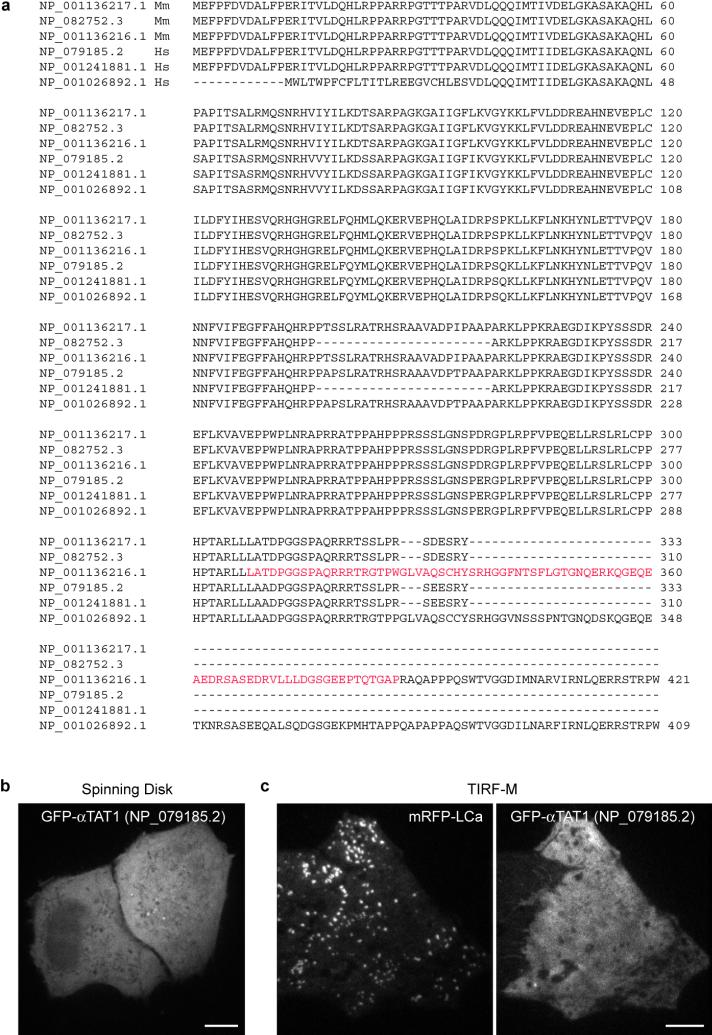
αTAT1 comprises a catalytic domain (residues 1-193) and an unstructured tail (residues 193–421, Extended Data Fig. 6a) 9. We found that residues 307-387 contained the minimal binding sites for both AP-2 and tubulin (Fig. 2c). This region interacted directly with purified AP-2 and tubulin (Fig. 2d); there was no competition between tubulin and AP-2 for binding to GST-αTAT1/307-387 indicating that the two proteins have distinct binding sites (Fig. 2d). Interestingly, GST-αTAT1/307-387 did not interact with recombinant AP-2 ‘core complex’ lacking the hinge and appendage domains of α- and β2-adaptin 18 (Extended Data Fig. 6c). In addition, the AP-2-binding region of αTAT1 (307-387) pulled-down full-length α-adaptin and a truncated variant lacking the appendage domain (residues 1-690), but not a construct missing both the hinge and appendage domains (residues 1-620, Extended Data Fig. 6b and Fig 2e). Conversely, the hinge and appendage domains (residues 603-938) were robustly pulled down by GST-αTAT1/307-387 (Fig. 2e). Together, these data support the conclusion that αTAT1 associates directly with the hinge domain of α-adaptin. Of note, a shorter αTAT1 isoform lacking the AP-2-binding domain (Extended Data Fig. 7a) 3 associated neither with microtubules nor with CCPs (Extended Data Fig. 7bc), suggesting that different αTAT1 isoforms are differentially localised. Consistent with an essential role for the interaction between αTAT1 and AP-2 in K40 acetylation, expression of wild-type α-adaptin but not α-adaptin/1-620 restored K40 acetylation in α-adaptin-depleted HeLa cells (Fig. 2f-g).
Extended Data Figure 6. αTAT1 does not interact with recombinant AP-2 core complex missing the ear and hinge domains of α- and β2-adaptins.
a, b, Description of mouse αTAT1 (a) and mouse α-adaptin (b) constructs used in this study. c, Recombinant AP-2 core complex lacking the hinge and appendage regions of α- and β2-adaptins and comprising a His6-tagged β2-trunk was immobilized on Ni2+ beads and incubated with GST or GST-αTAT1/307-387. Control consisted in Ni2+ beads alone incubated with GST constructs. Bound proteins were detected using anti-His6-tag antibodies (to detect His6-tagged β2-trunk in AP-2 core complex) or anti-GST antibodies.
Extended Data Figure 7. A human isoform of αTAT1 that lacks the AP-2- and tubulin-binding domain localises neither to microtubules nor to CCPs.
a, ClustalW2 alignment of the various mouse (Mm) and human (Hs) αTAT1 isoforms. The minimal AP-2- and tubulin-binding domain of the longest mouse isoform, which was used in this study, is indicated in red. b, HeLa cells overexpressing human GFP-αTAT1 (NP_079185.2) were imaged by spinning disk microscopy. Scale bar, 10 μm. c HeLa cells overexpressing human GFP-αTAT1 (NP_079185.2) and mRFP-LCa were imaged by TIRF-M. Scale bar, 10 μm.
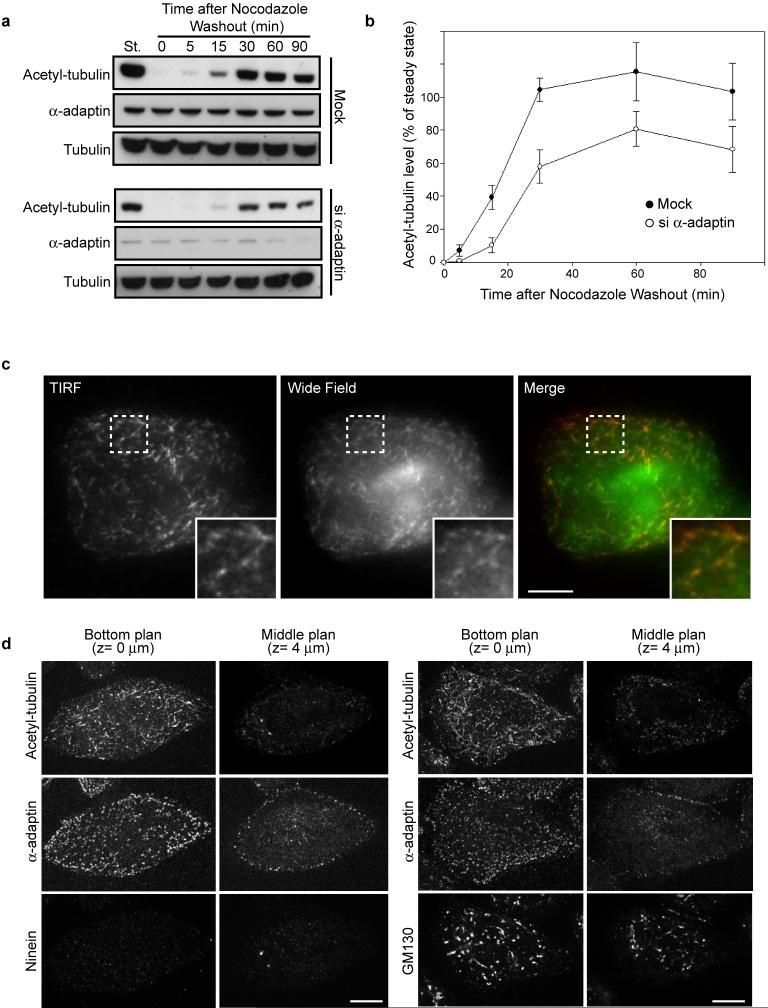
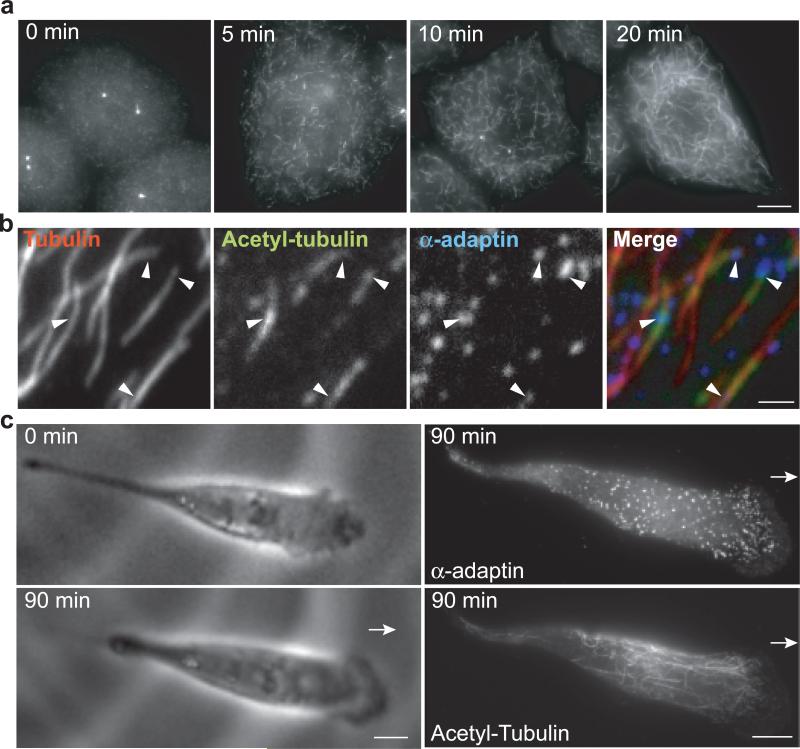
We next investigated whether CCPs are sites of microtubule acetylation. When microtubules were depolymerised with nocodazole, K40-acetylated tubulin was barely detected (Extended Data Fig. 8ab, time 0); only bright dots corresponding to centrosomes remained visible (Fig. 3a). In agreement with previous findings 19, short acetylated microtubule segments were visible in the vicinity of the adherent plasma membrane 5 min after nocodazole washout-induced microtubule regrowth while acetylated-K40 levels increased (Fig. 3a and Extended Data Fig. 8a-d). Many of these acetylated segments were at the extremity of longer microtubules (Fig. 3b) and ~24% of these segments were either overlapping with or had one end in contact with a CCP (Fig. 3b, as compared to 15% when CCPs distribution was randomized, P<0.001, Chi-squared test). These data are consistent with the conclusion that CCPs are sites of microtubule acetylation, although we do not exclude that other microtubule acetylation sites may exist. The length of acetylated microtubule segments increased progressively with time, concomitant with acetylated-K40 levels also reaching a plateau, while K40 acetylation was strongly delayed and reduced in α-adaptin-depleted cells (Fig. 3a and Extended Data Fig. 8ab). Because golgi-associated microtubules are rapidly acetylated under nocodazole washout conditions 20, the subset of microtubule being acetylated at CCPs 5 min after nocodazole washout could arise from Golgi-mediated nucleation 21.
Extended Data Figure 8. Kinetics of acetylated-microtubule recovery at the plasma membrane after nocodazole washout.
a, HeLa cells transfected with siNT (mock) or α-adaptin siRNA were treated with nocodazole for 5 hours and then the drug was washed out to allow the microtubules to repolymerize for the indicated times. Cell lysates were analyzed by western-blot using the indicated antibodies. St, steady state situation without nocodazole treatment. b, Quantification of the pixel densities of the bands detected by the anti-K40 acetyl-tubulin antibody as in (a) expressed as a percentage of respective steady state levels ± s.e.m (normalized to total tubulin levels, from three independent experiments). c, HeLa cells were treated with nocodazole for 5 hours and then the drug was washed out to allow microtubules to re-polymerize for 5 min before fixation and staining with anti-K40 acetyl-tubulin antibody. Cells were then imaged in TIRF or wide-field mode to visualize acetylated microtubules in the vicinity of the adherent plasma membrane or within the cytoplasm, respectively. Note that the pattern of acetylated microtubules does not differ between TIRF and wide-field image indicating that most of acetylated microtubules are in close proximity to the plasma membrane. Insets show the boxed region at higher magnification. Scale bar, 10 μm. d, HeLa cells were treated with nocodazole for 5 hours and then the drug was washed out to allow microtubules to re-polymerize for 5 min before fixation and staining with indicated antibodies. Images were acquired with a spinning disk microscope by focusing on the adherent plasma membrane (bottom plane, z-section= 0 μm) or in the middle of the cell (middle plane, z-section= 4 μm). Note that most of the acetylated microtubule segments are found in the vicinity of the plasma membrane while not all the intracellular organelles (Ninein-positive centrosomes, GM130-associated Golgi stacks) are at the bottom of the cell.
Figure 3. Spatial restriction of microtubule acetylation by CCP distribution.
a, b, HeLa cells stained for K40 acetyl-tubulin (a) or α-adaptin, total tubulin and acetylated-K40 (b) at the indicated times (a) or 5 min (b) after nocodazole washout. c, Live MDA-MB-231 cells imaged for 90 min (left panels) and then fixed and stained for α-adaptin and K40 acetyl-tubulin (right panels). Scale bars, 10 μm (a and c) and 2 μm (b).
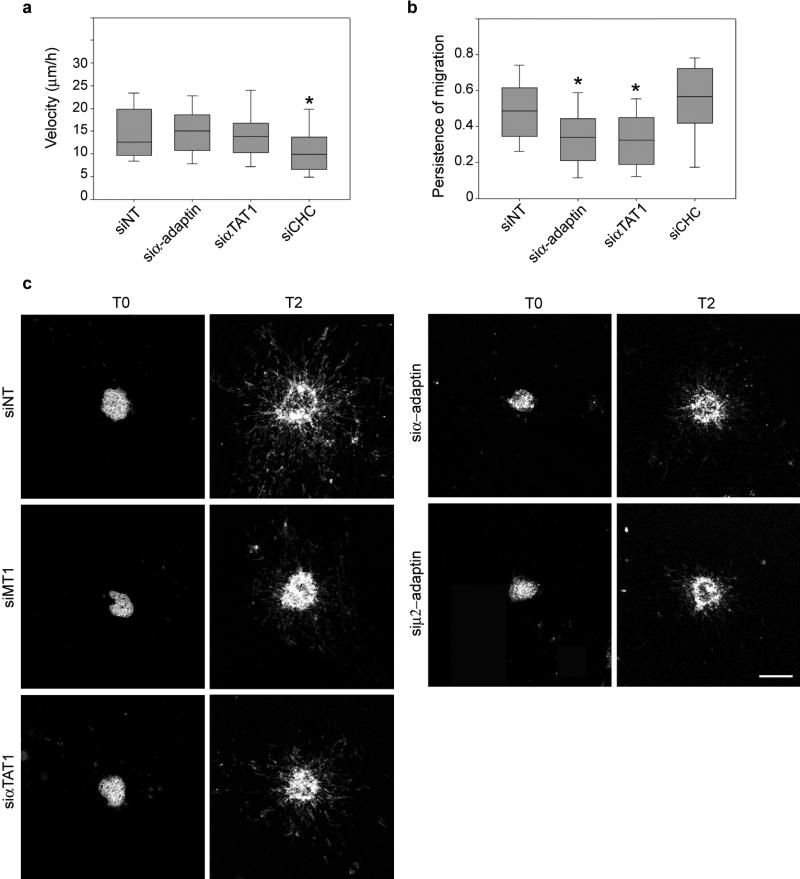
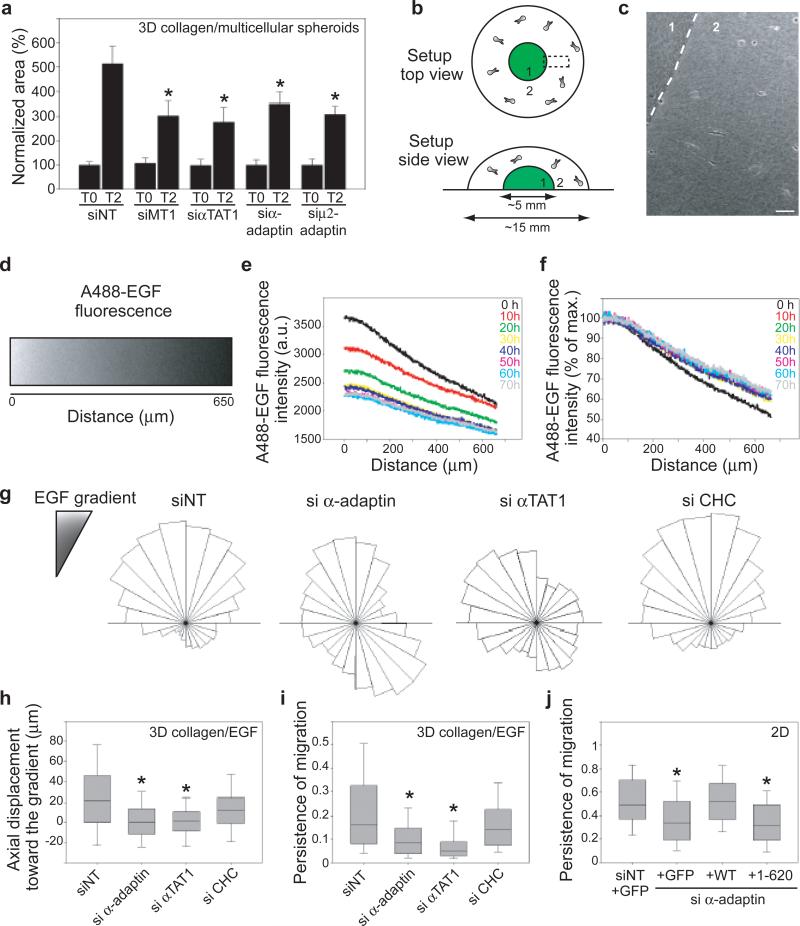
Stable microtubules oriented towards the leading edge play a role in migrating cells 22,23. We observed that in MDA-MB-231 cells migrating on a 2D substrate or through a 3D matrix of collagen-I fibres, acetylated microtubules were oriented towards the cell front where CCPs accumulated 10 (Fig. 3c and Extended Data Fig. 9ab). Moreover, acetylated-K40 levels were reduced in AP-2- or αTAT1-depleted cells within the 3D environment (Extended Data Fig. 9c). This suggested that αTAT1 associated with CCPs at the cell front controls the polarised distribution of acetylated microtubules. On a 2D substrate, MDA-MB-231 cells depleted for α-adaptin or αTAT1 moved with a similar velocity to control cells but in less linear paths indicating that both proteins regulate the directionality of cell migration (Extended Data Fig. 10ab). By contrast, CHC-depletion reduced velocity but did not affect directionality (Extended Data Fig. 10ab), possibly reflecting the AP-2-independent role of clathrin in focal adhesion turnover, a process that is required for migration 24. Inactivation of AP-2 or αTAT1 also inhibited the invasive migration of MDA-MB-231 cells in a 3D environment as potently as knockdown of the pro-invasive metalloproteinase MT1-MMP (Fig. 4a and Extended Data Fig. 10c) 6,25. Migration of cancer cells away from the primary tumour is generally oriented towards growth factors in the microenvironment 26. We generated a gradient of epidermal growth factor (EGF) in the 3D collagen gel (Fig. 4b-d) and observed that although the intensity of the gradient progressively diminished over time (Fig. 4e), the slope remained approximately constant (Fig. 4f) and cells effectively moved towards the gradient (Fig. 4g-h). Silencing of AP-2 or αTAT1, but not of CHC, inhibited cell movement towards the EGF gradient (Fig. 4g-h) as well as the directionality (persistence) of migration (Fig. 4i). Finally, consistent with an essential role for the interaction between αTAT1 and AP-2, expression of wild-type α-adaptin but not α-adaptin/1-620 restored the directionality of 2D migration in α-adaptin-depleted cells (Fig. 4j).
Extended Data Figure 9. Distribution of AP-2 and microtubules in MDA-MB-231 cells migrating in a 3D collagen matrix.
a-b, MDA-MB-231 cells migrating away the multicellular spheroid at T2 (see Extended Data Methods) were fixed and stained for immunofluorescence microscopy with antibodies against α-adaptin (red) and K40-tubulin (green, panel a) or α-tubulin (green, panel b); the DNA was stained with DAPI (blue; upper panel). Scale bar, 10 μm. The lower panel shows the fluorescence intensity distribution along the long cell axis. Thirteen or ten cells from two independent experiments were analysed, respectively, and the data are expressed as the average fluorescence intensity ± s.e.m. Arrows indicate the apparent direction of migration. c, MDA-MB-231 cells treated with indicated siRNAs and escaping from a spheroid at T2 were fixed in paraformaldehyde and stained for K40-acetylated tubulin. Scale bar, 10 μm. Arrows indicate the apparent direction of migration.
Extended Data Figure 10. α-adaptin- or αTAT1-depletion inhibits persistent cell migration and invasion.
a-b, MDA-MB-231 cells treated with non-targeting (NT), α-adaptin, αTAT1 or CHC-specific siRNAs were plated on glass-bottom dishes and imaged by phase-contrast microscopy every 5 min for 8 hours. Cells were manually tracked using Metamorph software and cell velocity (a) and persistent migration index (b) were calculated for each cell and represented as box plots. Error bars indicate mean ± s.e.m (from 150 to 180 cells per conditions from three independent experiments, * P<0.05). c, Multicellular spheroids of MDA-MB-231 cells treated with NT, αTAT1- or AP-2-specific siRNAs, as indicated, were embedded in a 3D collagen matrix and fixed immediately (T0) or 2 days later (T2) then stained with phalloidin. Scale bar, 300 μm.
Figure 4. αTAT1 interaction with AP-2 is required for directed cell migration.
a, Area of 3D invasion after 2 days (T2) by spheroids of siRNAs-treated MDA-MB-231 cells. b, c Schematic representation (b) or phase-contrast image (c) of the 3D collagen I EGF-chemotaxis setup. Scale bar, 50 μm. d, A488-EGF gradient at time 0 in a region corresponding to boxed area in (b). e-f, Evolution over time of the intensity (e) and slope (f) of the A488-EGF gradient. g, Angular distribution relative to gradient orientation of siRNAs-treated MDA-MB-231 cells. h-i, Axial displacement towards the gradient (h) and persistence of migration (i) of siRNAs-treated MDA-MB-231 cells. j, Persistence of migration on glass coverslip of MDA-MB-231 cells depleted for α-adaptin and expressing the indicated constructs. Error bars indicate mean ± s.e.m (*P<0.001 in a and P<0.05 in h-j).
In conclusion, we report an unanticipated role for CCPs in microtubule acetylation through a direct interaction between αTAT1 and AP-2. We propose that the asymmetric distribution of CCPs shapes the acetylated microtubule network by selectively acetylating microtubules that are orientated toward the leading edge, thus promoting directed cell motility and chemotaxis.
METHODS
Cell culture
HeLa cells (a gift from A. Dautry, Institut Pasteur, Paris, France) were grown in DMEM supplemented with 10% foetal calf serum, 2 mM glutamine and 150 μg/ml penicillin/streptomycin at 37°C in 7% CO2. MDA-MB-231 cells (ATCC), a human breast carcinoma cell line, were grown in L15 medium supplemented with 15% foetal calf serum and 2 mM glutamine at 37°C in 1% CO2.
TIRF microscopy and spinning disk microscopy
For live cell total internal reflection fluorescent microscopy (TIRF-M), HeLa or MDA-MB-231 cells seeded onto glass-bottom dishes were transfected with the indicated constructs and imaged the next day for exposure times of 100 ms at 1 s intervals for 120 s through a 100x 1.49 NA TIRF objective lens on a Nikon TE2000 (Nikon France SAS, Champigny sur Marne, France) inverted microscope equipped with a QuantEM EMCCD camera (Roper Scientific SAS, Evry, France / Photometrics, AZ, USA), a dual output laser launch, which included 491 and 561 nm 50 mW DPSS lasers (Roper Scientific), and driven by Metamorph 7 software (MDS Analytical Technologies, Sunnyvale, CA, USA). A motorized device driven by Metamorph allowed the accurate positioning of the illumination light for evanescent wave excitation.
For spinning disk microscopy, HeLa or MDA-MB-231 cells plated onto glass-bottom dishes and transfected with the indicated constructs were imaged for exposure times of 100 ms at 1 s intervals for 120 s using a spinning disk microscope (Roper Scientific) based on a CSU22 Yokogawa head mounted on the lateral port of an inverted TE-2000U Nikon microscope equipped with a 100x 1.4NA Plan-Apo objective lens and a dual-output laser launch, which included 491 and 561 nm 50 mW DPSS lasers (Roper Scientific). Images were acquired with a CoolSNAP HQ2 CCD camera (Roper Scientific). The system was steered by Metamorph 7 software.
Automatic EB1 and LCa spot detection and tracking
HeLa cells or MDA-MB-231 cells transfected with mRFP-LCa and GFP-EB1 were imaged the next day by TIRF-M for exposure times of 100 ms at 1 s intervals for 120 s. Automatic detection of EB1 and LCa fluorescent spots and automatic tracking of EB1 comets was performed using the ICY software (http://icy.bioimageanalysis.org 28). Briefly, detection of EB1 and LCa spots was based on wavelet transform and automatic tracking of EB1 comets was then performed by a Bayesian Kalman filtering approach using a linear kinetic model. Once the tracks were computed, the last spots of each track were extracted to compute the distance colocalisation frame by frame with the coordinates of LCa spot centroid. The colocalisation distance was defined as a positive hit when the pixel distance between EB1 and LCa centroids was less than or equal to three pixels. The percentage of last-detected EB1 centroids that colocalised with LCa spots was calculated for each frame and the average value for the 120 frames was then calculated. The same analysis was also performed after shifting the positions of CCPs of 5 pixels in order to exclude a possible random superposition of last EB1 spots and CCPs. For each cell, this control analysis was performed four times by shifting CCPs positions in the four different orthogonal directions and the values obtained were averaged to give the percentage of random coincidence between last EB1 spots and CCPs coordinates.
Antibodies
Mouse monoclonal anti-α-tubulin (clone DM 1A) and anti-K40 acetylated tubulin (clone 6-11B1) were purchased from Sigma. Recombinant humanised anti-α-tubulin (clone F2C-hFc2) was purchased from the antibody platform of the Institut Curie (Paris, France). Mouse monoclonal anti-polyglutamylated tubulin (clone GT335) was a kind gift from Carsten Janke (Institut Curie, Orsay, France). Mouse monoclonal anti-GFP antibodies (clone 7.1 and 13.1) were from Roche Diagnostics (Meylan, France). Anti-His6-tag polyclonal antibodies were from Cell Signaling (Beverly, MA, USA). Rabbit polyclonal anti-GST antibodies were from Oncogene Research Products (La Jolla, CA, USA). Mouse monoclonal anti-clathrin heavy chain (CHC) antibody and mouse monoclonal anti-γ-adaptin antibody were obtained from BD Transduction Laboratories (Becton Dickinson France SAS, Le Pont-De-Claix, France). Rabbit polyclonal anti-α-adaptin antibodies (M300) were purchased from Santa Cruz Biotechnology Inc. (Santa Cruz, CA, USA). Rabbit polyclonal anti-αTAT1 antibodies have been described4. Nocodazole was purchased from Sigma. HRP-conjugated anti-mouse and anti-rabbit antibodies for western blot, Cy3-conjugated anti-rabbit and Cy5-conjugated F(ab’)2 anti-human antibodies were from Jackson ImmunoResearch Laboratories (West Grove, PA, USA). Alexa488-conjugated human transferrin, Alexa488-conjugated anti-mouse antibodies and Alexa545-labelled phalloidin were from Molecular Probes (Invitrogen).
RNA interference
For siRNA depletion, HeLa cells or MDA-MB-231 cells were plated at 20% confluence and treated with the indicated siRNA (25 nM) using Oligofectamine (Invitrogen, Carlsbad, CA) or Lullaby (OZ Biosciences, France), respectively, according to the manufacturer's instruction. Protein depletion was maximal after 72 h of siRNA treatment as shown by immunoblotting analysis with specific antibodies. Equal loading of the cell lysates was verified by immunoblotting with anti-tubulin antibodies. The following siRNAs were used: α-adaptin, 5’-AUGGCGGUGGUGUCGGCUCTT-3’; μ2-adaptin, 5’-AAGUGGAUGCCUUUCGGGUCA-3’ (29,30); αTAT1, 5’-GUAGCUAGGUCCCGAUAUA-3’, 5’-GAGUAUAGCUAGAUCCCUU-3’, 5’-GGGAAACUCACCAGAACGA-3’, 5’-CUUGUGAGAUUGUCGAGAU-3’ (ON-TARGETplus SMARTpool, Dharmacon, Lafayette, CO, USA); MT1-MMP, 5’-GGAUGGACACGGAGAAUUU-3’, 5’-GGAAACAAGUACUACCGUU-3’, 5’-GGUCUCAAAUGGCAACAUA-3’, 5’-GAUCAAGGCCAAUGUUCGA-3’ (ON-TARGETplus SMARTpool, Dharmacon); non-targeting siRNAs (siNT), ON-TARGETplus Non-Targeting SMARTpool siRNAs (Dharmacon).
DNA constructs and transfection
HeLa cells were transfected using the calcium phosphate procedure and analyzed 24 to 48 h after transfection. MDA-MB-231 cells were transfected using Lipofectamin (Invitrogen) according to the manufacturer's instructions and analyzed 48 h after transfection.
DNA sequence encoding residues 1-421 (full length), 1-193, 1-307, 307-421, 307-387 or 347-421 of mouse αTAT1 was obtained by PCR by using cDNA of C-terminally GFP-tagged mMEC17 (a kind gift from Carsten Janke, Institut Curie, Orsay, France) as a template. PCR fragments with engineered flanking restriction sites were subcloned into the multi-cloning sites of pGEX4T1 (Amersham Pharmacia Biotech) or pEGFP-C3 (Clontech) to encode in-frame fusion proteins with the amino-terminal GST- or EGFP-tag, respectively. GFP-tagged human short isoform of αTAT1 (NP_079185.2), mRFP-LCa and GFP-α-adaptin (WT and mutant) constructs have been already described 9,29,30. GFP-tagged EB1, GFP-tagged α-tubulin and mCherry-tagged paxillin were kind gift of Drs. Guy Keryer (Institut Curie, Orsay, France), Danijela Vignjevic (Institut Curie, Paris, France) and Vic Small (IMBA, Vienna, Austria), respectively. All constructs were verified by double-stranded DNA sequencing.
Endocytosis assay
HeLa cells treated with the indicated siRNA were serum-starved for 30 min at 37 °C in DMEM and then washed in PBS and detached using Versene. Harvested cells were incubated for 1 h in ice-cold binding medium (DMEM, 1% BSA, 20mM Hepes) containing 5 μg/ml Alexa488-conjugated human transferrin (Tf). After a quick wash in ice-cold binding medium, cells were incubated in DMEM, 1% BSA, 20 mM Hepes at 37 °C for the indicated time before to be rapidly cooled on ice. After two washes in cold PBS, cells were acid-washed in ice-cold stripping medium (50 mM glycine, 100 mM NaCl, pH 3.0) for 2 minutes to remove surface-bound Tf. Cells were then washed in cold PBS and kept on ice in cold PBS before analysis. Cells were analyzed on a Accuri C6 system (BD biosciences) measuring the fluorescence of Alexa488. At least 10,000 cells were analyzed per time point. Data are expressed as average percentage ± s.e.m of surface-bound fluorescence after the binding step. Background fluorescence was measured from acid-washed cells just after the binding step and the value was substracted from all time points.
Protein purification, pull-down assays and immunoprecipitation
Purification of the various αTAT1 domains fused to GST was performed using standard protocols. For pull-down assays, HeLa cells non-transfected or transfected with GFP-α-adaptin constructs were lysed in 50 mM Tris pH 7.4, 137 mM NaCl, 10 mM MgCl2, 10% glycerol, 1% Triton-X100 containing a cocktail of protease inhibitors (Roche Diagnostics) and centrifuged at 15,000g for 10 min at 4°C. Supernatants were incubated with 2 μM GST or the indicated GST fusion proteins for 15 minutes at 4°C in the presence of 0.1% BSA. Then, glutathione-Sepharose beads were added for 1 h. The beads were washed and the bound proteins were analysed by SDS−PAGE and immunoblotting with anti-α-adaptin polyclonal antibodies or anti-α-tubulin or anti-GFP monoclonal antibodies.
For immunoprecipitation assays, HeLa cells transfected with GFP or GFP-αTAT1 were lysed in 50 mM Tris pH 7.4, 137 mM NaCl, 10 mM MgCl2, 10% glycerol, 1% Triton-X100 containing protease inhibitors and centrifuged at 13,000 rpm for 10 min at 4°C. Supernatants (1–2 mg of total protein in 1 ml) were incubated with 15μl GFP-Trap-coupled agarose beads (ChromoTek GmbH, Martinsreid, Germany) for 2 h at 4°C. Beads were washed three times in lysis buffer and the bound proteins were eluted in SDS sample buffer and analysed by SDS-PAGE and immunoblotting with anti-α-adaptin polyclonal anti-bodies or anti-γ-adaptin, anti-CHC, anti-α-tubulin or anti-GFP monoclonal antibodies.
In vitro binding assays
Purified calf brain AP-2 and recombinant AP-2 core complex (comprising a His6-tagged β2-adaptin trunk missing the hinge and appendage domains, α-adaptin trunk also missing the hinge and appendage domains, μ2-adaptin and σ2-adaptin 18) were purified as described18,31. For direct binding assays with purified AP-2, 2 μM GST or GST-αTAT1/307-387 were immobilized on glutathione-Sepharose beads in binding buffer (50 mM Tris pH 7.4, 137 mM NaCl, 10 mM MgCl2, 10% glycerol, 1% Triton-X100, 0.5% BSA contaning a cocktail of protease inhibitors) and incubated for 1 h at 4 °C with 2 μM purified rat brain AP-2. For direct binding assays with recombinant AP-2 core, 2 μM of recombinant AP-2 were immobilized on Ni-NTA beads (Qiagen SAS, Courtaboeuf, France) in binding buffer supplemented with 20mM imidazole, and incubated for 1 h at 4 °C with 4 μM GST or GST-αTAT1/307-387. Beads were then washed and the bound proteins were analysed by SDS−PAGE and immunoblotting with specific antibodies.
Indirect immunofluorescence and correlative live-cell imaging
HeLa cells or MDA-MB-231 cells plated onto coverslips were fixed in ice-cold methanol and processed for immunofluorescence microscopy by using anti-α-tubulin, anti-K40 acetylation tubulin or anti-α-adaptin antibodies. Cells were imaged with the 100× objective of a wide-field microscope DM6000 B/M (Leica Microsystems) equipped with a CCD CoolSnap HQ camera (Roper Scientific) and steered by Metamorph 7 (Molecular Devices). For nocodazole washout experiments, HeLa cells were incubated for 5 hours with 10μM nocodazole at 37°C, then washed three times in pre-warmed complete medium and incubated at 37°C for the indicated time before fixation in ice-cold methanol.
For correlative live-cell imaging and immunofluorescence microscopy, MDA-MB-231 cells were plated on 35 mm gridded glass-bottom dishes (MaTek Corporation, Ashland, MA, USA) and put in an open chamber (Life Imaging) equilibrated in 1% CO2 at 37°C. Time-lapse sequences were recorded at 5 min intervals for 90 min on a Nikon TE2000-E microscope equipped with a CoolSnapHQ camera, using a 40x, 0.6 NA objective lens and controlled by Metamorph software (Molecular Devices). Immediately after image acquisition, cells were fixed in ice-cold methanol and stained for α-adaptin and K40-acetylated tubulin by using specific antibodies. Cells were then imaged as described above.
All representative pictures shown are from at least three independent experiments.
2D migration assay
MDA-MB-231 cells treated with the indicated siRNAs and expressing or not the indicated GFP-tagged construct were seeded on glass-bottom dishes and imaged the next day every 5 min for 8 hours by phase-contrast video microscopy. In conditions were cells expressed a GFP-tagged construct, one fluorescent image was acquired at the beginning of the time-lapse sequence to detect transfected cells. Manual tracking of individual cells was performed using Metamorph software to calculate cell velocity, accumulated distance of migration and Euclidean distance of migration. Persistent migration index was calculated by dividing the Euclidean distance by the accumulated distance.
3D collagen I multicellular spheroid invasion assay
Multicellular spheroids of MDA-MB-231 cells were prepared by the hanging droplet method32 using 3×10³ cells in 20 μl droplets of complete L15 medium. For siRNA treatment, cells were first transfected by nucleofection (Kit V, Lonza, Cologne, Germany) with 100nM SMARTpool siRNAs specific for αTAT1 or MT1-MMP and transfected again the next day with 25nM of the same siRNA using Lullaby reagent (OZ Bioscience); spheroids were prepared 24 hours later. After 3 days, spheroids were embedded in type I collagen (prepared from acid extracts of rat tail tendon at a final concentration of 2.2 mg/ml33). Spheroids were fixed in 4% paraformaldehyde or methanol immediately after polymerization of the matrix (T0) or after 2 days of invasion (T2). After fixation, cells in spheroids were permeabilised for 15 min with 0.1% Triton X-100/10% FCS/PBS and labelled with Alexa545-phalloidin (paraformaldehyde-fixed cells) or with anti-α-adaptin and anti-K40 acetylated tubulin antibodies (methanol-fixed cells). For quantification of invasion in 3D type I collagen matrix, phalloidin-labelled spheroids were imaged with a Zeiss LSM510 microscope using a dry 5x objective lens (NA 0.25/WD 10.5), collecting a stack of images along the z-axis with at 10μm interval between optical sections. Quantification of invasion was performed by measuring the diameter of spheroids at T0 and T2 as described6. These values were averaged and used to calculate the mean invasion area (πr2). Mean invasion area at T2 was normalized to mean invasion area at T0. Depletion of the metalloproteinase MT1-MMP (siMT1) which is required for efficient migration through a 3D collagen matrix6 was used as a control.
3D collagen I EGF-chemotaxis assay
Glass-bottom dishes were coated with 0.005% poly-L-lysine (Sigma-Aldrich) for 20 min at 37°C to minimize collagen gel detachment and drift of the setup. A 50 μl droplet of collagen I (rat tail acid extracted, BD bioscience) at a final concentration of 2.5 mg/ml and containing 1 μg/ml of Alexa-488-EGF (Invitrogen) was then polymerized at RT for 30 min (inner gel). During this polymerisation phase, EGF binds onto collagen fibres (our observation, not shown). After three washes with PBS to remove excess EGF, a second droplet (200 μl, outer gel) of collagen I at a final concentration of 2.2 mg/ml and seeded with 10,000 MDA-MB-231 cells/ml was polymerized around the inner droplet for 1 hour at RT before to immerge the setup in pre-warmed L15 medium containing 2% FCS. Cells in the outer gel were then imaged every 20 min for 72 hours by phase-contrast video microscopy using a 10x dry objective at the interface between the inner and outer gels in order to keep track of the gradient parameters (slope and relative intensity) through recording of A488-EGF fluorescence intensity. As described in Fig. 4, the intensity of the gradient was not constant and actually decreased over time but its slope remained approximately the same. This is important as it was described that cells are primarily sensitive to the steepness of the gradient and to a lesser extent to its intensity 34. Manual tracking of individual cells was performed using Metamorph software and allowed to calculate the displacement of each cell along the axis of the gradient as well as the persistent migration index (Euclidean distance/accumulated distance). 150 to 180 cells from three independent experiments for each condition were tracked in a single focal plane as we observed that cell movements in and out of the focal plane were very rare. Rose plots were constructed using the “chemotaxis and migration tool 1.01” plugin (Ibidi) in ImageJ software.
Statistical analyses
Statistical analyses in Fig 1g, 2g, 4ahij and Extended Data Fig. 3c and 10 have been performed using Kruskal-Wallis One Way Analysis of Variance (ANOVA) followed by an All Pairwise Multiple Comparison Procedure (Tukey Test). Data in Fig. 1b and Extended Data Fig. 5b have been analyzed using chi-squared test. Data in Extended Data Fig. 1b have been tested using Student's t-test. All statistical analyses were performed using SigmaStat software. 20-25 cells from two independent experiments have been analysed in Fig. 2g
ACKNOWLEDGMENTS
The authors wish to thank Drs P. Tran and C. Janke for critical comments on the manuscript and S. Linder for suggestion of the 3D collagen I EGF-chemotaxis assay. We are indebted to E. Macia for purification of recombinant AP-2 complex and S. Lemeer for generation of α-adaptin mutants. We thank the Cell and Tissue Imaging Facility and Nikon Imaging Center@Institut Curie & CNRS for help with image acquisition. Core funding for this work was provided by the Institut Curie and the CNRS and additional support was provided by grants from Fondation ARC pour la Recherche contre le Cancer (SL220100601356) and Institut National du Cancer (2009-1-PL BIO-12-IC-1) to PC.
Footnotes
AUTHOR CONTRIBUTIONS
G.M designed the project and the experiments, performed experiments, analysed results and wrote the manuscript. V.M.Y and J.C.O.M generated software for automated tracking analyses. M.I and A.C.C performed and quantified multicellular spheroid 3D migration experiments. M.F purified proteins and designed experiments. T.S, M.V.N and A.B provided critical materials and designed experiments. P.C supervised the study, contributed to experimental design and wrote the manuscript.
The authors declare no competing financial interests.
Extended Data is linked to the online version of the paper at www.nature.com/nature.
REFERENCES
- 1.Perdiz D, Mackeh R, Pous C, Baillet A. The ins and outs of tubulin acetylation: more than just a post-translational modification? Cellular signalling. 2011;23:763–771. doi: 10.1016/j.cellsig.2010.10.014. doi:10.1016/j.cellsig.2010.10.014. [DOI] [PubMed] [Google Scholar]
- 2.Wloga D, Gaertig J. Post-translational modifications of microtubules. J Cell Sci. 2010;123:3447–3455. doi: 10.1242/jcs.063727. doi:10.1242/jcs.063727. [DOI] [PMC free article] [PubMed] [Google Scholar]
- 3.Witte H, Neukirchen D, Bradke F. Microtubule stabilization specifies initial neuronal polarization. J Cell Biol. 2008;180:619–632. doi: 10.1083/jcb.200707042. doi:10.1083/jcb.200707042. [DOI] [PMC free article] [PubMed] [Google Scholar]
- 4.Castro-Castro A, Janke C, Montagnac G, Paul-Gilloteaux P, Chavrier P. ATAT1/MEC-17 acetyltransferase and HDAC6 deacetylase control a balance of acetylation of alpha-tubulin and cortactin and regulate MT1-MMP trafficking and breast tumor cell invasion. European journal of cell biology. 2012;91:950–960. doi: 10.1016/j.ejcb.2012.07.001. doi:10.1016/j.ejcb.2012.07.001. [DOI] [PubMed] [Google Scholar]
- 5.Hubbert C, et al. HDAC6 is a microtubule-associated deacetylase. Nature. 2002;417:455–458. doi: 10.1038/417455a. doi:10.1038/417455a. [DOI] [PubMed] [Google Scholar]
- 6.Rey M, Irondelle M, Waharte F, Lizarraga F, Chavrier P. HDAC6 is required for invadopodia activity and invasion by breast tumor cells. European journal of cell biology. 2011;90:128–135. doi: 10.1016/j.ejcb.2010.09.004. doi:10.1016/j.ejcb.2010.09.004. [DOI] [PubMed] [Google Scholar]
- 7.Tran AD, et al. HDAC6 deacetylation of tubulin modulates dynamics of cellular adhesions. J Cell Sci. 2007;120:1469–1479. doi: 10.1242/jcs.03431. doi:10.1242/jcs.03431. [DOI] [PubMed] [Google Scholar]
- 8.Akella JS, et al. MEC-17 is an alpha-tubulin acetyltransferase. Nature. 2010;467:218–222. doi: 10.1038/nature09324. doi:10.1038/nature09324. [DOI] [PMC free article] [PubMed] [Google Scholar]
- 9.Shida T, Cueva JG, Xu Z, Goodman MB, Nachury MV. The major alpha-tubulin K40 acetyltransferase alphaTAT1 promotes rapid ciliogenesis and efficient mechanosensation. Proc Natl Acad Sci U S A. 2010;107:21517–21522. doi: 10.1073/pnas.1013728107. doi:10.1073/pnas.1013728107. [DOI] [PMC free article] [PubMed] [Google Scholar]
- 10.Rappoport JZ, Simon SM. Real-time analysis of clathrin-mediated endocytosis during cell migration. J Cell Sci. 2003;116:847–855. doi: 10.1242/jcs.00289. [DOI] [PubMed] [Google Scholar]
- 11.Caswell PT, et al. Rab25 associates with alpha5beta1 integrin to promote invasive migration in 3D microenvironments. Developmental cell. 2007;13:496–510. doi: 10.1016/j.devcel.2007.08.012. doi:10.1016/j.devcel.2007.08.012. [DOI] [PubMed] [Google Scholar]
- 12.Howes MT, et al. Clathrin-independent carriers form a high capacity endocytic sorting system at the leading edge of migrating cells. J Cell Biol. 2010;190:675–691. doi: 10.1083/jcb.201002119. doi:10.1083/jcb.201002119. [DOI] [PMC free article] [PubMed] [Google Scholar]
- 13.Rappoport JZ, Taha BW, Simon SM. Movement of plasma-membrane-associated clathrin spots along the microtubule cytoskeleton. Traffic. 2003;4:460–467. doi: 10.1034/j.1600-0854.2003.00100.x. [DOI] [PubMed] [Google Scholar]
- 14.Gundersen GG. Microtubule capture: IQGAP and CLIP-170 expand the repertoire. Current biology : CB. 2002;12:R645–647. doi: 10.1016/s0960-9822(02)01156-9. [DOI] [PubMed] [Google Scholar]
- 15.Hinrichsen L, Harborth J, Andrees L, Weber K, Ungewickell EJ. Effect of clathrin heavy chain- and alpha-adaptin-specific small inhibitory RNAs on endocytic accessory proteins and receptor trafficking in HeLa cells. J Biol Chem. 2003;278:45160–45170. doi: 10.1074/jbc.M307290200. doi:10.1074/jbc.M307290200. [DOI] [PubMed] [Google Scholar]
- 16.Ferguson SM, et al. Coordinated actions of actin and BAR proteins upstream of dynamin at endocytic clathrin-coated pits. Developmental cell. 2009;17:811–822. doi: 10.1016/j.devcel.2009.11.005. doi:10.1016/j.devcel.2009.11.005. [DOI] [PMC free article] [PubMed] [Google Scholar]
- 17.Tanabe K, Takei K. Dynamic instability of microtubules requires dynamin 2 and is impaired in a Charcot-Marie-Tooth mutant. J Cell Biol. 2009;185:939–948. doi: 10.1083/jcb.200803153. doi:10.1083/jcb.200803153. [DOI] [PMC free article] [PubMed] [Google Scholar]
- 18.Collins BM, McCoy AJ, Kent HM, Evans PR, Owen DJ. Molecular architecture and functional model of the endocytic AP2 complex. Cell. 2002;109:523–535. doi: 10.1016/s0092-8674(02)00735-3. [DOI] [PubMed] [Google Scholar]
- 19.Bulinski JC, Richards JE, Piperno G. Posttranslational modifications of alpha tubulin: detyrosination and acetylation differentiate populations of interphase microtubules in cultured cells. J Cell Biol. 1988;106:1213–1220. doi: 10.1083/jcb.106.4.1213. [DOI] [PMC free article] [PubMed] [Google Scholar]
- 20.Chabin-Brion K, et al. The Golgi complex is a microtubule-organizing organelle. Mol Biol Cell. 2001;12:2047–2060. doi: 10.1091/mbc.12.7.2047. [DOI] [PMC free article] [PubMed] [Google Scholar]
- 21.Efimov A, et al. Asymmetric CLASP-dependent nucleation of noncentrosomal microtubules at the trans-Golgi network. Developmental cell. 2007;12:917–930. doi: 10.1016/j.devcel.2007.04.002. doi:10.1016/j.devcel.2007.04.002. [DOI] [PMC free article] [PubMed] [Google Scholar]
- 22.Gundersen GG, Bulinski JC. Selective stabilization of microtubules oriented toward the direction of cell migration. Proc Natl Acad Sci U S A. 1988;85:5946–5950. doi: 10.1073/pnas.85.16.5946. [DOI] [PMC free article] [PubMed] [Google Scholar]
- 23.Watanabe T, Noritake J, Kaibuchi K. Regulation of microtubules in cell migration. Trends in cell biology. 2005;15:76–83. doi: 10.1016/j.tcb.2004.12.006. doi:10.1016/j.tcb.2004.12.006. [DOI] [PubMed] [Google Scholar]
- 24.Ezratty EJ, Bertaux C, Marcantonio EE, Gundersen GG. Clathrin mediates integrin endocytosis for focal adhesion disassembly in migrating cells. J Cell Biol. 2009;187:733–747. doi: 10.1083/jcb.200904054. doi:10.1083/jcb.200904054. [DOI] [PMC free article] [PubMed] [Google Scholar]
- 25.Rowe RG, Weiss SJ. Breaching the basement membrane: who, when and how? Trends in cell biology. 2008;18:560–574. doi: 10.1016/j.tcb.2008.08.007. doi:10.1016/j.tcb.2008.08.007. [DOI] [PubMed] [Google Scholar]
- 26.Condeelis J, Pollard JW. Macrophages: obligate partners for tumor cell migration, invasion, and metastasis. Cell. 2006;124:263–266. doi: 10.1016/j.cell.2006.01.007. doi:10.1016/j.cell.2006.01.007. [DOI] [PubMed] [Google Scholar]
- 27.de Chaumont F, et al. Icy: an open bioimage informatics platform for extended reproducible research. Nature methods. 2012;9:690–696. doi: 10.1038/nmeth.2075. doi:10.1038/nmeth.2075. [DOI] [PubMed] [Google Scholar]
- 28.de Chaumont F, Dallongeville S, Olivo-Marin JC. ICY: a new open-source community image processing software. IEEE International Symposium on Biomedical Imaging. 2011 [Google Scholar]
- 29.Kaplan OI, et al. The AP-1 clathrin adaptor facilitates cilium formation and functions with RAB-8 in C. elegans ciliary membrane transport. J Cell Sci. 2010;123:3966–3977. doi: 10.1242/jcs.073908. doi:10.1242/jcs.073908. [DOI] [PMC free article] [PubMed] [Google Scholar]
- 30.Montagnac G, et al. Decoupling of activation and effector binding underlies ARF6 priming of fast endocytic recycling. Current biology : CB. 2011;21:574–579. doi: 10.1016/j.cub.2011.02.034. doi:10.1016/j.cub.2011.02.034. [DOI] [PubMed] [Google Scholar]
- 31.Campbell CH, Fine RE, Squicciarini J, Rome LH. Coated vesicles from rat liver and calf brain contain cryptic mannose 6-phosphate receptors. J Biol Chem. 1983;258:2628–2633. [PubMed] [Google Scholar]
- 32.Kelm JM, Timmins NE, Brown CJ, Fussenegger M, Nielsen LK. Method for generation of homogeneous multicellular tumor spheroids applicable to a wide variety of cell types. Biotechnology and bioengineering. 2003;83:173–180. doi: 10.1002/bit.10655. doi:10.1002/bit.10655. [DOI] [PubMed] [Google Scholar]
- 33.Elsdale T, Bard J. Collagen substrata for studies on cell behavior. J Cell Biol. 1972;54:626–637. doi: 10.1083/jcb.54.3.626. [DOI] [PMC free article] [PubMed] [Google Scholar]
- 34.Fuller D, et al. External and internal constraints on eukaryotic chemotaxis. Proc Natl Acad Sci U S A. 2010;107:9656–9659. doi: 10.1073/pnas.0911178107. doi:10.1073/pnas.0911178107. [DOI] [PMC free article] [PubMed] [Google Scholar]


