

Abstract
Evasion of clinical interventions by Streptococcus pneumoniae occurs through selection of non-susceptible genomic variants. Here we use genome sequencing of 3,085 pneumococcal carriage isolates from a 2.4 km2 refugee camp to enable unprecedented resolution of the process of recombination, and highlight its impact on population evolution. Genomic recombination hotspots show remarkable consistency between lineages, indicating common selective pressures acting at certain loci, particularly those associated with antibiotic resistance. Temporal changes in antibiotic consumption are reflected in changes in recombination trends demonstrating rapid spread of resistance when selective pressure is high. The highest frequencies of receipt and donation of recombined DNA fragments were observed in non-encapsulated lineages, implying that this largely overlooked pneumococcal group, which is beyond the reach of current vaccines, may play a major role in genetic exchange and adaptation of the species as a whole. These findings advance our understanding of pneumococcal population dynamics and provide important information for the design of future intervention strategies.
Streptococcus pneumoniae is a human-restricted nasopharyngeal commensal and respiratory pathogen with a major impact on global health, particularly that of infants in resource-poor settings 1. Pneumococcal carriage is regarded as a risk factor for the development of invasive and non-invasive diseases, and carriage rates tend to be higher in poorer countries 2. Treatment and prevention of pneumococcal diseases are becoming more challenging due to the acquisition of antibiotic resistance and vaccine escape genotypes 3-5. The frequent recombination observed in this species allows for rapid acquisition of genetic material with the potential for selective advantage 6.
Previous studies have noted the importance of recombination over single nucleotide substitution in the rapid evolution a multidrug resistance lineage4 and showed a correlation between recombination admixture and acquisition of antibiotic resistance7. Moreover, recombination has been captured during the course of a single chronic polyclonal infection8, demonstrating the interaction between lineages 9,10 and their co-evolution within the nasopharynx of humans. Though the data have been informative, they are confined by limited genotypic information7,11 or relatively sparse samplings4,5. Here we apply very dense sampling and full genomic analysis to analyse pneumococcal evolution and genetic interactions between lineages with unprecedented resolution.
A longitudinal pneumococcal carriage study was conducted in Maela, a rural refugee community located close to the border between Thailand and Myanmar where anti-pneumococcal vaccination has not yet been implemented. The study was performed between 2007-2010 on a cohort of almost a thousand infants and approximately one quarter of their mothers over a period of three years 12,13. Whole genome sequencing was performed on 3,085 isolates randomly selected from this cohort to include about 100 isolates from each consecutive month of the studied period.
Following sequencing and identification of single nucleotide polymorphisms (SNPs) (see Methods), we determined the Maela pneumococcal population structure by clustering the genomes based on sequence similarity using BAPS 14,15. The tool was applied in a hierarchical fashion to produce 33 primary clusters (BC) sub-divided into 183 secondary clusters (sBC) (Supplementary table 1). The secondary clusters are mostly clonal, often belonging to the same MLST clonal complex. Non-typeable (NT) pneumococci, those lacking genes for capsule biosynthesis, are the most prevalent capsule-phenotype group (Fig. 1), and are distributed across multiple lineages including one of the largest BAPS clusters (BC3-NT). Out of 512 isolates classified as NT, 42 appear to have a deletion of the capsule biosynthesis locus (cps) whilst the remainder harbor typical NT genes, as described in Supplementary table 2 16. We detected 191 plausible capsule switching events across the population, including 19 switches involving NT status: 9 events from encapsulated states to NT, 9 events from NT to encapsulated states and 1 event with an ambiguous direction, indicating that conversion between the encapsulated and non-encapsulated state is not uncommon and may be an important factor in population dynamics.
Figure 1. Population structure and genetic interactions.

(a) A single nucleotide polymorphism (SNP) based phylogeny of pneumococcal population with connections between recipients and potential donors of recombination fragments. From the outer ring: a neighbor-joining tree built using SNPs from the whole population. Branches colored in red are isolates classified as non-typeable. The next ring represents the population clusters based on secondary BAPS clustering. The seven most prevalent clusters are highlighted in different colors (in clock-wise order) - BC1-19F (deep blue), BC7-14 (yellow), BC6-15B/C (orange), BC3-NT (red), BC5-23A/F (blue-green), BC4-6B (pale green), and BC2-23F (green) with gradients linking these clusters to matched isolates on the phylogenetic tree. The centre shows connections between recombination recipients (from BC1-7 only; lines ending nearer the outside of the figure) and their potential donor clusters (lines ending nearer the centre). (b) Highly prevalent serotypes and their constituent population clusters by BAPS. The plot represents the ten most prevalent serotypes detected in the Maela population, each divided into separate population clusters based on secondary BAPS clustering – serotype (no. of clusters): non-typeable (NT) (30), 19F (9), 23F (11), 6B (18), 14 (6), 6A (14), 15B (4), 34 (7), 19A (3), 6C (4). Each cluster was shaded with different grey scales to represent each genetic background with the NT showing highest diversity.
The seven largest primary BAPS clusters (denoted BC1-7) were studied further to evaluate evolutionary parameters such as nucleotide substitution and recombination. Each cluster contained more than 100 samples, and totaled 1,216 genomes representing 39.4 % of the total dataset and several common serotypes BC1-19F, BC2-23F, BC3-NT, BC4-6B, BC5-23A/F, BC6-15B/C, BC7-14 (Fig. 1a). Sequence reads for each cluster were re-mapped against a closely related reference genome to allow increased sensitivity for detection. Mean estimated substitution rates fall within the range of 1.45 - 4.81 × 10⁻⁶ substitutions per site per year with overlapping 95% credibility intervals (Fig. 2a, Supplementary table 3) demonstrating no significant difference in rates between the seven lineages (Kruskal-Wallis test, p-value 0.98). It is possible that less prevalent lineages have significantly different substitution rates but those could not be reliably assessed with this density of sampling.
Figure 2. Evolutionary parameters estimated in dominant clusters.

(a) Mutation rates estimated using BEAST 42. The error bar corresponds to 95% credibility intervals. The dashed line represents the mutation rate estimated in previous pneumococcal study of 1.57×10⁻⁶ substitution per site per year 4 (95% confidence interval 1.34 to 1.79×10⁻⁶). (b) Recombination events per mutation (r/m) across investigated clusters quantified by 2 separate methods: linear regression on each branch of the appropriate phylogeny and the arithmetic mean of r/m on each branch. The error bars represent 95% confidence intervals. BC3-NT (highlighted in blue) has the highest r/m, with its sub-clusters NT and serotype 14 highlighted in red and green respectively.
We calculated the rate of recombination in each cluster as the ratio of homologous recombination events to number of mutations (r/m) thus avoiding any bias introduced by using number of recombinational polymorphic sites that can be affected by varying genetic distances between donor and recipient (Supplementary table 4). The ratio was found to be less than 1 in all studied clusters, indicating that recombination events occur less frequently than single nucleotide substitution. Unlike substitution rate, the r/m was found to be significantly different between clusters (Fig. 2b), highlighting different rates of recombination (Kruskal-Wallis test p-value = 1.24 ×10⁻⁸). This observation is consistent with Croucher et al 5 as well as other prior in vitro studies 17, suggesting the potential for a different speed of response to environmental changes within the population. The highest recombination rate was observed in a group dominated by non-typeable isolates (BC3-NT) (Mann Whitney test p-value = 1.76 × 10⁻⁵, ANCOVA test p-value = 0.0011) consistent with the idea that the capsule acts as a physical barrier to DNA uptake in natura. Cluster BC3-NT comprises both NT and serotype 14 isolates of the same genetic background, providing the opportunity to test the influence of capsule on the rate of recombination. The recombination rate is significantly higher in the NT isolates compared to those of serotype 14 in this cluster (Mann Whitney test p-value = 2.44 × 10⁻³) providing further evidence that encapsulation reduces recombination efficiency.
Although the level of recombination was observed to be different between clusters, the genomic loci where recombination events were identified were non-random and remarkably consistent between clusters. These hotspots were defined as sites with recombination frequency above the 95th percentile of recombination detected for the cluster as a whole (Fig. 3), thus accounting for recombination frequency, population size and diversity. Notably, the highly recombinogenic cluster BC3- NT contained the highest frequency hotspots, despite being third in terms of population size. The consistency in this pattern of hotspots across the species indicates that there are a limited number of genes where diversity accumulates as a consequence of recombination at a heightened rate relative to the rest of the genome. It is likely that host immunity and clinical practices are the selective pressures underlying this pattern. Indeed, the six most prominent hotspots in the Maela pneumococcal population are focused on genes encoding cell surface antigens (pspA, pspC) and genes associated with resistance to antibiotics (pbp1a, pbp2b, pbp2x, folA).
Figure 3. Recombination hotspots in seven prevalent clusters.
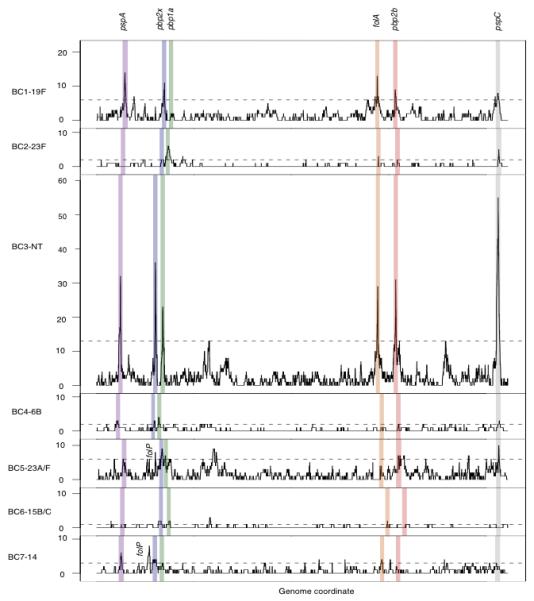
The panels (from top to bottom) are ordered based on the cluster population size. For each cluster, recombination hotspots were identified as sites with recombination frequency above the 95th percentile of homologous recombination detected in that cluster. The 95th percentile levels are indicated as horizontal dashed lines. Shaded in different colors are recombination hotspots detected in at least 4 out of 7 studied clusters. These common hotspots, based on their order on the genome, are pneumococcal surface protein A (pspA, purple), penicillin binding protein 2× (pbp2x, blue), penicillin binding protein 1a (pbp1a, green), dihydrofolate reductase (folA, orange), penicillin binding protein 2b (pbp2b, red), and pneumococcal surface protein C (pspC, grey). The figure includes 2,077 recombination events; the 132 events associated with mobile genetic elements are not displayed.
Having identified that recombination hotspots coincide with genes associated with antibiotic resistance, we sought to clarify further the relationships between recombination, antibiotic susceptibility and antibiotic consumption in the community.
β-lactam resistances are known to be conferred by allelic forms of the penicillin binding proteins: pbp1a, pbp2x and pbp2b 18. The phylogeny of these three concatenated genes from the whole population (n=3,085) (Fig. 4a) highlights two features: 1) admixture of alleles throughout the population, with those of BC3-NT the most widely distributed, and 2) an association between β-lactam non-susceptibility and long branches, which can be an indication of recombination. The same trend is observed for individual pbp gene trees (Supplementary Fig. 1). Furthermore, for the seven dominant clusters (1,216 genomes), isolates that have undergone recombination at either pbp1a, pbp2b and pbp2x are phenotypically more resistant than strains that have not (Table 1, Fisher’s exact test p-value < 2.20×10⁻¹⁶). This suggests that recombination has helped mediate the spread of β-lactam resistance within the population, which is consistent with the increase in β-lactam consumption in the Maela community since at least the early 1990s (Supplementary table 5). When stratified by time, recombination events at pbp genes on both past (internal) branches and recent (external) branches are associated with resistant phenotypes, implying a continuous selective pressure for β-lactam resistance.
Figure 4. Associations between recombining genes and resistant phenotypes.

(a) β-lactam resistance. The centre shows a SNP based phylogeny of concatenated pbp1a, pbp2b and pbp2x from 3,085 strains rooted on S. mitis. The inner ring is colored according to membership of the 7 dominant population clusters (BC1-7). The outer ring is coloured based on β-lactam resistance phenotypes (susceptible – white, non-susceptible – black). (b) Co-trimoxazole resistance. The centre shows SNP based phylogenies of folA and folP. The color scheme for the inner ring is the same as for the concatenated pbp genes, while the outer ring is colored according to co-trimoxazole resistance phenotype (sensitive – white, intermediate – grey, resistant – black)
Table 1. Associations between recombining strains, resistant phenotypes and temporal changes in recombining trends from 7 dominant clusters.
| Observed phenotypes | No recombination taking place at loci of interest | Recombination taking place at loci of interest | Recent recombination (external node) at loci of interest | Older recombination (internal node) at loci of interest |
|---|---|---|---|---|
| β-lactam resistance: resistant / sensitive (ratio) |
120/146* (0.82) |
795/150* (5.30) |
25/6 (4.17) |
770/144 (5.35) |
| Co-trimioxazole resistance: resistant / sensitive + intermediate (ratio) |
210/28 (7.50) |
873/100 (8.73) |
10/9** (1.11) |
863/91** (9.48) |
significant difference between β-lactam resistance phenotypes observed in strains with recombination at pbp genes and those without recombination (p-value < 2.2 × 10⁻¹⁶).
a significant difference in co-trimoxazole resistance phenotypes between recent recombination and older recombination at fol genes (p-value = 3.49 ×10⁻⁵).
Note that the difference is still significant when ratios are grouped by resistant + intermediate / sensitive (p-value = 0.00931).
Allelic forms of dihydrofolate reductase (folA) and dihydropteroate synthase (folP) are known to confer resistance to co-trimoxazole 19-21. Similar to the β-lactam phylogenies, a phylogeny of folA shows that the genes have been shuffled within the population with signals of recombination manifested as alternate short and long branches (Fig. 4b). However, this is not true for folP. Furthermore, there is no overall association between strains undergoing recombination at fol genes and co-trimoxazole resistance. This lack of association may be due to acquisition of resistance through base substitution or could be a distorted signal due to changes in selective pressure over time. Co-trimoxazole was recommended as a primary treatment for non-severe pneumonia in Maela from 1994 until 2002. However, due to increasing resistance across the region 22, its use has since been in decline, contrasting with the increasing trend in β-lactam consumption. Reflecting this, we observed a temporal change in recombination trend for co-trimoxazole resistance. Isolates that have undergone recent recombination (detected on external branches) are phenotypically less resistant than those with older recombination events (internal branches) (Table 1, Fisher exact test, p-value = 4.21×10⁻⁵), which is consistent with a reduction in selection pressure. Having shown two cases where recombination allowed the bacteria to respond to fluctuating selection pressure, we next asked which genotypes are the major source of recombinant DNA that might allow such adaptation.
The highly saturated sampling frame allowed the detection of the sources of recombinant DNA fragments (referred to as “donor blocks”) by searching the entire assembled genome dataset for identity with the detected recombined regions (referred to as “recipient blocks”) using strict detection criteria to reduce false positives (see supplementary note). Only recipient blocks uniquely detected in single isolates (at the tips of the phylogenetic tree) of BC1 to 7 were considered, thus restricting analysis to recent events where donor detection is less likely to be confounded by subsequent recombination or substitutions. Of the 928 unique recipient blocks identified in BC1-7, 443 were found to have identical matches (donor blocks) elsewhere in the dataset (Fig. 1a). When classified by secondary BAPS clusters (sBC), potential donor blocks were identified in single or multiple genetic backgrounds. For example, isolate SMRU1452 has nine recipient blocks with identical hits detected in eight different clusters, each with a different serotype (Supplementary Fig. 2, Supplementary table 6). Eight out of the nine recipient blocks were detected in one out of eight clusters (sBC145-152, serotype 6B), while the remaining fragment was detected in a second cluster (sBC140-143, serotype NT). Taken together, these observations suggest that the recent ancestor of isolate SMRU1452 has recombined with members of sBC145-152-6B and sBC140-143-NT, resulting in the import of eight and one DNA region of diversity, respectively.
Mapping all such interactions across the wider population allows us to ask whether or not there is heterogeneity in the donation frequency between each cluster within the population. Based on primary BAPS clusters, there is a higher probability of NT isolates being the donor than the rest of the population (Supplementary Fig. 3a: Mann Whitney U test between NTs and other clusters, p-value < 2.2×10⁻¹⁶). However, this result should be interpreted with caution, as NTs are known to be efficient recombination recipients and thus the results here may be confounded by NTs being co-recipients as well as recombination donors. This is consistent with the positive correlations observed between the cluster population size, and separately, the cluster diversity, with the probability of becoming a potential donor (Supplementary Fig. 3b and 3c: Spearman’s rank correlation rho = 0.592 and 0.773, p-value = 2.69×10⁻⁴ and 1.45×10⁻⁶). The clusters of NT isolates demonstrate both these characteristics, large population size and high diversity, and correspondingly were identified as having a large number of potential donors.
In summary, lineage-specific rates of recombination, both for donation and receipt of DNA, suggest a structure to the genetic flux within this population where specific lineages function as hubs of gene flow. The most frequently exchanged genes are those associated with antibiotic resistance and immune interaction, with trends in the former sensitive to the level of antibiotic consumption. Together, this implies that within the population there are differential rates of response to environmental selection pressure between lineages and further, that geographically or temporally distinct pneumococcal populations have different capacities for adaptation. High rates of receipt and donation of recombinant DNA observed in NT pneumococci make them a potential major reservoir of genetic diversity for the wider population. Although increased recombination rate could bring transient benefit, there are potential long-term disadvantages due to increasing genomic instability. It is therefore notable that we observe sporadic switching between the NT and encapsulated states, which may serve as a mechanism to modulate the trade-off between benefit and cost of recombination rates. As NT pneumococci are rarely associated with disease, they are excluded from the targets of currently available polysaccharide vaccines and will therefore act as a reservoir for antibiotic resistance determinants.
Methods
Sample collection
Nasopharyngeal swabs in this study were collected between November 2007-November 2010 from 528 infants over the first 24 months of life, as well as from 242 mothers. The swabs, also part of the study described in 12,13, were collected and processed according to WHO pneumococcal carriage detection protocols 23. All isolates were serotyped and then tested for antibiotic susceptibilities (Supplementary note). A smaller collection of 3,085 single-colony isolates was randomly selected for whole genome sequencing in such a way that about 100 isolates were recovered from each consecutive month of the study period, except the start and end of the sampling period where the number of isolates are lower. DNA extraction for each isolate was performed using a RBC Bioscience MagCore HF16 platform. Our collection is tabulated in Supplementary table 1.
Whole genome sequencing
All processing and sequencing of genomic DNA was performed by the Wellcome Trust Sanger Institute’s core sequencing teams. All samples were sequenced as multiplexed libraries using the Illumina HiSeq 2000 analyzers on 75bp paired end runs as described in 4 giving a mean coverage of 276.67 reads per nucleotide. Multi-locus sequence type and serotype, for both capsulated and non-encapsulated isolates, were determined directly from the sequence and compared to previous experimentally determined typing information in order to verify sample identities (Supplementary note, Supplementary table 2).
Sequence assembly
Genomes for 3,085 strains were de novo assembled using in iterative process involving Velvet 24, SSPACE 25, GapFiller 26, BWA 27 and Bowtie 28 (Supplementary note). A final QC step was performed on each assembly, with the reads mapped back to the assembly using SMALT 0.5.7. The assembly pipeline gave on average a total length of 2,161,240 bp from 111-279 contigs with average contig length of 33,191 bp and average N50 of 65,656 bp
Mapping
To estimate the whole population structure, reads from all 3,085 samples were mapped onto a single reference genome, S. pneumoniae ATCC700669 [EMBL accession code FM211187] 29 using SMALT 0.5.7 to generate a coarse but sufficient alignment for determining the population structure. The 2,221,315 bp reference gave on average 82.33 percent mapping coverage. Bases were called using the method described in 30. To improve the resolution for a deeper analysis, closely related references were employed for finer mapping in 7 dominant clusters. Public references as well as draft references generated from this data (Supplementary note, Supplementary table 7) were used for mapping as described previously. The final alignment for deeper analysis included indels using the method described in 30.
Estimating population structure by clustering and approximate phylogeny
Based on the coarse mapping against the core genome of S. pneumoniae ATCC 700669, the BAPS software v6.0 15,31-33 was used to estimate the population structure (for application 7,34-36). As described in 14,37, we used BAPS in a hierarchical manner to resolve the population structure at a fine level of detail (Supplementary note). Also, an approximately-maximum likelihood phylogenetic tree was estimated by FastTree 38 using a GTR model with CAT approximation for site rate variation. With 1,000 resamples, 80.6% and 32.6 % of the branches have over 0.700 and 1.000 bootstrap supports respectively.
Estimating evolutionary parameters
Rates of single nucleotide substitution as well as recombination were determined for each of the seven dominant clusters (Supplementary figure 4a - 4g, supplementary note). Recombination SNPs were separated from mutation SNPs using the methods described previously 4. For mutation rates, there was difficulty in correlating the overall accumulation of mutation SNPs through time from the whole cluster due to narrow sampling time frame (Supplementary figure 5). Therefore the correlations were performed within subclades of dominant clusters instead of using each whole cluster to capture signals (Supplementary figure 6, Supplementary note). The mutation rates were calculated with BEAST 39 using the skyline population size prior and a relaxed lognormal clock model (tabulated in Supplementary table 3). Comparison of nucleotide substitution rate between different clusters was conducted using the Kruskal-Wallis test.
Rates of homologous recombination (r/m) were calculated given numbers of recombination events and number of single polymorphic sites produced by the algorithm described in 4, excluding any signals localised in the regions of mobile genetic elements. Note that this is different to r/m calulation as originally used in 40 to avoid a bias introduced by the genetic distance between the recombination donors and recipients (Supplementary note). We calculated r/m using two different approaches. The first approach is by modeling the relationship between recombination events and mutations as a linear regression (Supplementary figure 7), using the ranked recombination events as the outcome, and ranked number of SNPs as the predictor variable. The slope represents r/m (Supplementary table 4). We used ANCOVA test to determine the significant difference in recombination rates between clusters when the statistical assumptions are met. The second approach is by using the arithmetic mean of r/m of a cluster, averaged from the r/m of each branch within a cluster. The mean of the distribution of the r/m for the cluster was reported in Supplementary table 4. The Kruskal-Wallis test was used to test for differences in r/m between clusters calculated by arithmetic mean.
Recombination hotspots and associations of some hotspots with temporal changes in antibiotic consumption
Hotspots are defined as the genome location where recombination events have occurred at higher frequency. Here we used the 95th percentile of each cluster’s own population site frequencies as a cut-off. Recombination events observed in major lineages, number of excluded events due to mobile genetic elements and number of events associated with hotspots were summarized in Supplementary table 8. To investigate the level of admixture of each hotspot gene, pbp1a, pbp2b, pbp2x, folA and folP, phylogenies of individual gene trees (Supplementary figure 1a to 1c, Figure 4b), as well as concatenated phylogenetic tree (Figure 4a) were constructed with RAxML v7.0.4 41 using a GTR model with a gamma correction for site rate variation using 100 bootstraps.
The trend of recombination was estimated through the detected phenotypes observed in the presence and absence of recombination in the sub-population including 7 most prevalent clusters. Note that 5 isolates with missing phenotypes (Supplementary table 1) were not included in this analysis. Based on the prediction of recombination from 7 dominant clusters, strains undergoing recombination at pbp1a, pbp2b, pbp2x, folA or folP and their phenotypic resistance to β-lactam and co-trimoxazole were compared against the strains with no recombination events observed at these sites (Supplementary table 9). The statistical significance of differences between the recombining group and the non-recombining group was estimated with two - tailed Fisher’s exact test. Alternative murM and murN genes associated with high β-lactam resistance 42 were also considered. However, only two candidates with partial matches were observed and are thus less likely to explain trends in β-lactam resistance.
Temporal trends in recombination were determined by comparing the phenotype difference between strains showing evidence of recent recombination (recombination events predicted at the external branches) to strains whose ancestors had undergone recombination (recombination events predicted at the internal nodes). Using a two - tailed Fisher’s exact test, statistical difference between these groups was estimated.
Trends in antibiotic consumption obtained from recommended treatments are tabulated in Supplementary table 5.
Searching for potential recombination donors given recipient blocks
Based on the sequence identity of recombination fragments detected in recipient strains, potential donors from the rest of population were assessed. The number of recipient blocks used for this analysis is summarized in Supplementary table 8. As described further in Supplementary note and Supplementary figure 8-9, several criteria were applied to maximize detection specificity and reduce false positives. Probabilities of a single isolate, as well as each BAPS cluster acting as a donor for a recipient were then calculated. Further, we evaluated relationships between cluster size, cluster diversity and probability of being a donor. Based on the Spearman ranking correlation, the association between both features and the probability of becoming donors were estimated.
Visualization of phylogenetic trees
Display and manipulation of phylogenetic trees was performed using the online tool Interactive Tree of Life 43 and the software package circos 44
Statistical tests
All statistical tests as well as figures were made in R version 2.11.1. Statistical analyses were discussed in individual sections.
Supplementary Material
Contains Supplementary Figures 1-9, Supplementary Tables 2-9, Supplementary Note and Supplementary References
Acknowledgements
We thank the microbiology and clinical team at Shoklo Malaria Research Unit, part of the Mahidol Oxford University Research Unit, Faculty of Tropical Medicine, Mahidol University, Thailand; and the core informatics, library-making, and sequencing teams at the Wellcome Trust Sanger Institute. Attending authors are grateful for the opportunity for discussion at the Permafrost workshop. CC was funded by the Royal Thai Government scholarship and the Wellcome Trust PhD studentship. JC, PM, AP, LC were funded by the Academy of Finland grant no 251170 and ERC grant no. 239784. SDB is partly funded by NIHR Cambridge BRC. PT was funded by the Wellcome Trust grant no 083735/Z/07Z. This work is sponsored by The Wellcome Trust Grant 098051
Footnotes
URLs: Assemblies generated in this study can be accessed at (ftp://ftp.sanger.ac.uk/pub/pathogens/Streptococcus/pneumoniae/Maela_assemblies.tgz). Software can be found at: SMALT (http://www.sanger.ac.uk/resources/software/smalt); Path-O-Gen (http://tree.bio.ed.ac.uk/software/pathogen)
Accession codes: Sequencing reads for all 3,085 isolates have been deposited in the NCBI Sequencing Read Archive (SRA) under study ERP000435, ERP000483, ERP000485, ERP000487, ERP000598, ERP000599. A full list is provided in Supplementary table 1.
Competing financial interests: The authors declare no competing financial interests.
References
- 1.O’Brien KL, Nohynek H. Report from a WHO Working Group: standard method for detecting upper respiratory carriage of Streptococcus pneumoniae. The Pediatric infectious disease journal. 2003;22:e1–11. doi: 10.1097/01.inf.0000049347.42983.77. [DOI] [PubMed] [Google Scholar]
- 2.Adetifa IM, et al. Pre-vaccination nasopharyngeal pneumococcal carriage in a Nigerian population: epidemiology and population biology. PloS one. 2012;7:e30548. doi: 10.1371/journal.pone.0030548. [DOI] [PMC free article] [PubMed] [Google Scholar]
- 3.Hanage WP, et al. Evidence that pneumococcal serotype replacement in Massachusetts following conjugate vaccination is now complete. Epidemics. 2010;2:80–4. doi: 10.1016/j.epidem.2010.03.005. [DOI] [PMC free article] [PubMed] [Google Scholar]
- 4.Croucher NJ, et al. Rapid pneumococcal evolution in response to clinical interventions. Science. 2011;331:430–4. doi: 10.1126/science.1198545. [DOI] [PMC free article] [PubMed] [Google Scholar]
- 5.Croucher NJ, et al. Population genomics of post-vaccine changes in pneumococcal epidemiology. Nature genetics. 2013;45:656–63. doi: 10.1038/ng.2625. [DOI] [PMC free article] [PubMed] [Google Scholar]
- 6.Steinmoen H, Knutsen E, Havarstein LS. Induction of natural competence in Streptococcus pneumoniae triggers lysis and DNA release from a subfraction of the cell population. Proceedings of the National Academy of Sciences of the United States of America. 2002;99:7681–6. doi: 10.1073/pnas.112464599. [DOI] [PMC free article] [PubMed] [Google Scholar]
- 7.Hanage WP, Fraser C, Tang J, Connor TR, Corander J. Hyper-recombination, diversity, and antibiotic resistance in pneumococcus. Science. 2009;324:1454–7. doi: 10.1126/science.1171908. [DOI] [PubMed] [Google Scholar]
- 8.Hiller NL, et al. Generation of genic diversity among Streptococcus pneumoniae strains via horizontal gene transfer during a chronic polyclonal pediatric infection. PLoS pathogens. 2010;6:e1001108. doi: 10.1371/journal.ppat.1001108. [DOI] [PMC free article] [PubMed] [Google Scholar]
- 9.Eldholm V, Johnsborg O, Haugen K, Ohnstad HS, Havarstein LS. Fratricide in Streptococcus pneumoniae: contributions and role of the cell wall hydrolases CbpD, LytA and LytC. Microbiology. 2009;155:2223–34. doi: 10.1099/mic.0.026328-0. [DOI] [PubMed] [Google Scholar]
- 10.Wei H, Havarstein LS. Fratricide is essential for efficient gene transfer between pneumococci in biofilms. Applied and environmental microbiology. 2012;78:5897–905. doi: 10.1128/AEM.01343-12. [DOI] [PMC free article] [PubMed] [Google Scholar]
- 11.Donkor ES, et al. High levels of recombination among Streptococcus pneumoniae isolates from the Gambia. mBio. 2011;2:e00040-11. doi: 10.1128/mBio.00040-11. [DOI] [PMC free article] [PubMed] [Google Scholar]
- 12.Turner P, et al. A longitudinal study of Streptococcus pneumoniae carriage in a cohort of infants and their mothers on the Thailand-Myanmar border. PloS one. 2012;7:e38271. doi: 10.1371/journal.pone.0038271. [DOI] [PMC free article] [PubMed] [Google Scholar]
- 13.Turner C, et al. High rates of pneumonia in children under two years of age in a South East Asian refugee population. PloS one. 2013;8:e54026. doi: 10.1371/journal.pone.0054026. [DOI] [PMC free article] [PubMed] [Google Scholar]
- 14.Cheng L, Connor TR, Siren J, Aanensen DM, Corander J. Hierarchical and Spatially Explicit Clustering of DNA Sequences with BAPS Software. Molecular biology and evolution. 2013;30:1224–8. doi: 10.1093/molbev/mst028. [DOI] [PMC free article] [PubMed] [Google Scholar]
- 15.Corander J, Marttinen P, Siren J, Tang J. Enhanced Bayesian modelling in BAPS software for learning genetic structures of populations. BMC bioinformatics. 2008;9:539. doi: 10.1186/1471-2105-9-539. [DOI] [PMC free article] [PubMed] [Google Scholar]
- 16.Salter SJ, et al. Variation at the capsule locus, cps, of mistyped and non-typable Streptococcus pneumoniae isolates. Microbiology. 2012;158:1560–9. doi: 10.1099/mic.0.056580-0. [DOI] [PMC free article] [PubMed] [Google Scholar]
- 17.Hsieh YC, et al. Serotype competence and penicillin resistance in Streptococcus pneumoniae. Emerging infectious diseases. 2006;12:1709–14. doi: 10.3201/eid1211.060414. [DOI] [PMC free article] [PubMed] [Google Scholar]
- 18.Zapun A, Contreras-Martel C, Vernet T. Penicillin-binding proteins and beta-lactam resistance. FEMS microbiology reviews. 2008;32:361–85. doi: 10.1111/j.1574-6976.2007.00095.x. [DOI] [PubMed] [Google Scholar]
- 19.Adrian PV, Klugman KP. Mutations in the dihydrofolate reductase gene of trimethoprim-resistant isolates of Streptococcus pneumoniae. Antimicrobial agents and chemotherapy. 1997;41:2406–13. doi: 10.1128/aac.41.11.2406. [DOI] [PMC free article] [PubMed] [Google Scholar]
- 20.Padayachee T, Klugman KP. Novel expansions of the gene encoding dihydropteroate synthase in trimethoprim-sulfamethoxazole-resistant Streptococcus pneumoniae. Antimicrobial agents and chemotherapy. 1999;43:2225–30. doi: 10.1128/aac.43.9.2225. [DOI] [PMC free article] [PubMed] [Google Scholar]
- 21.Silver LL. Multi-targeting by monotherapeutic antibacterials. Nature reviews. Drug discovery. 2007;6:41–55. doi: 10.1038/nrd2202. [DOI] [PubMed] [Google Scholar]
- 22.Hoge CW, Gambel JM, Srijan A, Pitarangsi C, Echeverria P. Trends in antibiotic resistance among diarrheal pathogens isolated in Thailand over 15 years. Clinical infectious diseases. 1998;26:341–5. doi: 10.1086/516303. [DOI] [PubMed] [Google Scholar]
- 23.O’Brien KL, Nohynek H. Report from a WHO working group: standard method for detecting upper respiratory carriage of Streptococcus pneumoniae. The Pediatric infectious disease journal. 2003;22:133–40. doi: 10.1097/01.inf.0000048676.93549.d1. [DOI] [PubMed] [Google Scholar]
- 24.Zerbino DR, Birney E. Velvet: algorithms for de novo short read assembly using de Bruijn graphs. Genome research. 2008;18:821–9. doi: 10.1101/gr.074492.107. [DOI] [PMC free article] [PubMed] [Google Scholar]
- 25.Boetzer M, Henkel CV, Jansen HJ, Butler D, Pirovano W. Scaffolding pre-assembled contigs using SSPACE. Bioinformatics. 2011;27:578–9. doi: 10.1093/bioinformatics/btq683. [DOI] [PubMed] [Google Scholar]
- 26.Boetzer M, Pirovano W. Toward almost closed genomes with GapFiller. Genome biology. 2012;13:R56. doi: 10.1186/gb-2012-13-6-r56. [DOI] [PMC free article] [PubMed] [Google Scholar]
- 27.Li H, Durbin R. Fast and accurate short read alignment with Burrows-Wheeler transform. Bioinformatics. 2009;25:1754–60. doi: 10.1093/bioinformatics/btp324. [DOI] [PMC free article] [PubMed] [Google Scholar]
- 28.Langmead B, Trapnell C, Pop M, Salzberg SL. Ultrafast and memory-efficient alignment of short DNA sequences to the human genome. Genome biology. 2009;10:R25. doi: 10.1186/gb-2009-10-3-r25. [DOI] [PMC free article] [PubMed] [Google Scholar]
- 29.Croucher NJ, et al. Role of conjugative elements in the evolution of the multidrug-resistant pandemic clone Streptococcus pneumoniaeSpain23F ST81. Journal of bacteriology. 2009;191:1480–9. doi: 10.1128/JB.01343-08. [DOI] [PMC free article] [PubMed] [Google Scholar]
- 30.Harris SR, et al. Evolution of MRSA during hospital transmission and intercontinental spread. Science. 2010;327:469–74. doi: 10.1126/science.1182395. [DOI] [PMC free article] [PubMed] [Google Scholar]
- 31.Corander J, Waldmann P, Sillanpaa MJ. Bayesian analysis of genetic differentiation between populations. Genetics. 2003;163:367–74. doi: 10.1093/genetics/163.1.367. [DOI] [PMC free article] [PubMed] [Google Scholar]
- 32.Corander J, Tang J. Bayesian analysis of population structure based on linked molecular information. Mathematical biosciences. 2007;205:19–31. doi: 10.1016/j.mbs.2006.09.015. [DOI] [PubMed] [Google Scholar]
- 33.Tang J, Hanage WP, Fraser C, Corander J. Identifying currents in the gene pool for bacterial populations using an integrative approach. PLoS computational biology. 2009;5:e1000455. doi: 10.1371/journal.pcbi.1000455. [DOI] [PMC free article] [PubMed] [Google Scholar]
- 34.Corander J, Connor TR, O’Dwyer CA, Kroll JS, Hanage WP. Population structure in the Neisseria, and the biological significance of fuzzy species. Journal of the Royal Society, Interface / the Royal Society. 2011 doi: 10.1098/rsif.2011.0601. [DOI] [PMC free article] [PubMed] [Google Scholar]
- 35.Mutreja A, et al. Evidence for several waves of global transmission in the seventh cholera pandemic. Nature. 2011;477:462–5. doi: 10.1038/nature10392. [DOI] [PMC free article] [PubMed] [Google Scholar]
- 36.Cheng L, Connor TR, Siren J, Aanensen DM, Corander J. Hierarchical and spatially explicit clustering of DNA sequences with BAPS software. Molecular biology and evolution. 2013 doi: 10.1093/molbev/mst028. [DOI] [PMC free article] [PubMed] [Google Scholar]
- 37.Willems RJ, et al. Restricted gene flow among hospital subpopulations of Enterococcus faecium. mBio. 2012;3:e00151–12. doi: 10.1128/mBio.00151-12. [DOI] [PMC free article] [PubMed] [Google Scholar]
- 38.Price MN, Dehal PS, Arkin AP. FastTree 2--approximately maximum-likelihood trees for large alignments. PloS one. 2010;5:e9490. doi: 10.1371/journal.pone.0009490. [DOI] [PMC free article] [PubMed] [Google Scholar]
- 39.Drummond AJ, Rambaut A. BEAST: Bayesian evolutionary analysis by sampling trees. BMC evolutionary biology. 2007;7:214. doi: 10.1186/1471-2148-7-214. [DOI] [PMC free article] [PubMed] [Google Scholar]
- 40.Feil EJ, Maiden MC, Achtman M, Spratt BG. The relative contributions of recombination and mutation to the divergence of clones of Neisseria meningitidis. Molecular biology and evolution. 1999;16:1496–502. doi: 10.1093/oxfordjournals.molbev.a026061. [DOI] [PubMed] [Google Scholar]
- 41.Stamatakis A. RAxML-VI-HPC: maximum likelihood-based phylogenetic analyses with thousands of taxa and mixed models. Bioinformatics. 2006;22:2688–90. doi: 10.1093/bioinformatics/btl446. [DOI] [PubMed] [Google Scholar]
- 42.Smith AM, Klugman KP. Alterations in MurM, a cell wall muropeptide branching enzyme, increase high-level penicillin and cephalosporin resistance in Streptococcus pneumoniae. Antimicrobial agents and chemotherapy. 2001;45:2393–6. doi: 10.1128/AAC.45.8.2393-2396.2001. [DOI] [PMC free article] [PubMed] [Google Scholar]
- 43.Letunic I, Bork P. Interactive Tree Of Life v2: online annotation and display of phylogenetic trees made easy. Nucleic acids research. 2011;39:W475–8. doi: 10.1093/nar/gkr201. [DOI] [PMC free article] [PubMed] [Google Scholar]
- 44.Krzywinski M, et al. Circos: an information aesthetic for comparative genomics. Genome research. 2009;19:1639–45. doi: 10.1101/gr.092759.109. [DOI] [PMC free article] [PubMed] [Google Scholar]
Associated Data
This section collects any data citations, data availability statements, or supplementary materials included in this article.
Supplementary Materials
Contains Supplementary Figures 1-9, Supplementary Tables 2-9, Supplementary Note and Supplementary References