Abstract
Background:
The superiority of dentofacial structures as scientific identifiers, particularly in mass disasters is well known. Special techniques like rugoscopy are valuable not only in identification of skeletal remains but can also facilitate population differentiation, as few studies have shown.
Aim:
The present study is to classify and compare the differences in rugae shape in populations of Andhra Pradesh and Odisha and to evaluate the discriminatory ability of rugae shape in population differentiation.
Materials and Methods:
One hundred maxillary casts from each group, equally divided between the sexes and in a narrow age range, were classified as per rugae shapes. The incidence of rugae shape was recorded and their association with ethnicity was tested using Chi-square analysis and step wise discriminant function analysis. All analysis was undertaken using SPSS 16.0 (SPSS Inc., Chicago, Illinois, USA) and MS Excel Package.
Results:
Straight and nonspecific rugae were most prevalent in Andhra Pradesh, whereas the wavy forms and unifications prevailed in Odisha. A hitherto unknown nonspecific “plaque pattern” was detected in considerable numbers in Andhra Pradesh population. The accuracy of the discriminant function analysis in differentiating the study populations was 93.5%.
Conclusion:
Significant differences in rugae shape between the two populations emerged that also allowed a fair differentiation, thus validating previous reports of a good discriminatory ability of rugae shapes. Perhaps, more studies in genetically diverse populations as in India could also unearth new rugae patterns and further the identification process.
Keywords: Discriminant function analysis, forensic odontology, population differentiation, rugae shape
Introduction
Identification of humans is a prime requisite for certification of death and for personal, social, legal and humanitarian reasons.[1] Currently, dental identification represents the most useful of scientific methods in mass disasters, its success rate having risen to approximately 75%.[2] The question of determining a population assumes importance particularly in mass disasters when fatalities occur simultaneously involving person/persons of different races/nationalities/ethnicities and so on.[1] However, comparative dental identification at times is not feasible as the circumstantial evidence may not give indication about identity and dental data may not be traceable.[3] Racial profiling using intra oral features other than teeth may have particular relevance in odontostomatological identification in India, where credible dental anthropological data is negligible.[4] One distinctive entity among the many intra oral features, are the palatal rugae that are known to be stable and unique to an individual and are well protected from trauma and insulated from heat and thus survive postmortem insults.[5,6] Thus, rugoscopy is considered a viable alternative in forensic identification, if availability of ante-mortem data is made possible. In addition, rugae patterns may be specific to ethnic groups facilitating population differentiation.[4,7,8,9,10,11,12,13] Differences in rugae patterns have been found in relatively similar groups.[4,10,11,12] Palatal rugae can be classified and studied based on their length, shape, direction and unification. However, for population differentiation, discrete variables like rugae shape are better suited than continuous variables like rugae length.[4] In view of the very few existing studies employing rugoscopy and more so among the population groups in India, the present study was undertaken with an aim to study, classify and compare the differences in the shape of palatal rugae in two heterogenous ethnic and linguistic populations of India and to analyze its role in population identification.
Materials and Methods
The study group comprised of 100 subjects, selected from each population group, all within a narrow age range of 18-23 years, equally divided between males and females. The study was carried out in two representative regions of each states–namely, Bhubaneswar (Odisha) and Nellore (Andhra Pradesh). Informed consent was obtained from all the participants. The inclusion criteria for subject selection were a family history, confirmed up to three generations that proved the ethnic, linguistic, and geographical affiliation to the respective region and a fully erupted permanent dentition (all 14 permanent teeth, excepting the third molars) in the maxillary arch. The exclusion criteria included subjects with a history of trauma/surgery or any palatal pathology in the anterior palatal region/past or current orthodontic treatment/extracted upper permanent teeth or extreme finger sucking in childhood. Screening of subjects was done by the questionnaire method, which was followed by intra oral examination. Dental casts were made of Type III dental stone (Gypston, Prevest Denpro Ltd) and after obtaining an impression using alginate impression material (Zelgan 2002; Dentsply India pvt. Ltd). The rugae pattern of individual casts were analyzed and each ruga was delineated [Figure 1] and classified using a new and simplified scheme proposed by Nayak et al., based on rugae shape, whereby rugae are classified as either straight, curved, wavy, annular, unification, or nonspecific [Figure 2], the last category denoting hitherto undescribed patterns, if any.[4] The various statistical tests applied in the study included Chi-square test, which was used to determine the association between rugae shape and ethnicity, while step wise discriminant function analysis was used to evaluate the efficacy of rugae shape in population identification. Both were undertaken using SPSS version 16.0 (SPSS Inc., Chicago, Illinois, U.S.A.) and MS Excel package.
Figure 1.
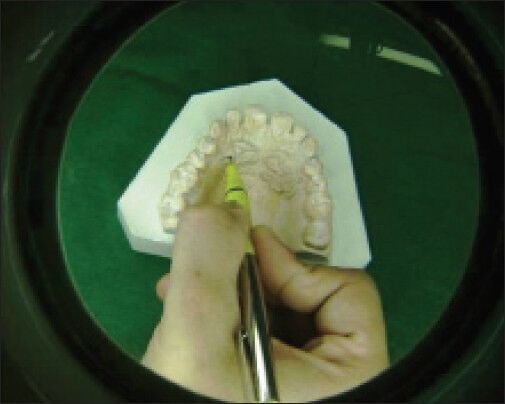
Depicts delineation of rugae
Figure 2.
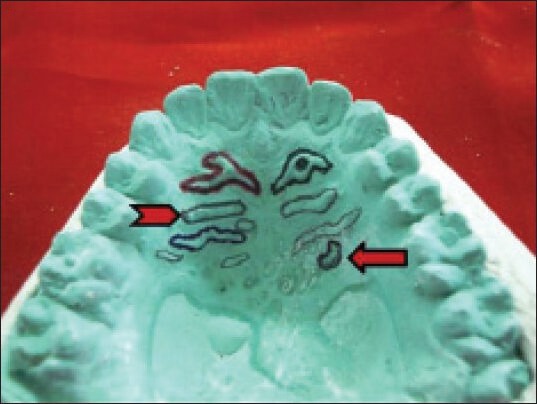
A cast from the sample depicting most of the rugae shapes marked as follows: Unification (red), annular (green), wavy (blue), curved (arrow), and straight (chevron)
The discriminant function's original accuracy once obtained was further subjected to Cross Validation/Jack Knifing, whereby, a function is derived from all but one cast in the sample and the excluded cast tested for population origin. Thus cross validation gave a more realistic indication of the precision of the discriminant function.
Results
A total of 1697 rugae were analysed. The prevalence of different rugae shapes in each population was derived [Table 1]. Chi-square (χ2) analysis showed no significant intra observer variation for different rugae shapes (P ≥ 0.05). A new nonspecific rugae pattern was observed in considerable numbers in Andhra Pradesh population, which was termed as the “plaque pattern” with some individuals possessing up to two such patterns, each [Figure 3].
Table 1.
Prevalence of different rugae shapes in populations of Odisha and Andhra Pradesh

Figure 3.
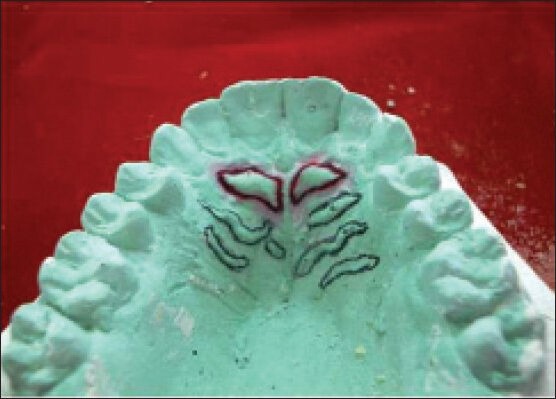
Nonspecific rugae of “plaque pattern” (in red) as noted in Andhra Pradesh population
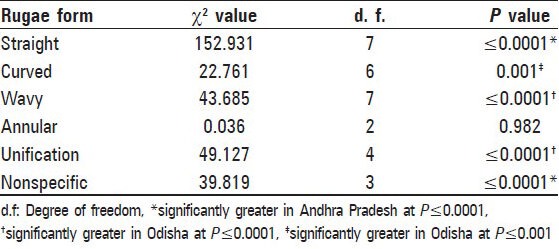
Chi-square analysis for assessing the association between rugae shape and ethnicity showed that straight rugae and nonspecific rugae were more in Andhra Pradesh at (P ≤ 0.0001) whereas, wavy, unifications, and curved rugae were more in Odisha [Figure 4] at (P ≤ 0.0001) and (P ≤ 0.001), respectively [Table 2].
Figure 4.
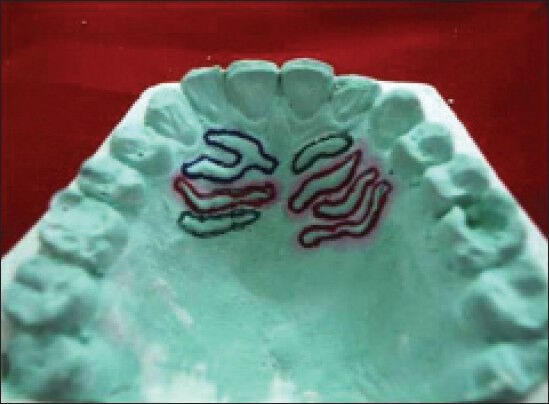
A cast from Odisha population depicting four wavy rugae, one unification and two curved rugae
Table 2.
Chi-square analysis for assessing differences in rugae shapes between Odisha and Andhra Pradesh
The rugae shapes that contributed to step-wise discriminant function analysis are given in [Table 3]. Straight rugae entered the analysis first, followed by wavy, unifications, and curved rugae. Nonspecific and annular rugae did not contribute to the function. The unstandardized and standardized coefficients, structure matrix, group centroids, and sectioning point for the discriminant function are depicted in Table 4. To determine the population group to which an unidentified individual belongs to, the number of each type of rugae shape is multiplied with the respective unstandardised coefficient and added to the constant. If the value obtained is greater than the sectioning point, the individual is considered to belong to Odisha; if the value obtained is less than the sectioning point, the individual is considered to belong to Andhra Pradesh.
Table 3.
Step-wise discriminant function analysis of different rugae shapes for population identification
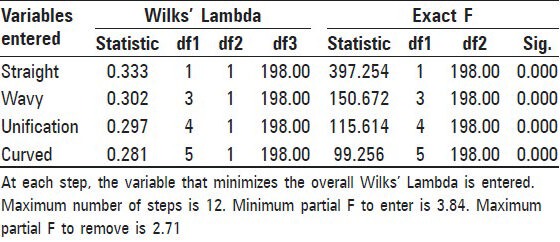
Table 4.
Discriminant function coefficients for rugae shapes that entered the analysis

Therefore, Odisha subject > Numerical cut off > Andhra Pradesh subject.
Consequently, considering a hypothetical case, involving an unidentified individual or recovery of a palatal specimen belonging to an individual from the forensic scenario, where the number of straight rugae = 3, curved rugae = 2, wavy rugae = 3, and unifications = 2. Multiplying the number of each rugae shape with the respective unstandardised coefficients and adding the constant, we obtain:
3 × (−0.760) + 2 × (0.305) + 3 × (0.392) + 2 × (0.466) + (−0.662) = −0.224.
Since the value is less than the secwtioning point, the individual/specimen is considered to belong to Andhra Pradesh.
The discriminant function's accuracy in population identification is presented in [Table 5]. The original accuracy obtained was 94%, whereas after cross validation, the accuracy reduced to 93.5%.
Table 5.
Population identification accuracy of the discriminant function

Discussion
Total individuality, relative stability and uniqueness of palatal rugae have been ascertained by many studies and case reports, thus qualifying them as scientific identifiers.[6,15] Apart from their role in personal identification, ethnic, and inter racial differences in palatoscopy have been established.[4,7,8,9,10,11,12,13] India is a country endowed with genetic complexity that does not always correlate to ethnicity, geography, or language. In addition, sub structuring exists in some populations like that of southern India, reflective of their genetic isolation. Therefore, instead of broad grouping of populations as done in a previous study, differentiating small, well defined, clusters of populations is more meaningful in creating forensic database in India. Thus, the present study was taken up in view of the limited existing studies on rugae patterns in Indian populations, with an aim to study and compare the shape of palatal rugae in two well-defined, geographically close, and genetically divergent populations of India.
Although, some studies have opined that aging, diseases, chemical aggression, trauma, habits, changes due to orthodontic treatment, extraction, palatal expansion do not modify rugae enough, (the rugae shape in particular) to hamper identification, the above factors were considered in the exclusion criteria in order to rule out any external environmental influence, as it still is a matter of debate as to how much of population difference due to rugae is attributable to genetic difference and how much is the result of environmental effects.[7,16]
Chi-square analysis for assessing differences in rugae shape between the two populations showed greater numbers of wavy, unifications, and curved rugae in Odisha and more numbers of straight and nonspecific rugae in Andhra Pradesh. Though the two populations are geographically close, the genes might arise from different quarters.
Comparative studies have shown varying pattern of differences in palatal rugae shape between populations. Higher prevalence of wavy and curved rugae in Odisha (45.85% and 24.41%, respectively) are similar to the findings in Australian aborigines (55.8% and 23.2%, respectively) and in Caucasians (40.6% and 25.8%, respectively) and in southern Indians (38.33% and 26.83%, respectively) and in western Indians (34.47% and 44.71%, respectively) by Nayak et al. implying that probably these rugae forms show greater frequency of occurrence across different races.[4,7] However, although wavy rugae were prevalent in Andhra Pradesh (28.88%), straight rugae dominated (37.3%), which was partly consistent with another Indian study that recorded respectable percentages of straight rugae (26.48%) in southern Indian population. Additionally, presence of plaque pattern in Andhra Pradesh population could be an exclusive feature of this group, thus bearing tremendous potential for its identification.
Due to the apparent lack of systematic trends, some authors concluded that rugae do not possess discriminatory ability while some have proved otherwise.[4,7] Therefore, the discriminatory ability of rugae in population differentiation was tested using step wise discriminant function analysis, which yielded a very high level of accuracy of 93.5% in the present study, which may be due to the strict standardization criteria followed. A previous extensive study in differentiating six diverse South African racial groups yielded an accuracy of 72.2%, whereas a study differentiating between southern Indian and western Indian populations possessed an accuracy of 70%.[4,10,11,12,13,14]
Therefore, the present study validated previous reports that palatal rugae indeed played a significant role in population differentiation and discrete variables like rugae shape are more suited for the purpose.[4] In fact, future studies could include rugae breaks and papillations as parameters as they have been known to possess better discriminatory ability. Certain rugae variables can be studied for evolutionary trends among human populations as studies have shown such an association.[10]
Given the high accuracy of prediction by palatal rugae, in population identification, they could be used as genetic markers for research on population groups.
Footnotes
Source of Support: Nil
Conflict of Interest: None declared
References
- 1.Vij K. 3rd ed. Missouri (USA): Elsevier Publications; 2005. Textbook of forensic medicine and toxicology- principles and practice; pp. 50–104. [Google Scholar]
- 2.Bernstein M. Forensic Odontology. In: Eckert WG, editor. Introduction to Forensic Sciences. 2nd ed. Florida: CRC press LLC; 1997. pp. 295–342. [Google Scholar]
- 3.Acharya AB, Sivapathasundaram B. “Forensic odontology”. In: Rajendran R, Sivapathasundaram B, editors. “Shafer's textbook of oral pathology”. 5th ed. New Delhi (India): Elsevier Publications; 2007. pp. 1199–224. [Google Scholar]
- 4.Nayak P, Acharya AB, Padmini AT, Kaveri H. Differences in the palatal rugae shape in two populations of India. Arch Oral Biol. 2007;5:977–82. doi: 10.1016/j.archoralbio.2007.04.006. [DOI] [PubMed] [Google Scholar]
- 5.Muthu Subramanian M, Limson KS, Julian R. Analysis of rugae in burn victims and davers to simulate rugae identification in cases of incineration and decomposition. J Forensic Odontostomatol. 2005;23:26–9. [PubMed] [Google Scholar]
- 6.English WR, Robinson SF, Summitt JB, Oesterle LJ, Brannon RB, Morlang WM. Individuality of human palatal rugae. J Forensic Sci. 1988;33:718–26. [PubMed] [Google Scholar]
- 7.Kapali S, Townsend G, Richards L, Parish T. Palatal rugae patterns in Australian Aborigines and Caucasians. Aust Dent J. 1997;42:129–33. doi: 10.1111/j.1834-7819.1997.tb00110.x. [DOI] [PubMed] [Google Scholar]
- 8.Lysell L. Plicae palatinae transversae and papilla incisiva in man: A morphologic and genetic study. Acta Odontol Scand. 1955;13(Suppl 18):5–137. As quoted by Kapali et al, 1997, vide ref no. 1. [PubMed] [Google Scholar]
- 9.Thomas CJ. Incidence of primary rugae in Bushman juveniles. J Dent Res. 1972;51:676. doi: 10.1177/00220345720510028201. [DOI] [PubMed] [Google Scholar]
- 10.Thomas CJ, Kotze T. The palatal rugae pattern in six South African human populations. Part –I. A description of the populations and a method for its investigation. J Dent Assoc S Afr. 1983;38:547–53. [PubMed] [Google Scholar]
- 11.Thomas CJ, Kotze TJ. The palatal rugae pattern in six South African human populations. Part –II. Inter racial differences. J Dent Assoc S Afr. 1983;38:166–72. [PubMed] [Google Scholar]
- 12.Thomas CJ, Kotze TJ. The palatal rugae pattern in six South African human populations. Part –III. An evolutionary perspective. J Dent Assoc S Afr. 1983;38:173–6. [PubMed] [Google Scholar]
- 13.Hauser G, Daponte A, Roberts MJ. Palatal rugae. J Anat. 1989;165:237–49. [PMC free article] [PubMed] [Google Scholar]
- 14.Shetty SK, Kalia S, Patil K, Mahima VG. Palatal rugae pattern in Mysorean and Tibetan populations. Indian J Dent Res. 2005;16:51–5. [PubMed] [Google Scholar]
- 15.Thomas CJ, van Wyk CW. The palatal rugae in identification. J Forensic Odontostomatol. 1988;6:21–7. [PubMed] [Google Scholar]
- 16.Hemnath M, Vidya M, Nandaprasad, Karkare BV. Human identification using palatal rugae: Manual method. Indian J Forensic Med Toxicol. 2009;3:26–8. [Google Scholar]


