

Significance
Control of immunologic tolerance and homeostasis rely on regulatory T lymphocytes that express the transcription factor FOXP3. To characterize the interindividual variation of human Treg cells, we performed a genome-wide expression and genotypic analysis of 168 human donors, healthy or affected by type-1 or type-2 diabetes (T1D, T2D). We identify cis-acting genetic variants that condition Treg effector but not specification genes, and gene clusters that suggest Treg-specific regulatory pathways for some key signature genes (CTLA4, DUSP4). We also identify factors that may control FOXP3 mRNA or protein expression, the specification of the Treg signature, and Treg suppressive efficacy. Although no single transcript correlates with diabetes, overall expression of the Treg signature is perturbed in T1D, but not T2D, patients.
Keywords: immunoregulation, suppression
Abstract
FOXP3+ regulatory T (Treg) cells enforce immune self-tolerance and homeostasis, and variation in some aspects of Treg function may contribute to human autoimmune diseases. Here, we analyzed population-level Treg variability by performing genome-wide expression profiling of CD4+ Treg and conventional CD4+ T (Tconv) cells from 168 donors, healthy or with established type-1 diabetes (T1D) or type-2 diabetes (T2D), in relation to genetic and immunologic screening. There was a range of variability in Treg signature transcripts, some almost invariant, others more variable, with more extensive variability for genes that control effector function (ENTPD1, FCRL1) than for lineage-specification factors like FOXP3 or IKZF2. Network analysis of Treg signature genes identified coregulated clusters that respond similarly to genetic and environmental variation in Treg and Tconv cells, denoting qualitative differences in otherwise shared regulatory circuits whereas other clusters are coregulated in Treg, but not Tconv, cells, suggesting Treg-specific regulation of genes like CTLA4 or DUSP4. Dense genotyping identified 110 local genetic variants (cis-expression quantitative trait loci), some of which are specifically active in Treg, but not Tconv, cells. The Treg signature became sharper with age and with increasing body-mass index, suggesting a tuning of Treg function with repertoire selection and/or chronic inflammation. Some Treg signature transcripts correlated with FOXP3 mRNA and/or protein, suggesting transcriptional or posttranslational regulatory relationships. Although no single transcript showed significant association to diabetes, overall expression of the Treg signature was subtly perturbed in T1D, but not T2D, patients.
CD4+FOXP3+ regulatory T (Treg) cells are important mediators of immune tolerance, prevent overwhelming immune responses, and regulate extraimmunological functions (1–3). Their absence leads to lethal lymphoproliferation and multiorgan autoimmunity in scurfy mice and in patients with immunodysregulation polyendocrinopathy enteropathy X-linked syndrome.
Treg cells differ substantially from conventional CD4+ T cells (Tconv) with respect to their transcriptomes. In mice, a canonical “Treg signature” of transcripts that are over- or underexpressed in Tregs relative to Tconv has been well defined (4, 5). This signature encodes proteins ranging from cell-surface molecules (e.g., IL2RA, CTLA4) to transcription factors [e.g., FOXP3 or Helios (Ikzf2)] and includes several molecular mediators of Treg action (6). The Forkhead family transcription factor (TF) FOXP3 is essential for the specification and maintenance of Tregs and plays an important part in determining the Treg signature (4, 7–9). However, FOXP3 is not completely necessary for the differentiation of Treg cells, and some aspects of the Treg signature are independent of FOXP3 (4, 10–12). A number of other transcription factors have been reported to interact with FOXP3 and to promote Treg function (refs. 13 and 14 and refs therein). In addition, different Treg subphenotypes are dependent on differential expression of TFs, such as T-bet, Irf4, or PPARγ (15–17). We have recently shown that several of these TFs make up, together with FOXP3, a genetic switch that locks in the Treg phenotype (13). The transcriptome of Treg cells has been less extensively studied in humans although early studies indicate that several of the more prominent members of the mouse Treg signature are also differentially expressed in human Treg cells (18–20).
Dysregulation of Treg cells has been invoked in the determinism of organ-specific autoimmune diseases such as type-1 diabetes (T1D) (21). Experimentally, genetic deficiencies that reduce Treg numbers or some facets of their function result in accelerated diabetes in mouse models (22–25), and Treg transfer can be protective (22, 26, 27). Whether Treg defects are directly implicated in the determinism of autoimmune disease remains an open question. Some of the T1D susceptibility loci uncovered by large genome-wide association studies (GWASs) may plausibly influence Treg activity (e.g., IL2RA, IL2, CTLA4) (28). One can hypothesize that programmed Treg defects render an individual globally more susceptible to unrestrained activity of autoreactive cells or that Treg deficiencies occurring locally in the target organ, perhaps in response to environmental or infectious triggers, destabilize the local Treg/effector T equilibrium and allow terminal organ damage (29, 30).
It is now recognized that the frequency of FOXP3+ Treg cells in the blood of human T1D patients is comparable with that of healthy subjects (30–32), as in NOD mice (29, 33). Whether Tregs from T1D patients are dysfunctional is controversial (30, 32, 34–37), and it is possible that only one facet of their activity is altered (38). Recent results also suggest that, in T1D patients, effector T cells may be refractory to inhibition by Treg cells (39, 40) although this point has also been debated (30, 38). However, there is an intrinsic limitation to addressing this question experimentally in the human system: Only blood cells are readily accessible, and the in vitro suppression assay, the only practicable tool for functional evaluation, may not be relevant to the control of diabetes in vivo.
Human genetic diversity and its adaptation to novel environments during out-of-Africa migrations have strong impacts on genes of the immune system (41). Indeed, under the strong selective pressure elicited by pathogens, immune system genes are those that show the strongest marks of adaptation and positive selection for variant alleles in different populations (42). Inflammatory disease-associated variants such as those underlying T1D are enriched in signatures of positive selection (43). Some of these variants are eQTL (expression quantitative trait loci) that affect transcriptional rate or mRNA stability (44) and may mediate the effect of inflammatory-disease susceptibility loci (45).
Little is known about the range of genetic and epigenetic variation in Treg cells within the human species. Various studies have found a wide (up to fourfold) range of variation in the proportion of FOXP3+ Treg cells in healthy individuals (30, 32, 34–37), as is the case in inbred mice (33). Here, we have assessed the interindividual transcriptomic variability in Treg cells as this interindividual variance encompasses and integrates all of the genetic, epigenetic, environmental, and stochastic influences that govern the Treg transcriptome of an individual. This study was performed on cohorts of healthy subjects and patients with established T1D, aiming to tease out aspects of this variability that correlate with autoimmune diabetes.
Results
Genetic/Genomic/Immunologic Profiling.
To explore the extent of variation in Tregs among human individuals, we performed a broad genomic, immunologic, and genetic profiling, with a particular emphasis on T1D. We collected a sample set from 229 individuals, comprising 83 T1D patients, 46 type-2 diabetes (T2D) patients, and 100 healthy controls (Dataset S1). Recruiting was split into three consecutive cohorts over 3 y because of financial limitations, which also allowed adjustments in composition and experimental design. Donors with T1D were sampled well after diabetes onset (only one donor <1 y, and 95% >5 y) to avoid confounders from inflammation and unstable glycemia surrounding onset. Donors with T2D were included in cohorts 2 and 3 to flag changes in gene expression secondary to hyperglycemia and/or insulin treatment. Six donors (cohort 2) were sampled on two independent occasions, several weeks apart, to assess the stability of the traits observed. Age, sex, body-mass index (BMI), age of T1D onset, disease duration, glycated hemoglobin (HbA1c), and insulin requirement were recorded. Immunologic profiling included flow-cytometric determination of Treg frequency among CD4+ cells, levels of FOXP3 protein, and the proportion of CD25+ Tregs. The expression of Helios and other Treg subset markers (CD39, CCR6, CXCR3, and CCR4), were measured for some donors, as was Treg in vitro suppressive activity.
The expression-profiling arm compared freshly isolated Treg and Tconv cells from each individual. Treg (CD4+CD25hiCD127−) and Tconv (CD4+CD25−CD127+) cells were purified from peripheral blood mononuclear cells (PBMCs) by two rounds of flow sorting (Fig. S1) (sorted Tregs were mainly 80–90% FOXP3+). To ensure a full representation of these CD4+ populations, they were profiled without further split. RNAs from these cells were profiled on Affymetrix ST1.0 microarrays, one batch of microarrays corresponding to each recruitment cohort. Of the profiles determined, we retained 168 pairs with robust Treg and Tconv data (60 T1D, 30 T2D, 78 healthy controls). There were interbatch variation between the cohorts, and most of the bioinformatics analyses were performed within each cohort and then cross-checked for concordance. When the full power of the entire dataset was needed (e.g., to compare T1D donors and controls), we used a generalized linear mixed model to fit the data, using the residuals after fit to the batch variable.
The Treg Cell Signature and Its Variability.
The large number of Treg and Tconv cells profiled allowed a robust definition of the transcripts that distinguish human Treg and Tconv cells, grouping transcripts that were differential in the population means or in at least 20% of the individuals. This core Treg signature included 194 and 192 probes over- and underexpressed in Tregs relative to Tconv (Treg-Up and Treg-Down, respectively; listed in Dataset S2). However, because of the power provided by 168 individuals, significant Treg/Tconv differential expression was detected for 7,975 probes [at a false discovery rate (FDR) ≤10−3], indicating that the stronger differences resonate deeply across the genome. The most differentially expressed genes included the “usual suspects” of Treg biology, FOXP3, CTLA-4, IKZF2, and IL2RA, overexpressed in Tregs, or ID2 and THEMIS overexpressed in Tconv cells (Fig. 1A). The signature has a high concordance (>73%) with a quality Treg signature derived previously on a different microarray platform (18). The signature encodes products involved in a variety of processes and cellular localizations.
Fig. 1.

Interindividual variability in Treg signature transcripts. (A) Gene-expression profiles were generated from purified Treg and Tconv cells from blood of 168 individuals, and the average expression values are compared. (B) Treg signature transcripts are ranked according to mean differential expression (red dots), and the Treg/Tconv ratio for each individual of Cohort3 is plotted. (C) Normalized microarray expression levels in Tconv and Treg cells of selected genes (on a linear scale from 20 to 20,000, where 120 represents a 95% probability of expression); each dot represents 1 of 55 donors from cohort 3. (D) Histogram of gene-wise coefficient of variation across the datasets for Treg signature genes or for a random expression-matched set of genes (P value, Wilcoxon rank-sum test).
We then asked how the expression of the Treg signature genes differs between individuals. Fig. 1B displays for individual donors the Treg/Tconv expression ratio of Treg signature genes, ranked by mean ratio. Several points can be made. First, the signature was generally shared among all individuals. Second, some individuals showed marked departure from the population average, with lower or even inverted Treg/Tconv ratios for some genes. Third, there was a range in the variability of individual genes. Some departed little from the population mean, including some of the key defining transcripts (e.g., FOXP3, IKZF2) (Fig. 1C); others were more divergent, denoted by vertical streaks in Fig. 1B, exemplified by ENTPD1 (encodes CD39, a Treg effector molecule) (46, 47). Overall, there was more interindividual variability in overall abundance for Treg signature genes than for other transcripts, as indicated by the distribution of coefficients of variation of signature genes relative to expression-matched transcripts that are equivalently expressed in Treg and Tconv cells (Fig. 1D).
These results indicate that there is a defined Treg signature generally shared across the population, but with more interindividual variability than the transcriptome norm. This variance may reflect variation of single genes, or in modules and pathways that define the Treg-cell subphenotypes.
Coregulation of Treg Signature Genes.
Eukaryotic transcriptomes are organized into clusters of coexpressed genes, responding in concert to regulatory cues through shared control mechanisms (48). The interindividual variation across these datasets provided an opportunity to identify such clusters among Treg signature genes in the two parallel datasets from CD4+ Treg and Tconv cells and to identify connections that are shared in these two related cell types, and those that are specific (Fig. 2A). The perturbations introduced in the regulatory network by genetic, epigenetic, or environmental variance should result in detectable correlation between coregulated gene pairs in Treg cells. Regulatory circuits that have the same structure but are tuned to different levels should yield similar correlated modules in Treg and Tconv datasets, but regulatory interactions that do not operate in Tconv cells should show up as lower correlation coefficients for the corresponding gene modules in the Tconv dataset.
Fig. 2.

Coregulated gene clusters in Treg and Tconv cells. (A) Experimental concept. (B) Treg signature genes were tested for correlated expression across all donors, and the 290 genes with >2 correlated genes (at cc > 0.5) were biclustered within the Treg and Tconv expression datasets. Heatmap representation of the gene–gene correlation coefficients, similarly clustered in the Treg and Tconv datasets. The Cluster Similarity score is the mean of Pearson correlation coefficients between members of each cluster, computed in Treg and Tconv cells. Members of the Treg-specific clusters are shown.
We first constructed a matrix of gene–gene correlation for all Treg signature genes and used a partitioning clustering algorithm to group those genes exhibiting multiple correlations into clusters, optimizing the cluster structure by taking into account both Treg and Tconv datasets (Materials and Methods) (similar correlations were observed when each cohort was analyzed independently, indicating that the correlations were robust and not driven by batch effects). The results (Fig. 2B and listed in Dataset S3) showed an array of gene clusters, which predominantly but not exclusively grouped either up- or down-signature genes. Several points could be made. First, there wasn’t one dominant cluster grouping FOXP3 and the canonical Treg signature genes. Instead, the latter are dispersed into different clusters (clusters 4, 7, 8, and 11 for FOXP3, IL-2RA, CTLA-4, and IKZF2, respectively), FOXP3 itself belonging to a small cluster (together with IKZF4, TIGIT, and the proliferation-controlling miRNA precursor MIR21). These observations suggested that the major Treg signature transcripts do not vary in lockstep within Tregs and that variations in FOXP3 expression are not the unique driver of the Treg signature tone. Second, side-by-side comparison of the maps of Fig. 2 showed that the patterns of gene–gene correlation were partially different in Treg and Tconv cells: Some clusters were equally “tight,” with comparable intracluster similarity in both cell types (e.g., cluster 2, 3, 5, or 7). Several other clusters were markedly less connected in the Tconv than in the Treg datasets (e.g., clusters 1, 8, or 12), likely denoting regulatory connections that are specific to Treg cells. Third, the cluster map was very similar for Treg cells from T1D patients and control individuals (Fig. S2), indicating that these structures are robust, with comparable relationships in unrelated donors, and that these differences in the regulatory network of Treg and Tconv cells do not relate to T1D.
Genetic Basis for Variability in Treg Signature Genes.
We then performed an expression quantitative trait locus (eQTL) analysis to identify and characterize the cis-acting genetic contribution to interindividual variability in expression levels of Treg signature genes. Genotypes at 951,117 SNPs were determined for 65 individuals (Exome and ImmunoChip, providing genome-wide coverage with additional weight on exome and loci of immunologic relevance). Rigorous quality control included genotype call rate, sex misidentification, Hardy–Weinberg Equilibrium testing, and Minor Allele Frequency (MAF) < 0.01; eight individuals and 84,461 SNPs were filtered out from later analyses. These genotypes were used to search for cis-eQTLs, detected as association of RNA expression levels (residuals of a mixed-model fit to batch, age, and diagnosis to remove these confounders) with SNPs in a ±1-Mb window around each gene. Although this study was not powered for a high sensitivity, a number of strong eQTLs emerged (Fig. 3A and listed in Dataset S4): 105 and 110 genes showed at least one eQTL at 0.001 permutation threshold with a false discovery rate (FDR) of 9% (49) in Treg and Tconv cells, respectively. As expected, many of those transcripts showed several associated SNPs, in linkage disequilibrium and spread across the gene (e.g., ENTPD1, FCRL1, and CD52) (Fig. S3). Interestingly, cis-eQTLs were not detected for the most characteristic transcription factors, in particular FOXP3 or IKZF2 (Fig. 3B and Dataset S5).
Fig. 3.

eQTL analysis in Treg and Tconv gene expression. (A) Genome-wide SNP genotypes from 57 individual belonging to cohorts 2 and 3 were tested for association to expression of neighboring genes in the Treg and Tconv datasets. The significance of the association is shown [−log10(P value)]; each dot is an SNP/gene pair. The dotted line denotes the nominal P value for significance. (B) Comparison of maximum eQTL P values for genes in Treg and Tconv expression datasets. Red or blue dots and labels are Treg-Up and -Down signature genes, respectively. (C) eQTL P values are plotted against the Variability Score (measure of true interindividual variability, after correcting for experimental noise).
Many of the eQTLs detected were shared in Treg and Tconv cells, as illustrated by the comparison, in Fig. 3B, of the P values of the best eQTL for each gene in both cell types. Some eQTLs, however, were predominantly or uniquely significant in Treg or Tconv cells (predominantly in Tregs for Up signature genes, and vice versa). We queried the Treg and Tconv eQTLs for SNPs previously associated with immune or inflammatory diseases (Dataset S6). Only a few overlaps were found (e.g., ERAP2 in Crohn disease), and these overlaps concerned only the less significant GWAS hits.
Finally, we asked whether genetic variation accounts for all of the variance observed in the Treg signature. We computed a Variability Score (VS) for each gene, from the variance observed between all individuals relative to the variance observed between repeat samples drawn from the same donors (Materials and Methods). The variance within these repeats from the same donors incorporates both experimental noise and short-term fluctuations, such that the VS should mainly reflect interindividual variation that is stable over time. Plotting this VS against the eQTL score [–log10(P value)] for all genes shows that the genes with strong eQTLs have a high variability score, providing validation of this metric. On the other hand, most genes with high VS had no significant eQTL (Fig. 3C) (only 21.9% genes with VS >0.75 had an eQTL with score >4). With the caveat that the limited power of this small dataset would miss weak genetic effects, this dichotomy suggests that the high interindividual variability in Treg signature genes has a cis-acting genetic basis for some genes whereas other genetic and or nongenetic factors influence many other transcripts.
Nongenetic Variation in Treg Signature Transcripts.
We then asked whether the expression of Treg signature genes varied with individual characteristics of the donors. It has been unclear whether the proportion of Tregs increases with age in humans, as it does in mice (50). We first analyzed the frequency of Tregs (% CD25+FOXP3+ cells among CD4+ T cells) relative to age, sex, and BMI. None of the traits showed a significant correlation with Treg frequency (Fig. S4 A–C). To study the association of age, sex, and BMI with the expression of Treg signature genes, we fit the expression of each Treg signature gene in a linear mixed model with age, sex, and BMI as explanatory variables, and retrieved the coefficient for each term (to ensure that diabetes would not influence the outcome, values for T1D patients and healthy controls were fit independently). There was a strong bias of the coefficients for the age variable, opposite for Up and Down Treg signature genes, indicating a positive association between age and the expression of Treg signature genes. This observation was true for both T1D patients and control subjects (Fig. 4A). This bias involved most of the Treg signature, although more marked for some clusters than for others (Fig. S4G). We calculated “Treg indices” by averaging the normalized expression of all Treg signature genes. The Treg Up index increased gradually, with roughly a 50% increase between 20 and 60 y of age (Fig. 4B). A parallel trend was noted, in both Tconv and Treg cells, for the Treg Down index. There was no bias relative to sex, save for a few ChrX- or Y-encoded genes, but we found an association with BMI, which was more marked in controls than in T1D patients (Fig. 4A).
Fig. 4.
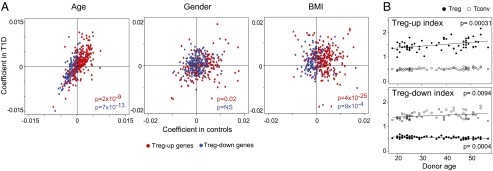
Bias in Treg gene expression with age. (A) Gene expression values in the Treg dataset were fitted in a mixed-model with donor age, sex, and BMI as explanatory variables, independently for T1D and healthy controls, and the coefficients of the fit were plotted (P values were computed from a χ2 test of the distribution of positive and negative coefficients). (B) A “Treg index” was calculated for each individual (by averaging normalized expression values of all genes in the Treg-Up or -Down signatures) and plotted against the donor age, for Treg and Tconv cells.
These results suggest that the expression of Treg-specific genes is modulated by age and metabolic parameters, Treg cells acquiring a more distinctive phenotype with age.
Transcripts Controlling Treg Numbers and Function.
As in mice, the proportion of blood Treg cells varies markedly between humans, but its determinism is unknown. We thus probed whether Treg signature genes or other elements of the Treg transcriptome might determine these traits. Across our cohorts, the proportion of FOXP3+ among CD4+ T cells varied within the usual range (2–8%), with no relation to FOXP3 mean fluorescence intensity (MFI). We correlated Treg frequency values with the expression of each gene across the Treg datasets (after normalizing for age, sex, diagnosis, and BMI). As illustrated in Fig. 5 A and B and Dataset S7, the overall expression of Treg signature genes did not associate particularly strongly with Treg frequency; rather, Treg frequency correlated with other transcripts not commonly associated with Treg cells but with cell cycle (e.g., histone genes) or activation (POL2RE, PKM, NDRG1). In addition, none of the genotyped SNPs associated significantly with Treg proportions.
Fig. 5.
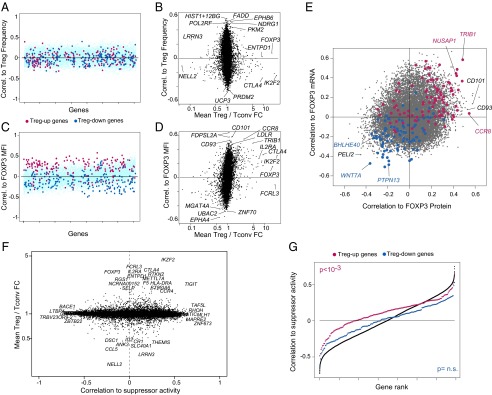
Relationships to FOXP3 expression and Treg function. (A) Expression of individual genes was correlated to Treg frequency (proportion of FOXP3+CD25+ cells within CD4+ cells), and the correlation coefficients were plotted (blue and red dots, Treg-Up and -Down signature genes, respectively). (B) Plot of the coefficients against the Treg/Tconv expression ratio. (C and D) As in A and B, but vs. FOXP3 mean fluorescence intensity in CD4+CD25+CD127lo cells. (E) Correlation of all genes to FOXP3 mRNA expression in the Treg dataset vs. correlation to FOXP3 protein [from flow cytometry MFI; blue and red dots, Treg-Up and -Down signature genes, gated on FoldChange > 2)]. (F) Correlation of gene expression vs. Treg suppressor activity, measured in a subset of 22 donors. (G) Ranked plot of correlation coefficients for all genes (black dots) or for the Treg-Up and -Down signature genes (red, blue).
On the other hand, there was a clear bias in the correlation coefficients between Treg signature expression and the level of FOXP3 protein expression, assessed as the MFI in flow-cytometric analyses (Fig. 5 C and D and Dataset S7). Most of the canonical Treg signature genes, with the exception of FCRL3, were biased toward low but positive correlation coefficients (and conversely for Treg-down signature genes; χ2 P = 10−14 and 10−40). Transcripts most correlated with FOXP3 MFI likely include direct FOXP3 targets, or conversely encode factors that regulate FOXP3 itself. As evidence for the former, genes with highest absolute correlation to FOXP3 MFI were also enriched in FOXP3-binding sites (extrapolating from FOXP3 binding to orthologs in mice) (14). FOXP3-correlated transcripts include CCR8, a marker of Treg cells with higher FOXP3 levels (51), but also genes that do not belong to the Treg signature such as CD101, which has been associated with Treg potency (52).
We compared (Fig. 5E) how different transcripts related to FOXP3 mRNA (microarray signal intensity) or protein (MFI). A similar bias in the correlation with both metrics was observed for much of the Treg signature genes (diametrically opposite for Up and Down transcripts), as would be expected for genes whose expression is controlled by FOXP3 or that control its transcription (TRIB1, NUSAP1, WNT7A, PTPN13). Interestingly, others showed correlation to FOXP3 protein but not mRNA, suggesting that they may influence posttranslational processing of FOXP3 (CCR8, CD101, CD93).
It is not possible to measure human Treg inhibitory activity in vivo, and the in vitro suppression assay serves as a surrogate test for Treg function. To ask which transcripts might associate with suppressive activity, we correlated the abundance of each transcript in Treg cells with suppressive activity of purified blood Treg cells in 23 donors (Fig. 5F) (for logistic reasons, this analysis was performed only on cohort 3 donors). No single gene stood out, perhaps with the exception of TIGIT, already reported as important for suppressive function (53, 54). However, there was a general skew of Treg Up signature genes, most of which were positively associated with suppression (Fig. 5G) (Wilcoxon rank-sum test P = 6 × 10⁻⁷). In contrast, transcripts underexpressed in Treg cells were not biased with regard to suppression.
Differential Expression of the Treg Signature in T1D Patients and Controls.
To search for variation in the transcriptomes of Treg or Tconv cells that would track with T1D in our cohorts, we first performed a simple marker-trait association, comparing the expression level of individual genes in T1D donors and age-matched healthy controls. As illustrated in Fig. 6A, no individual gene scored at a genome-wide level of significance [−log10(P) ≥ 5.5], in either Treg or Tconv cells, with the exception of LARP4 (a member of the La ribonucleoprotein domain family) and TLR1 in the Tconv transcriptome. Neither did the T1D candidate genes highlighted by large GWAS studies show biased expression (red dots in Fig. 6A).
Fig. 6.
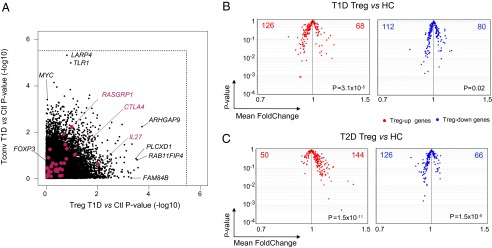
Underexpression of Treg signature genes in Treg cells from T1D patients. (A) Expression values of each gene in the Treg and Tconv datasets were compared in Tregs from T1D patients or healthy controls. The nominal threshold for corrected genome-wide significance is shown as a dotted line. (B) Mean Fold Change vs. t test P value for the comparison between T1D and healthy donors for Treg-Up (Left) and -Down (Right) signature genes. (C) As in B, comparing T2D and healthy donors.
To assess whether T1D might be associated with changes in the Treg signature as a whole, we compared the population-wide mean and variance between age-matched T1D and healthy controls for all Treg signature genes. On the “volcano plot” displayed in Fig. 6B, no particular gene stood out. However, the signature as a whole was skewed, with underexpression of a majority of Treg-up signature genes in T1D individuals (P = 3 × 10⁻⁵), even if the changes were very subtle for each individual transcript [mean FoldChange (FC) in the 0.9–0.95 range]. T2D patients compared with age-matched controls did not show this skew (Fig. 6C) (indeed, the opposite). We found no correlation between Treg signature and HbA1c levels, confirming that the skew observed in T1D patients was not a result of confounding factors such as insulin treatment or hyperglycemia.
Discussion
Given the widespread functions of Treg cells, interindividual variation in Treg numbers and function in humans should have a significant influence on individual resistance to infections, autoimmune disease, or tumors. The degree of Treg activity can have deleterious effects at either end of the spectrum (high suppression leading to low autoimmunity but to stunted anti-infectious responses, and vice versa). In addition, Treg action can have paradoxically favorable effects on anti-infectious responses (55, 56). Thus, selection acting on loci that condition Treg function probably maintains equilibrated Treg function, with wide enough range at the level of the species that diverse challenges can be met by at least some individuals. The changing environmental challenges that have accompanied human migrations have probably molded the gene pool in this regard, as they have immune response genes in general (41, 42). The present study was designed to describe, on a large scale, the extent of Treg functional variability and to track its genetic and transcriptional underpinnings, with a particular emphasis on the association with type-1 diabetes.
Treg Transcriptomic Variability.
Differential expression of Treg signature genes in Treg and Tconv cells was found generally across the 168 donors analyzed, none of which had a broad deviance from the population mean that affected the Treg signature as a whole. On the other hand, significant variance in the abundance of individual Treg signature transcripts was observed, greater than the genome-wide mean. This variance was uneven, more pronounced for Treg genes associated with suppressive function than for lineage-specification genes such as FOXP3 or IKZF2 (although these did show some variation, at the level of mRNA or protein abundance). A particularly clear example of variation in a Treg effector transcript is ENTPD1, which encodes CD39, an important ecto-ATPase in the adenosinergic pathway of suppression. It is not part of any of the Treg-coregulated gene clusters and varies largely independently, which is consistent with the strong cis-eQTLs detected at the locus (also previously observed in ref. 57). Does the wide range of variation conditioned by this variant reflect neutral genetic noise or differential requirements for activity of Treg adenosinergic suppression in different infectious or tumor contexts? CD39 has widespread expression in, and relevance to, platelet function, coagulation, and nervous-system regulation, such that the evolutionary drive of this variability may not be immunological.
From where does this variability arise? Some was due to cis-acting genetic variants, with highly significant cis-eQTLs emerging, even from a relatively small sample size. Here again, eQTLs were found in genes involved in effector or modulator functions (ENTPD1, BCAS1, FCRL1) rather than lineage-determining factors. Some of these eQTLs were predominantly manifest in Tregs, particularly those affecting Treg up signature transcripts, either because these transcripts are expressed only at low levels in Tconv cells, with correspondingly less power for eQTL detection, or because these SNPs directly affect regulatory mechanisms that are uniquely active in Tregs. Many Treg eQTLs were shared with Tconv cells. With one exception (SESTD1), these shared eQTLs did not affect differentially expressed signature genes, but correspond to functions that are generic to CD4+ T cells (consistent with this notion, this “sharing” was more pronounced in this study than when eQTLs in more distantly related cell-types are compared) (58).
However, an important fraction of the variability does not have a readily discernable genetic component. Most of the transcripts with a variability score in the same range as those with strong cis-eQTLs do not show any hint of sizeable cis control. Some of these situations might correspond to trans-QTLs (i.e., association of transcript expression to genetic variants on other chromosomes), which the study was not powered to detect; but trans-eQTL effects are generally weaker than cis-eQTLs and would be unlikely to account for a large amount of the variability. Thus, we suggest that much of this variability stems from nongenetic origins: from inheritable epigenetic traits such as parental imprinting, from infectious and other immunologic challenges in the individual’s history, or from other physiological influences. An example is provided by the effect of age, with a clear increase in the overall expression of Treg signature transcripts in older individuals. In essence, Treg cells become more Treg-like with age. This change may correspond to a cell-autonomous evolution of the Treg population with time, perhaps as a gradual selection of clones with better survival characteristics, perhaps an element of “immuno-senescence.” Alternatively, it may be a reaction to the chronic inflammatory tone (with higher levels of proinflammatory cytokines and adhesion molecules) found in aging individuals (59).
Some of this variability could be grouped into coregulated sets of genes. Most of the coregulation patterns were similar in Treg and Tconv cells. This result is not unexpected because these are very closely related differentiated cell types, but it gives confidence as to the robustness of these structures. Further, these maintained patterns of coregulation indicate that, even though these Treg signature genes are differentially expressed in Treg and Tconv cells, their regulatory connections are similar; differences in expression may simply reflect a different tuning of these pathways in the two cell types. On the other hand, some of the pairwise gene–gene correlations or coregulated clusters were unique or at least highly preferential to the Treg dataset, and these may reflect Treg-specific circuits. These Treg-specific relationships involve some key Treg-specific genes such as CTLA4, TNFRSF9 (4.1BB), or DUSP4.
Strong interindividual variation in the proportion of Treg cells among blood CD4+ T cells has been observed in many studies and was also seen here (1.9–8.9%). Perhaps counterintuitively, there was no association between this frequency and the intensity of the Treg signature genes in general, nor with FOXP3 expression in particular. This conclusion was confirmed by the lack of correlation between Treg frequency and FOXP3 MFI. Stronger Tregs do not make for more Tregs. Some transcripts that did correlate with Treg frequency are plausibly related to cell division or survival, but others such as FADD or PDRM2 may denote more specific effects and will be interesting to track in replicative studies.
In contrast, there was a clearly biased association of Treg signature genes with the intensity of FOXP3 protein expression. Network analysis (Fig. 2) showed that FOXP3 is not the unique and dominant driver of the network, in keeping with the now accepted notion that FOXP3 is a key important player but not the unique player in Treg signature specification. Some of this association likely reflects the importance of FOXP3 in controlling the expression of Treg signature genes, and many of these (e.g., CTLA4, TRIB1, RTKN2, IKZF2) are direct FOXP3 targets in mouse cells (14). Others may actually be direct regulators of FOXP3 transcription or of protein stability. In this regard, it is interesting to note that there is more interindividual variability in FOXP3 protein than in FOXP3 mRNA and only a minor relationship between the two, suggesting translational or posttranslational control. Some of these potential modulators of FOXP3 include genes such as CCR8 or CD101, which do not belong to the Treg signature but have been previously tied to Foxp3 expression and/or Treg potency (51, 52), and several genes involved with lipid uptake and metabolism (LDLR, TRIB1), possibly reflecting a role in cellular lipids in controlling FOXP3, or genes of yet unrecognized relevance that may warrant further exploration (CD93, MGAT4A). Interestingly, CCR8 or CD101 seem to correlate with FOXP3 protein but not mRNA, possibly suggesting that they are involved with FOXP3 posttranslational regulation.
Treg Genomic Variability and Disease.
Given their importance in immunoregulation, the notion that Treg defects have a causal implication in the susceptibility to autoimmune diseases has attracted much interest, with arguments based on the relevance of some GWAS hits to Treg physiology (IL2RA, CTLA-4) and on reports, albeit not always consistent, of defective Tregs in some autoimmune diseases such as multiple sclerosis. Do the parameters of Treg variability analyzed here relate to T1D?
At the level of individual genes, there was no such connection. None of the transcripts individually showed significant association with T1D in the Treg or Tconv datasets, even at relaxed thresholds. This result is probably not surprising, as one might not expect that any one transcript would stand out, given the cellular and regulatory complexity of T1D pathogenesis. Similarly, the gene-coregulation patterns of Fig. 2 were largely superimposable for T1D and control donors. On the other hand, there were clear indications that combinations of genes are affected in the comparison of T1D patients to age-matched controls: When the Treg signature was tested as a whole, deviations in individual genes that were individually very small showed a significant collective bias.
We cannot formally rule out that some of these combinatorial signals are a secondary consequence of the inflammation and glycemic dysregulation that result from T1D. On the other hand, several arguments argue against this interpretation: (i) patients in this study had established and stable disease, several or many years removed from the inflammatory perturbations that accompany onset; (ii) T2D patients, half of which were insulin-dependent, were included as controls and did not show these effects; (iii) there was no relationship between the signature and glycemic control as reflected by HbA1c; and (iv) the decreased expression of Treg signature genes in T1D patients was precisely the opposite of that seen with both aging and T2D, both of which have a marked inflammatory component. This bias could not be ascribed to any cis- or trans-acting genetic locus. More generally, we suggest that the “state” of Treg population, as reflected by its mRNA expression profile, incorporates some genetic elements but also many nongenetic ones: parentally transmitted epigenetic traits, epigenetic remodeling during development, microbiome influence, and immunologic history. It is this integration that may define the susceptibility of a given individual to autoimmune disease.
Materials and Methods
Detailed methods are provided as SI Materials and Methods.
Briefly, blood samples were obtained from 229 individuals (83 T1D patients, 46 T2D patients, and 100 age-matched controls). PBMCs were prepared and double-sorted immediately using a strict standard operating protocol to minimize environmental, technical, and circadian variation, into Treg (CD4+CD25hiCD127lo) and Tconv (CD4+CD25−CD127hi) pools. Trizol-prepared RNAs were profiled on Affymetrix ST1.0 HuGene arrays. Data from three different cohorts were normalized by Robust Multichip Average and analyzed in GenePattern Multiplot. Batch effects were removed by first means-normalizing the data of each batch, then using residuals of a generalized linear model fit to the batch variable. Correlation to donor variables, immunophenotypes, or Treg suppression results were tested in R or S-Plus. SNP genotyping was performed for 65 donors on the Illumina Infinium HumanOmniExpressExome (951,117 SNPs) and quality-controlled data were analyzed using PLINK v1.07 software (60). In vitro Treg suppression of anti-CD3 activated Tconv cells was as described (30), using as responder cells frozen aliquots from a single donor.
Supplementary Material
Acknowledgments
We thank Dr. D. Koller for helpful discussion; Katie Rothamel, Joyce LaVecchio, and Girijesh Buruzula for help with flow cytometry and RNA preparations; and Jeff Ericson, Scott Davis, and Henry Paik for help with bioinformatics analyses. This work was supported by Juvenile Diabetes Research Foundation Grant 4-2007-1057 (to D.M., C.B., and L.L.) and National Institutes of Health Grant RC2 GM09308 (to D.M. and C.B.).
Footnotes
The authors declare no conflict of interest.
This article contains supporting information online at www.pnas.org/lookup/suppl/doi:10.1073/pnas.1401343111/-/DCSupplemental.
References
- 1.Sakaguchi S, Yamaguchi T, Nomura T, Ono M. Regulatory T cells and immune tolerance. Cell. 2008;133(5):775–787. doi: 10.1016/j.cell.2008.05.009. [DOI] [PubMed] [Google Scholar]
- 2.Curotto de Lafaille MA, Lafaille JJ. Natural and adaptive foxp3+ regulatory T cells: More of the same or a division of labor? Immunity. 2009;30(5):626–635. doi: 10.1016/j.immuni.2009.05.002. [DOI] [PubMed] [Google Scholar]
- 3.Benoist C, Mathis D. Treg cells, life history, and diversity. Cold Spring Harb Perspect Biol. 2012;4(9):a007021. doi: 10.1101/cshperspect.a007021. [DOI] [PMC free article] [PubMed] [Google Scholar]
- 4.Hill JA, et al. Foxp3 transcription-factor-dependent and -independent regulation of the regulatory T cell transcriptional signature. Immunity. 2007;27(5):786–800. doi: 10.1016/j.immuni.2007.09.010. [DOI] [PubMed] [Google Scholar]
- 5.Feuerer M, Hill JA, Mathis D, Benoist C. Foxp3+ regulatory T cells: differentiation, specification, subphenotypes. Nat Immunol. 2009;10(7):689–695. doi: 10.1038/ni.1760. [DOI] [PubMed] [Google Scholar]
- 6.Vignali DA, Collison LW, Workman CJ. How regulatory T cells work. Nat Rev Immunol. 2008;8(7):523–532. doi: 10.1038/nri2343. [DOI] [PMC free article] [PubMed] [Google Scholar]
- 7.Ziegler SF. FOXP3: Of mice and men. Annu Rev Immunol. 2006;24:209–226. doi: 10.1146/annurev.immunol.24.021605.090547. [DOI] [PubMed] [Google Scholar]
- 8.Hori S, Nomura T, Sakaguchi S. Control of regulatory T cell development by the transcription factor Foxp3. Science. 2003;299(5609):1057–1061. doi: 10.1126/science.1079490. [DOI] [PubMed] [Google Scholar]
- 9.Fontenot JD, et al. Regulatory T cell lineage specification by the forkhead transcription factor foxp3. Immunity. 2005;22(3):329–341. doi: 10.1016/j.immuni.2005.01.016. [DOI] [PubMed] [Google Scholar]
- 10.Gavin MA, et al. Foxp3-dependent programme of regulatory T-cell differentiation. Nature. 2007;445(7129):771–775. doi: 10.1038/nature05543. [DOI] [PubMed] [Google Scholar]
- 11.Lin W, et al. Regulatory T cell development in the absence of functional Foxp3. Nat Immunol. 2007;8(4):359–368. doi: 10.1038/ni1445. [DOI] [PubMed] [Google Scholar]
- 12.Sugimoto N, et al. Foxp3-dependent and -independent molecules specific for CD25+CD4+ natural regulatory T cells revealed by DNA microarray analysis. Int Immunol. 2006;18(8):1197–1209. doi: 10.1093/intimm/dxl060. [DOI] [PubMed] [Google Scholar]
- 13.Fu W, et al. A multiply redundant genetic switch ‘locks in’ the transcriptional signature of regulatory T cells. Nat Immunol. 2012;13(10):972–980. doi: 10.1038/ni.2420. [DOI] [PMC free article] [PubMed] [Google Scholar]
- 14.Samstein RM, et al. Foxp3 exploits a pre-existent enhancer landscape for regulatory T cell lineage specification. Cell. 2012;151(1):153–166. doi: 10.1016/j.cell.2012.06.053. [DOI] [PMC free article] [PubMed] [Google Scholar]
- 15.Zheng Y, et al. Regulatory T-cell suppressor program co-opts transcription factor IRF4 to control T(H)2 responses. Nature. 2009;458(7236):351–356. doi: 10.1038/nature07674. [DOI] [PMC free article] [PubMed] [Google Scholar]
- 16.Koch MA, et al. The transcription factor T-bet controls regulatory T cell homeostasis and function during type 1 inflammation. Nat Immunol. 2009;10(6):595–602. doi: 10.1038/ni.1731. [DOI] [PMC free article] [PubMed] [Google Scholar]
- 17.Cipolletta D, et al. PPAR-γ is a major driver of the accumulation and phenotype of adipose tissue Treg cells. Nature. 2012;486(7404):549–553. doi: 10.1038/nature11132. [DOI] [PMC free article] [PubMed] [Google Scholar]
- 18.Pfoertner S, et al. Signatures of human regulatory T cells: An encounter with old friends and new players. Genome Biol. 2006;7(7):R54. doi: 10.1186/gb-2006-7-7-r54. [DOI] [PMC free article] [PubMed] [Google Scholar]
- 19.Jeron A, et al. Frequency and gene expression profile of regulatory T cells in renal cell carcinoma. Tumour Biol. 2009;30(3):160–170. doi: 10.1159/000228909. [DOI] [PubMed] [Google Scholar]
- 20.Birzele F, et al. Next-generation insights into regulatory T cells: Expression profiling and FoxP3 occupancy in Human. Nucleic Acids Res. 2011;39(18):7946–7960. doi: 10.1093/nar/gkr444. [DOI] [PMC free article] [PubMed] [Google Scholar]
- 21.Buckner JH. Mechanisms of impaired regulation by CD4(+)CD25(+)FOXP3(+) regulatory T cells in human autoimmune diseases. Nat Rev Immunol. 2010;10(12):849–859. doi: 10.1038/nri2889. [DOI] [PMC free article] [PubMed] [Google Scholar]
- 22.Salomon B, et al. B7/CD28 costimulation is essential for the homeostasis of the CD4+CD25+ immunoregulatory T cells that control autoimmune diabetes. Immunity. 2000;12(4):431–440. doi: 10.1016/s1074-7613(00)80195-8. [DOI] [PubMed] [Google Scholar]
- 23.Chen Z, Herman AE, Matos M, Mathis D, Benoist C. Where CD4+CD25+ T reg cells impinge on autoimmune diabetes. J Exp Med. 2005;202(10):1387–1397. doi: 10.1084/jem.20051409. [DOI] [PMC free article] [PubMed] [Google Scholar]
- 24.Bettini ML, et al. Loss of epigenetic modification driven by the Foxp3 transcription factor leads to regulatory T cell insufficiency. Immunity. 2012;36(5):717–730. doi: 10.1016/j.immuni.2012.03.020. [DOI] [PMC free article] [PubMed] [Google Scholar]
- 25.Darce J, et al. An N-terminal mutation of the Foxp3 transcription factor alleviates arthritis but exacerbates diabetes. Immunity. 2012;36(5):731–741. doi: 10.1016/j.immuni.2012.04.007. [DOI] [PMC free article] [PubMed] [Google Scholar]
- 26.Tarbell KV, Yamazaki S, Olson K, Toy P, Steinman RM. CD25+ CD4+ T cells, expanded with dendritic cells presenting a single autoantigenic peptide, suppress autoimmune diabetes. J Exp Med. 2004;199(11):1467–1477. doi: 10.1084/jem.20040180. [DOI] [PMC free article] [PubMed] [Google Scholar]
- 27.Tang Q, et al. In vitro-expanded antigen-specific regulatory T cells suppress autoimmune diabetes. J Exp Med. 2004;199(11):1455–1465. doi: 10.1084/jem.20040139. [DOI] [PMC free article] [PubMed] [Google Scholar]
- 28.Pociot F, et al. Genetics of type 1 diabetes: What’s next? Diabetes. 2010;59(7):1561–1571. doi: 10.2337/db10-0076. [DOI] [PMC free article] [PubMed] [Google Scholar]
- 29.Tang Q, et al. Central role of defective interleukin-2 production in the triggering of islet autoimmune destruction. Immunity. 2008;28(5):687–697. doi: 10.1016/j.immuni.2008.03.016. [DOI] [PMC free article] [PubMed] [Google Scholar]
- 30.Ferraro A, et al. Expansion of Th17 cells and functional defects in T regulatory cells are key features of the pancreatic lymph nodes in patients with type 1 diabetes. Diabetes. 2011;60(11):2903–2913. doi: 10.2337/db11-0090. [DOI] [PMC free article] [PubMed] [Google Scholar]
- 31.Bacchetta R, et al. Defective regulatory and effector T cell functions in patients with FOXP3 mutations. J Clin Invest. 2006;116(6):1713–1722. doi: 10.1172/JCI25112. [DOI] [PMC free article] [PubMed] [Google Scholar]
- 32.Lindley S, et al. Defective suppressor function in CD4(+)CD25(+) T-cells from patients with type 1 diabetes. Diabetes. 2005;54(1):92–99. doi: 10.2337/diabetes.54.1.92. [DOI] [PubMed] [Google Scholar]
- 33.Feuerer M, et al. Enhanced thymic selection of FoxP3+ regulatory T cells in the NOD mouse model of autoimmune diabetes. Proc Natl Acad Sci USA. 2007;104(46):18181–18186. doi: 10.1073/pnas.0708899104. [DOI] [PMC free article] [PubMed] [Google Scholar]
- 34.Brusko TM, Wasserfall CH, Clare-Salzler MJ, Schatz DA, Atkinson MA. Functional defects and the influence of age on the frequency of CD4+ CD25+ T-cells in type 1 diabetes. Diabetes. 2005;54(5):1407–1414. doi: 10.2337/diabetes.54.5.1407. [DOI] [PubMed] [Google Scholar]
- 35.Putnam AL, Vendrame F, Dotta F, Gottlieb PA. CD4+CD25high regulatory T cells in human autoimmune diabetes. J Autoimmun. 2005;24(1):55–62. doi: 10.1016/j.jaut.2004.11.004. [DOI] [PubMed] [Google Scholar]
- 36.Long SA, et al. Defects in IL-2R signaling contribute to diminished maintenance of FOXP3 expression in CD4(+)CD25(+) regulatory T-cells of type 1 diabetic subjects. Diabetes. 2010;59(2):407–415. doi: 10.2337/db09-0694. [DOI] [PMC free article] [PubMed] [Google Scholar]
- 37.McClymont SA, et al. Plasticity of human regulatory T cells in healthy subjects and patients with type 1 diabetes. J Immunol. 2011;186(7):3918–3926. doi: 10.4049/jimmunol.1003099. [DOI] [PMC free article] [PubMed] [Google Scholar]
- 38.Hughson A, et al. Uncoupling of proliferation and cytokines from suppression within the CD4+CD25+Foxp3+ T-cell compartment in the 1st year of human type 1 diabetes. Diabetes. 2011;60(8):2125–2133. doi: 10.2337/db10-1661. [DOI] [PMC free article] [PubMed] [Google Scholar]
- 39.Schneider A, et al. The effector T cells of diabetic subjects are resistant to regulation via CD4+ FOXP3+ regulatory T cells. J Immunol. 2008;181(10):7350–7355. doi: 10.4049/jimmunol.181.10.7350. [DOI] [PMC free article] [PubMed] [Google Scholar]
- 40.Lawson JM, et al. Increased resistance to CD4+CD25hi regulatory T cell-mediated suppression in patients with type 1 diabetes. Clin Exp Immunol. 2008;154(3):353–359. doi: 10.1111/j.1365-2249.2008.03810.x. [DOI] [PMC free article] [PubMed] [Google Scholar]
- 41.Barreiro LB, Quintana-Murci L. From evolutionary genetics to human immunology: How selection shapes host defence genes. Nat Rev Genet. 2010;11(1):17–30. doi: 10.1038/nrg2698. [DOI] [PubMed] [Google Scholar]
- 42.Clark AG, et al. Inferring nonneutral evolution from human-chimp-mouse orthologous gene trios. Science. 2003;302(5652):1960–1963. doi: 10.1126/science.1088821. [DOI] [PubMed] [Google Scholar]
- 43.Raj T, et al. Common risk alleles for inflammatory diseases are targets of recent positive selection. Am J Hum Genet. 2013;92(4):517–529. doi: 10.1016/j.ajhg.2013.03.001. [DOI] [PMC free article] [PubMed] [Google Scholar]
- 44.Pai AA, et al. The contribution of RNA decay quantitative trait loci to inter-individual variation in steady-state gene expression levels. PLoS Genet. 2012;8(10):e1003000. doi: 10.1371/journal.pgen.1003000. [DOI] [PMC free article] [PubMed] [Google Scholar]
- 45.Stranger BE, De Jager PL. Coordinating GWAS results with gene expression in a systems immunologic paradigm in autoimmunity. Curr Opin Immunol. 2012;24(5):544–551. doi: 10.1016/j.coi.2012.09.002. [DOI] [PMC free article] [PubMed] [Google Scholar]
- 46.Deaglio S, et al. Adenosine generation catalyzed by CD39 and CD73 expressed on regulatory T cells mediates immune suppression. J Exp Med. 2007;204(6):1257–1265. doi: 10.1084/jem.20062512. [DOI] [PMC free article] [PubMed] [Google Scholar]
- 47.Borsellino G, et al. Expression of ectonucleotidase CD39 by Foxp3+ Treg cells: Hydrolysis of extracellular ATP and immune suppression. Blood. 2007;110(4):1225–1232. doi: 10.1182/blood-2006-12-064527. [DOI] [PubMed] [Google Scholar]
- 48.Segal E, et al. Module networks: identifying regulatory modules and their condition-specific regulators from gene expression data. Nat Genet. 2003;34(2):166–176. doi: 10.1038/ng1165. [DOI] [PubMed] [Google Scholar]
- 49.Churchill GA, Doerge RW. Empirical threshold values for quantitative trait mapping. Genetics. 1994;138(3):963–971. doi: 10.1093/genetics/138.3.963. [DOI] [PMC free article] [PubMed] [Google Scholar]
- 50.Raynor J, Lages CS, Shehata H, Hildeman DA, Chougnet CA. Homeostasis and function of regulatory T cells in aging. Curr Opin Immunol. 2012;24(4):482–487. doi: 10.1016/j.coi.2012.04.005. [DOI] [PMC free article] [PubMed] [Google Scholar]
- 51.Soler D, et al. CCR8 expression identifies CD4 memory T cells enriched for FOXP3+ regulatory and Th2 effector lymphocytes. J Immunol. 2006;177(10):6940–6951. doi: 10.4049/jimmunol.177.10.6940. [DOI] [PubMed] [Google Scholar]
- 52.Fernandez I, et al. CD101 surface expression discriminates potency among murine FoxP3+ regulatory T cells. J Immunol. 2007;179(5):2808–2814. doi: 10.4049/jimmunol.179.5.2808. [DOI] [PubMed] [Google Scholar]
- 53.Yu X, et al. The surface protein TIGIT suppresses T cell activation by promoting the generation of mature immunoregulatory dendritic cells. Nat Immunol. 2009;10(1):48–57. doi: 10.1038/ni.1674. [DOI] [PubMed] [Google Scholar]
- 54.Stanietsky N, et al. The interaction of TIGIT with PVR and PVRL2 inhibits human NK cell cytotoxicity. Proc Natl Acad Sci USA. 2009;106(42):17858–17863. doi: 10.1073/pnas.0903474106. [DOI] [PMC free article] [PubMed] [Google Scholar]
- 55.Lund JM, Hsing L, Pham TT, Rudensky AY. Coordination of early protective immunity to viral infection by regulatory T cells. Science. 2008;320(5880):1220–1224. doi: 10.1126/science.1155209. [DOI] [PMC free article] [PubMed] [Google Scholar]
- 56.Pace L, et al. Regulatory T cells increase the avidity of primary CD8+ T cell responses and promote memory. Science. 2012;338(6106):532–536. doi: 10.1126/science.1227049. [DOI] [PubMed] [Google Scholar]
- 57.Stranger BE, et al. Population genomics of human gene expression. Nat Genet. 2007;39(10):1217–1224. doi: 10.1038/ng2142. [DOI] [PMC free article] [PubMed] [Google Scholar]
- 58.Dimas AS, et al. Common regulatory variation impacts gene expression in a cell type-dependent manner. Science. 2009;325(5945):1246–1250. doi: 10.1126/science.1174148. [DOI] [PMC free article] [PubMed] [Google Scholar]
- 59.Cavanagh MM, Weyand CM, Goronzy JJ. Chronic inflammation and aging: DNA damage tips the balance. Curr Opin Immunol. 2012;24(4):488–493. doi: 10.1016/j.coi.2012.04.003. [DOI] [PMC free article] [PubMed] [Google Scholar]
- 60.Purcell S, et al. PLINK: A tool set for whole-genome association and population-based linkage analyses. Am J Hum Genet. 2007;81(3):559–575. doi: 10.1086/519795. [DOI] [PMC free article] [PubMed] [Google Scholar]
Associated Data
This section collects any data citations, data availability statements, or supplementary materials included in this article.