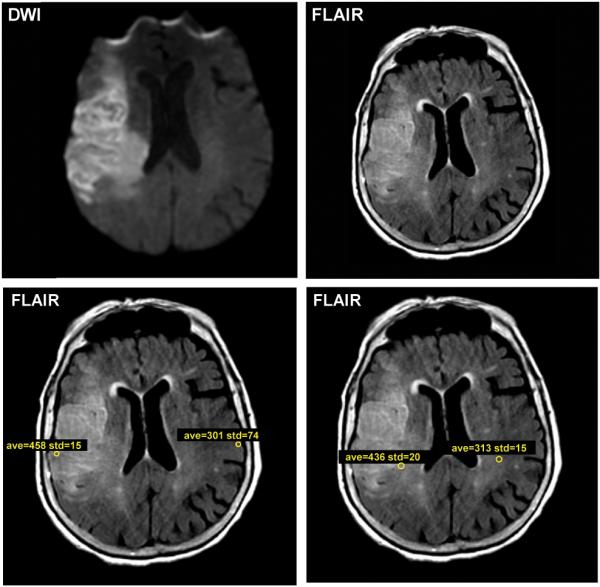
Figure 1. Representative example of the method for generating FLAIR ratio.

The FLAIR image was aligned with the DWI sequence. Within the stroke lesion on two contiguous slices, regions of interest (ROIs) in the ischemic white matter of the FLAIR sequence were drawn, and ROIs were mirrored onto the contralateral normal white matter (lower lefthand panel). A similar approach was used for gray matter (lower righthand panel). The final FLAIR ratio was calculated as the mean of all lesional FLAIR values to all contralateral FLAIR values, with a final value of 1.53 in this subject.
