Abstract
The purpose of this study was to apply a novel method to evaluate surgical outcomes at 1 year after orthognathic surgery for Class III patients undergoing two different surgical protocols. Fifty patients divided equally into two groups (maxillary advancement only and combined with mandibular setback) had cone beam computed tomography (CBCT) scans taken pre-surgery, at splint removal, and at 1-year post-surgery. An automatic cranial base superimposition method was used to register, and shape correspondence was applied to assess, the overall changes between pre-surgery and splint removal (surgical changes) and between splint removal and 1-year post-surgery at the end of orthodontic treatment (post-surgical adaptations). Post-surgical maxillary adaptations were exactly the same for both groups, with 52% of the patients having changes >2 mm. Approximately half of the post-surgical changes in the maxilla for both groups were vertical. The two-jaw group showed significantly greater surgical and post-surgical changes in the ramus, chin, and most of the condylar surfaces (P < 0.05). Post-surgical adaptation on the anterior part of the chin was also more significant in the two-jaw group (P < 0.05). Regardless of the type of surgery, marked post-surgical adaptations were observed in the regions evaluated, which explain the adequate maxillary–mandibular relationship at 1-year post-surgery on average, with individual variability.
Keywords: stability, Class III, orthognathic surgery
Introduction
Class III skeletal malocclusion can be corrected with orthodontic–surgical approaches, which, in addition to improving esthetics and function, are expected to be stable over time. For correction of skeletal Class III, hard tissue long-term follow-up with two-dimensional (2D) cephalometric analyses have shown that maxillary advancement only or advancement combined with mandibular setback are stable procedures1,2. However, despite improvements in surgical techniques for mandibular setback, post-operative stability still leaves something to be desired3.
Short and long-term three-dimensional (3D) superimposition studies using cone beam computed tomography (CBCT) have evaluated mandibular changes for Class II patients4,5. For Class III patients, Cevidanes et al.6 evaluated changes in the condyles and rami with the closest point distances method at 1 week after surgery. Other studies on surgical outcomes of jaw surgery have evaluated short-term soft and hard tissue changes with landmark coordinates and linear or angular measurements in anatomical crossections7,8. In 2011, Paniagua et al.9 introduced shape correspondence as a means of quantifying surgical displacements to the field of orthognathic surgery. Shape correspondence has previously been used to analyze brain morphology10 and condylar resorption11,12. This method does not rely on specific 2D or 3D landmarks or closest point surface distances, but aims to automatically obtain correspondence points in ‘before’ and ‘after’ surgery 3D models, and is able to quantify the changes that have occurred in three axes of space (x, y, z)9. The purpose of this study was to apply the shape correspondence technique to evaluate the 1-year post-operative stability of the maxillary–mandibular complex with two different surgery protocols in Class III patients.
Materials and methods
Fifty patients (23 male, 27 female, mean age 24.7 years) with Class III skeletal malocclusions were selected for this prospective study, which was approved by the Institutional Review Board of the University of North Carolina. All patients had a skeletal Class III jaw relationship with edge-to-edge or negative overjet. For each study participant, orthognathic surgical treatment was the most recommended treatment option to fully correct the malocclusion and skeletal imbalances. The patients were divided into two groups according to the type of surgery (25 patients in each group). The first group had maxillary advancement only and the second group had maxillary advancement combined with mandibular setback (bilateral sagittal split osteotomy); both groups were stabilized with rigid internal fixation. Patients with cleft lip and palate, syndromes, and disharmonies due to trauma were excluded.
CBCT images were acquired before surgery, at splint removal from 4 to 6 weeks after surgery, and at 1-year follow-up. The scanning protocol involved a 36-s full head exposure, using the NewTom 3G scanner (Aperio Services, Sarasota, FL, USA) with a 12-inch field of view. Ten patients had at least one CBCT taken with a NewTom 9000 (Aperio Services) with a 9-inch field of view. Due to this smaller field of view, either the chin or the condyles were missing in these patients. The voxel dimension was an isotropic 0.5 × 0.5 × 0.5 mm. During the scan all the subjects were biting a thin wax record to maintain centric occlusion.
After the CBCT acquisitions, semi-automatic segmentations were completed for the volumes using open-source software ITK-Snap13 (http://www.itksnap.org). This software allows the construction of models based on voxel gray scale intensity. To superimpose different time-points, all the post-surgical models were registered to the cranial base of the pre-surgery volume. The registration method consists of a fully automated voxel-wise rigid registration that compares and matches the intensities of the voxel gray scales at the cranial base between different time-points and relocates the image with 6 degrees of freedom14.
Point-distributed correspondent models of all the regions of interest were computed using SPHARM-PDM toolbox15. This method establishes correspondences based on the inherent geometry of the population.
Shape analyses and measurements of surgical outcomes were computed by subtracting pre- and post-surgery point-based correspondent models and were displayed via color-coded distance magnitude and vector maps (Fig. 1). The distance maps show the magnitude of the position changes between two point-based correspondent models, while the vector maps provide the directionality of these positional displacements. Positive and negative numbers represent outward and inward displacement, respectively. Thirteen regions of interest were selected (Fig. 2), and the largest displacement for each region was calculated for pre-surgery to splint removal (S1) and splint removal to 1-year post-surgery (S2).
Fig. 1.
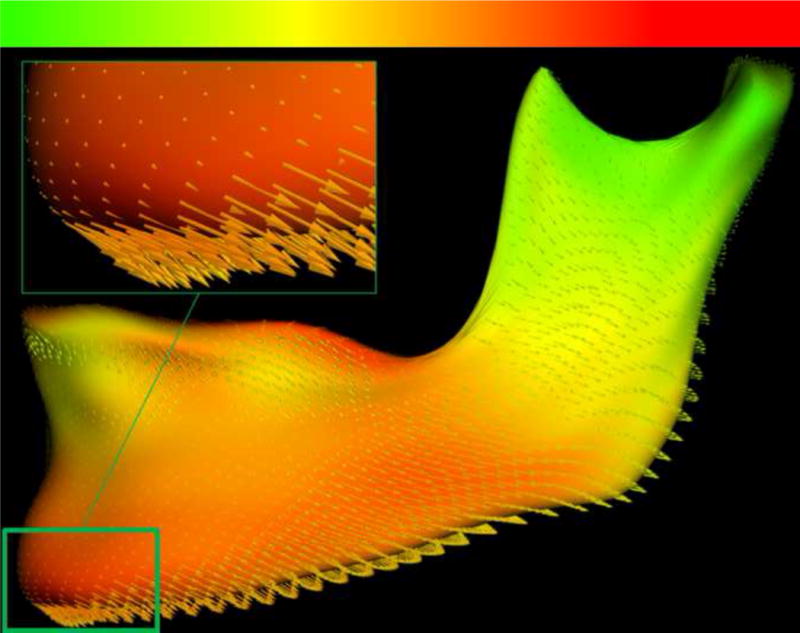
Magnitude of displacement is shown by the color map from green (0 mm) to red (5 mm). The directionality is expressed by the vector arrows.
Fig. 2.
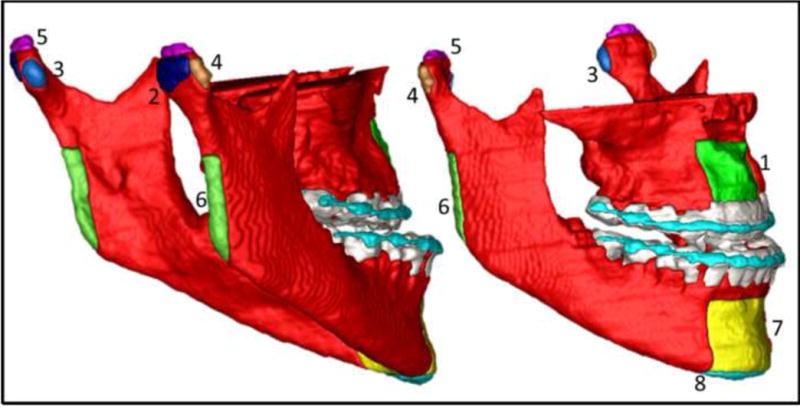
Regions of interest selected for the study: 1, maxilla; 2, right and left condyle posterior surface; 3, right and left condyle medial pole; 4, right and left condyle lateral pole; 5, right and left condyle superior surface; 6, right and left posterior border ramus; 7, anterior part of the chin; 8, inferior border of the mandible.
Statistical analysis
Analyses were done with SPSS 17.0 (Chicago, IL, USA). The greatest displacement for each anatomic region was measured in two superimpositions. To assess observer error, 10 randomly selected patients were measured twice by a single observer in a 10-day interval using intra-class correlation (ICC).
For each anatomic region, the independent Student's t-test was used to test whether there were statistically significant differences in the outcomes of the two types of surgery, (1) between pre-surgery and splint removal (surgical displacements, S1), and (2) between splint removal and 1 year post-surgery (post-surgical adaptations, S2). In addition, percentages of patients who experienced positive or negative displacement greater than 2 mm were calculated. Since the corresponding distances between the superimpositions have positive and negative signals that represent inward and outward movement rather than a single direction, descriptive statistics and the independent Student's t-test were done with the absolute value of the distances. Statistical significance was set at 0.05.
Results
The agreement between repeated measures was with all the areas having ICC coefficients greater than 0.90.
Descriptive statistics of displacement in each one of the regions of interest are shown in Tables 1 and 2 for S1 and S2, respectively.
Table 1.
Descriptive statistics for the greatest displacement at each anatomic region for superimposition 1 (pre-surgery to splint removal, S1).
| Anatomic surface | Type of surgery | n | Mean surface distances (mm) | SD |
|---|---|---|---|---|
| Maxilla | Maxilla-only | 24 | 6.78 | 2.32 |
| Two-jaw | 24 | 7.45 | 2.84 | |
| Right condyle posterior surface | Maxilla-only | 24 | 1.56 | 0.84 |
| Two-jaw | 23 | 1.96 | 0.90 | |
| Left condyle posterior surface | Maxilla-only | 24 | 1.89 | 0.92 |
| Two-jaw | 24 | 2.32 | 0.97 | |
| Right condyle medial pole | Maxilla-only | 24 | 1.54 | 0.80 |
| Two-jaw | 23 | 2.13 | 1.03 | |
| Left condyle medial pole | Maxilla-only | 24 | 1.69 | 0.84 |
| Two-jaw | 24 | 2.30 | 1.16 | |
| Right condyle lateral pole | Maxilla-only | 24 | 1.65 | 0.92 |
| Two-jaw | 23 | 2.08 | 0.75 | |
| Left condyle lateral pole | Maxilla-only | 24 | 1.50 | 0.67 |
| Two-jaw | 24 | 2.12 | 1.07 | |
| Right condyle superior surface | Maxilla-only | 24 | 1.52 | 0.91 |
| Two-jaw | 23 | 2.07 | 0.76 | |
| Left condyle superior surface | Maxilla-only | 24 | 1.61 | 0.69 |
| Two-jaw | 24 | 2.07 | 1.07 | |
| Right posterior border ramus | Maxilla-only | 24 | 2.64 | 1.83 |
| Two-jaw | 24 | 4.35 | 2.01 | |
| Left posterior border ramus | Maxilla-only | 24 | 3.27 | 1.65 |
| Two-jaw | 24 | 5.53 | 1.81 | |
| Anterior surface of the chin | Maxilla-only | 22 | 3.43 | 1.92 |
| Two-jaw | 18 | 8.73 | 2.92 | |
| Inferior border of the chin | Maxilla-only | 19 | 4.44 | 2.84 |
| Two-jaw | 12 | 10.22 | 4.31 |
Table 2.
Descriptive statistics for the greatest displacement at each anatomic region for superimposition 3 (splint removal to 1 year post-surgery, S2).
| Anatomic surface | Type of surgery | n | Mean surface distance (mm) | SD |
|---|---|---|---|---|
| Maxilla | Maxilla-only | 23 | 2.31 | 1.09 |
| Two-jaw | 21 | 2.02 | 0.76 | |
| right condyle posterior surface | Maxilla-only | 24 | 1.43 | 0.76 |
| Two-jaw | 23 | 1.86 | 0.74 | |
| Left condyle posterior surface | Maxilla-only | 24 | 1.44 | 0.61 |
| Two-jaw | 24 | 2.06 | 0.88 | |
| Right condyle medial pole | Maxilla-only | 24 | 1.37 | 0.76 |
| Two-jaw | 23 | 2.03 | 1.09 | |
| Left condyle medial pole | Maxilla-only | 24 | 1.33 | 0.86 |
| Two-jaw | 24 | 1.98 | 0.91 | |
| Right condyle lateral pole | Maxilla-only | 24 | 1.43 | 0.78 |
| Two-jaw | 23 | 1.86 | 0.75 | |
| Left condyle lateral pole | Maxilla-only | 24 | 1.57 | 0.89 |
| Two-jaw | 24 | 1.93 | 1.16 | |
| Right condyle superior surface | Maxilla-only | 24 | 1.43 | 0.91 |
| Two-jaw | 23 | 1.83 | 0.73 | |
| Left condyle superior surface | Maxilla-only | 24 | 1.49 | 0.53 |
| Two-jaw | 24 | 2.05 | 0.82 | |
| Right posterior border ramus | Maxilla-only | 24 | 2.14 | 1.07 |
| Two-jaw | 24 | 3.34 | 2.60 | |
| Left posterior border ramus | Maxilla-only | 24 | 2.11 | 1.39 |
| Two-jaw | 24 | 3.64 | 1.59 | |
| Anterior surface of the chin | Maxilla-only | 22 | 2.80 | 1.35 |
| Two-jaw | 18 | 4.15 | 2.71 | |
| Inferior border of the chin | Maxilla-only | 19 | 2.77 | 1.51 |
| Two-jaw | 12 | 3.63 | 2.44 |
Maxilla-only surgery group
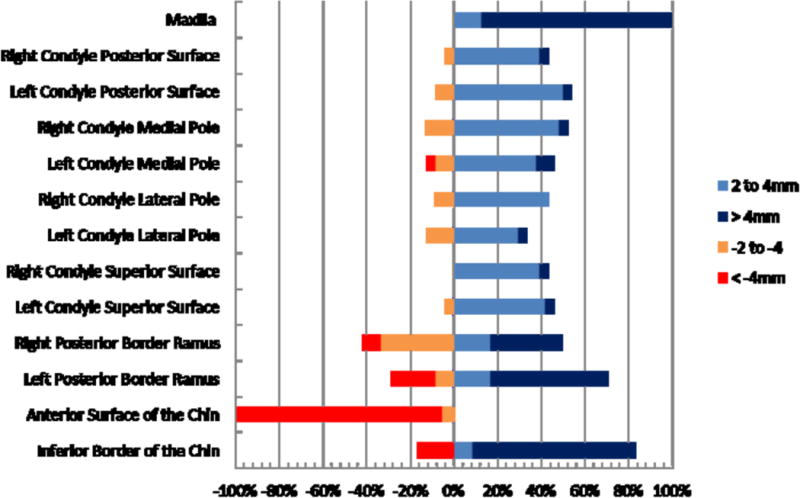
In the maxilla-only surgery group (Figs. 3 and 4), the maxillary region was displaced forward and downward or upward more than 4 mm for 96% (mean displacement 6.78 mm ± 2.32 mm) of the patients in S1. Post-surgical adaptations (S2) included mostly vertical changes of 2 to 4 mm or −2 to −4 mm for 39% of the cases, and >4 mm or <−4 mm for 13% of the patients, and there were greater horizontal and vertical components for negative and positive values, respectively.
Fig. 3.
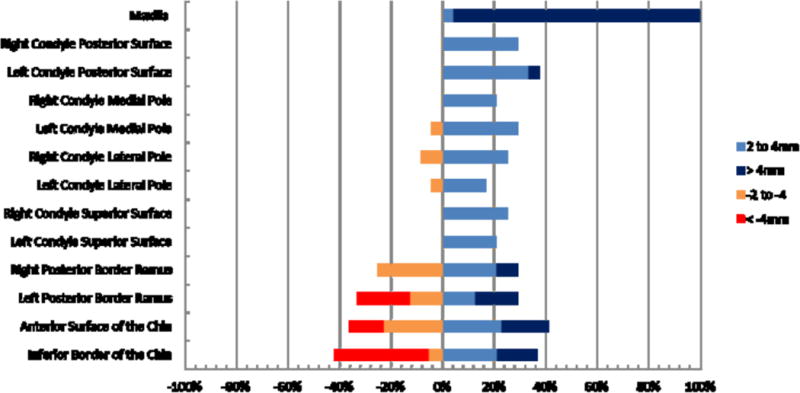
Percentage of patients with changes (>2 mm and <−2 mm) between pre-surgery and splint removal (S1) for each anatomic region. Maxilla-only group.
Fig. 4.
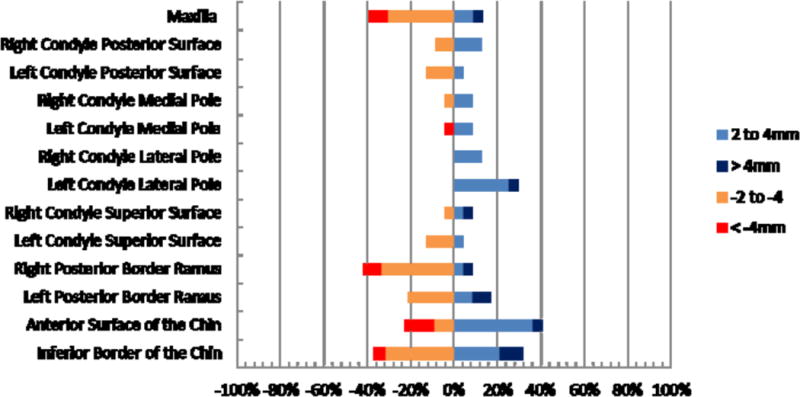
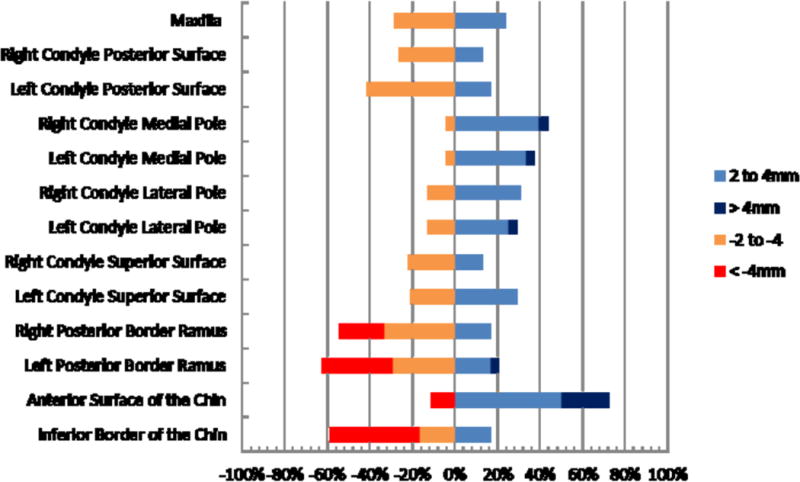
Percentage of patients with changes (>2 mm and <−2 mm) between splint removal and 1 year post-surgery (S2) for each anatomic region. Maxilla-only group.
Surgical movements (S1) >2 mm and <−2 mm of the left and right condyles in the maxilla-only surgery group occurred in 33% of the cases at the posterior surface, in 27% of the cases at the medial and lateral condylar poles, and in 23% of the cases at the superior surface. Post-surgical adaptations (S2) >2 mm and <−2 mm at the posterior condylar surface occurred in 19% of the cases, in 12% and 21% of the cases at the medial and lateral poles, respectively, and in 15% of the cases at the superior surface (Fig. 5). The left and right posterior ramus borders presented post-surgical adaptation changes >2 mm and <−2 mm, respectively, in 38% and 50% of the cases in S2. The chin and inferior border of the mandible were the regions with greatest post-surgical adaptation in S2, showing adaptive displacements >2 mm or <−2 mm in 64% and 68% of the cases, respectively.
Fig. 5.
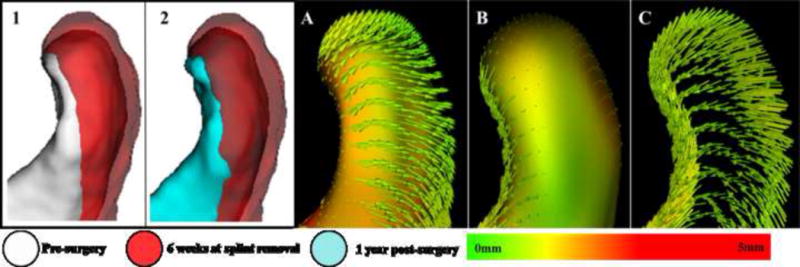
Example of condylar displacement in a maxilla-only surgery patient. 1 and 2: semi-transparency of condylar changes in two different superimpositions. In 1 the condyle is moved postero-superiorly, and in 2 the condyle has returned to approximately the original position. A: condyle model of T1 and vectors showing changes to T2. B: condyle model of T2 and vectors showing changes to T3. C: only the vectors from image B showing its inward movement. This patient had an approximate 2.5 mm of movement in opposite directions for A and B at the posterior and superior condylar surfaces.
Two-jaw surgery group
In the two-jaw group (Figs. 6 and 7), the maxillary region was advanced more than 4 mm for all patients in S1 (mean displacement 7.45 mm ± 2.84 mm). Post-surgical adaptations >4 mm in the maxillary position were not experienced, and changes between 2 and 4 mm occurred in 52% of the cases.
Fig. 6.
Percentage of patients with changes (>2 mm and <−2 mm) between pre-surgery and splint removal (S1) for each anatomic region. Two-jaw group.
Fig. 7.
Percentage of patients with changes (>2 mm and <−2 mm) between splint removal and 1 year post-surgery (S3) for each anatomic region. Two-jaw group.
Surgical movements (S1) of the condyles in the two-jaw surgery group often led to some degree of antero-posterior and lateral condylar rotation. Surgical movements of >2 mm and <−2 mm occurred in 55% of the patients at the posterior surface of the condyles, in 62% and 49% of the cases at the medial and lateral condylar poles, respectively, and in 42% of the cases at the superior surface (Fig. 8). The left and right posterior ramus borders presented >2 mm and <−2 mm movements with surgery in 96% of the cases and post-surgical adaptive changes in 77% of the cases. The chin and inferior border of the mandible were the regions with greatest post-surgical adaptation in S2, showing adaptive changes >2 mm or <−2 mm in 83% (mean 4.15 mm ± 2.71 mm) and 75% (mean 3.63 mm ± 2.44 mm) of the cases, respectively.
Fig. 8.
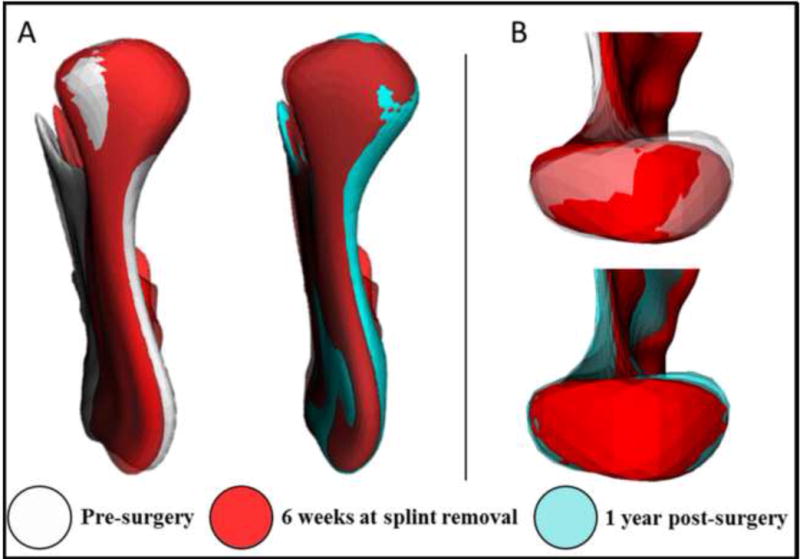
Two-jaw surgery patient. A: posterior view of the ramus showing lateral displacement. B: superior view of the condyle of the same patient showing its rotation. Note that the medial pole is displaced more than the lateral pole for surgical movements and post-surgical adaptation.
The Student's t-test indicated that changes at the ramus and the anterior surface of the chin were significantly different in the two types of surgical procedure, both for the surgical movements (Table 3) and the post-surgical adaptive changes (Table 4). The mean condylar change differences between the two groups were smaller than 0.6 mm for all condylar anatomic regions. Maxillary changes with surgery and post-surgical adaptations were not statistically different when the two groups were compared.
Table 3.
Comparison of pre-surgery to splint removal. Changes with two-jaw surgery by maxillary advancement only, using the independent Student's t-test.
| Anatomic surface | Mean difference (mm) | Standard error of the difference | 95% CI of the mean | P-value | |
|---|---|---|---|---|---|
| Maxilla | −0.67 | 0.75 | −2.18 | 0.84 | 0.38 |
| Right condyle posterior surface | −0.40 | 0.25 | −0.91 | 0.11 | 0.12 |
| Left condyle posterior surface | −0.44 | 0.27 | −0.98 | 0.11 | 0.12 |
| Right condyle medial pole | −0.60 | 0.27 | −1.14 | −0.06 | 0.03a |
| Left condyle medial pole | −0.61 | 0.29 | −1.20 | −0.02 | 0.04a |
| Right condyle lateral pole | −0.43 | 0.25 | −0.93 | 0.06 | 0.09 |
| Left condyle lateral pole | −0.62 | 0.26 | −1.13 | −0.10 | 0.02a |
| Right condyle superior surface | −0.54 | 0.25 | −1.04 | −0.05 | 0.03a |
| Left condyle superior surface | −0.46 | 0.26 | −0.98 | 0.06 | 0.08 |
| Right posterior border ramus | −1.72 | 0.55 | −2.83 | −0.60 | 0.00a |
| Left posterior border ramus | −2.26 | 0.50 | −3.27 | −1.25 | 0.00a |
| Anterior surface of the chin | −5.29 | 0.77 | −6.85 | −3.74 | 0.00a |
| Inferior border of the chin | −5.78 | 1.28 | −8.40 | −3.16 | 0.00a |
95% CI, 95% confidence interval.
P ≤ 0.05, statistically significant.
Table 4.
Comparison of splint removal to 1 year post-surgery. Changes with two-jaw surgery by maxillary advancement only, using the independent Student's t-test.
| Anatomic surface | Mean difference (mm) | Standard error of the difference | 95% CI of mean | P-value | |
|---|---|---|---|---|---|
| Maxilla | 0.29 | 0.29 | −0.29 | 0.87 | 0.32 |
| Right condyle posterior surface | −0.43 | 0.22 | −0.87 | 0.01 | 0.05a |
| Left condyle posterior surface | −0.61 | 0.22 | −1.05 | −0.17 | 0.01a |
| Right condyle medial pole | −0.66 | 0.27 | −1.21 | −0.10 | 0.02a |
| Left condyle medial pole | −0.65 | 0.26 | −1.16 | −0.14 | 0.01a |
| Right condyle lateral pole | −0.44 | 0.22 | −0.89 | 0.01 | 0.06 |
| Left condyle lateral pole | −0.36 | 0.30 | −0.96 | 0.24 | 0.23 |
| Right condyle superior surface | −0.40 | 0.24 | −0.88 | 0.09 | 0.11 |
| Left condyle superior surface | −0.56 | 0.20 | −0.96 | −0.16 | 0.01a |
| Right posterior border ramus | −1.20 | 0.57 | −2.36 | −0.05 | 0.04a |
| Left posterior border ramus | −1.53 | 0.43 | −2.40 | −0.66 | 0.00a |
| Anterior surface of the chin | −1.35 | 0.66 | −2.68 | −0.02 | 0.05a |
| Inferior border of the chin | −0.85 | 0.71 | −2.30 | 0.59 | 0.24 |
95% CI, 95% confidence interval.
P≤ 0.05, statistically significant.
Discussion
This study compared stability after correction of Class III malocclusion with maxillary advancement only to two-jaw surgery, by using a new technique for 3D evaluation of stability post-surgery.
The superimposition method applied here14 is different from other studies that have used coordinates16,17 and partial structures for registration18. By using the entire cranial base as a reference, both the inclination and position in three planes of space are corrected. All 3D superimposition measurements in this study refer to displacements and/or bone remodeling that describe overall facial changes relative to the cranial base.
With mandibular setback, post-surgical stability likely is a technical problem. The 3D superimpositions in the present study clearly show that during surgery, if the chin is moved back, but the gonial angle is also pushed back, the musculature usually returns the ramus to its original orientation, and the chin is displaced forward post-surgically (Fig. 9). The 2D cephalometric stability studies of two-jaw Class III treatment in the last decade provide some evidence that the technical problem in setting mandibles back has largely been overcome using two-jaw surgical procedures19. Problematic stability in moving the maxilla down is due largely to changes within the first few post-surgical weeks, before bone healing is complete, as occlusal force tends to push it upward (Fig. 10). There are three logical approaches to maintaining the position of the maxilla until it heals: heavy rigid fixation, a rigid hydroxyl apatite graft in the defect created by the downward movement, and simultaneous mandibular surgery to decrease the occlusal force. All are reasonably successful, but the rigid fixation has to be much heavier than typical plates and screws and is still not completely effective. An initially rigid but ultimately resorbable graft, rather than one like hydroxyl apatite that persists indefinitely, is likely to become available in the near future and would be preferred19. Improved stability has been demonstrated in patients (usually Class III) in whom downward movement of the maxilla is combined with a mandibular ramus osteotomy2,19. Autogenous bone graft could also be used to improve stability, but there are some disadvantages such as requiring a secondary surgical site, difficulty in shaping the graft, the physiologic process of remodeling and resorption during the healing, and the amount of bone needed20,21.
Fig. 9.
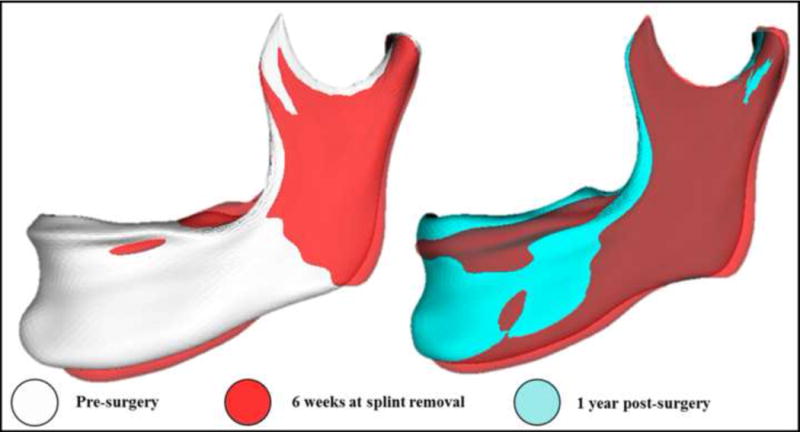
Gonial angle pushed back after surgery and returning to its initial position.
Fig. 10.
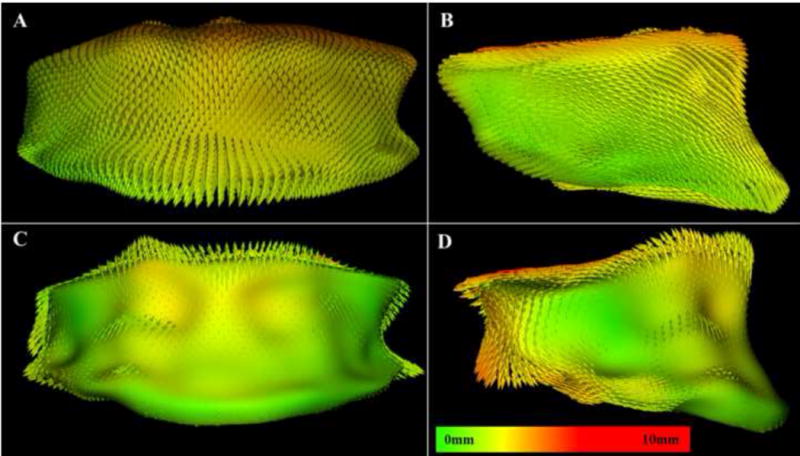
Example of maxillary vertical relapse. A and B: vectors representing forward and downward movement of the maxilla from T1 to T2. C and D: vectors from T2 to T3 showing that the post-surgical adaptation was mostly vertical (approximately 4 mm).
Quantifying pre- and post-surgery changes with CBCT by means of 3D closest point surface distances has allowed visual assessment of color maps4–6. This method works very well for linear movements in one axis; however, when rotation or large displacements occur, the measurements could be affected because the closest point will measure the smallest surface distances between ‘before’ and ‘after’ surgery models that do not necessarily imply anatomical correspondence. On the other hand, the shape-based SPHARM-PDM correspondence method used by Paniagua et al.9 has been validated and shown to accurately identify and quantify critical attributes of the surgical correction in a study using surgical simulation. In the current study, the same idea was applied for real surgeries on another sample of patients.
Another feature provided by shape correspondence analysis is information on the directionality of the movement. Vector color maps show the before-to-after movements between correspondent structures, visually demonstrating their rotation or translation. Such information was not provided by the other quantitative methodologies that have been used previously.
The mandibular and maxillary post-surgical movements reported in this study are larger than those of other studies using 2D or 3D images8,19,22. A possible explanation for this finding could be the fact that those studies did not measure displacements in the three planes of space (3D vectors), and instead refer to projected distances of horizontal and vertical components of 3D movements, often leaving out the assessment of lateral displacements. In addition the results reported by Kim et al.8 refer to findings 6 months after surgery. Most of the surgical adaptations occur within the first 6 months after surgery23, but post-surgical adaptations continue, particularly during the first year post-surgery24.
Both groups in this study presented post-surgical adaptations greater than 2 mm of the mandible and maxilla in nearly half of the cases, with a predominantly vertical component in the vectors of displacement. While in the two-jaw group post-surgical changes greater than 4 mm were not observed in the maxillary position, in the maxilla-only surgery group, 13% of the patients had changes greater than 4 mm. These results did not necessarily mean antero-posterior relapse. In previous studies, different authors have reported3,19,24 that downward rotational movements of the maxilla can increase vertical relapse without leading to antero-posterior relapse. The mandible adapts to this movement with clockwise or counter-clockwise rotation19,24,25, or crossbite. Similar findings were observed in the present study for some cases, as shown in Fig. 11.
Fig. 11.
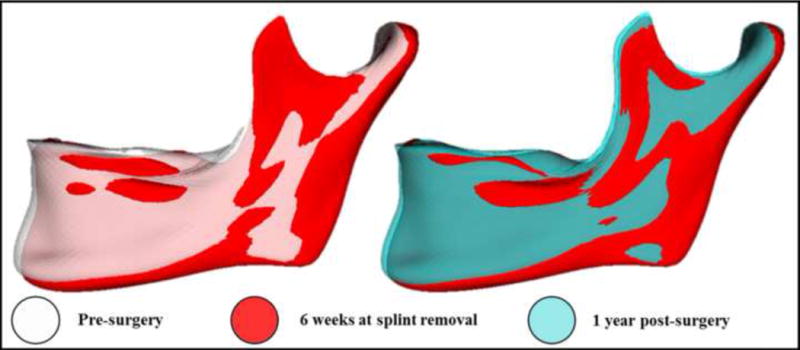
Clockwise rotation after surgery due to maxillary repositioning and counterclockwise rotation after maxillary post-surgical adaptation.
Our findings on condylar movement corroborate previous reports of posterior displacement after bilateral sagittal split osteotomy for Class III patients. After a few months, the condyles tend to return to their initial position7,8. In the present study, even though the mandible was set back and not advanced, we observed similar condylar adaptations as reported by Carvalho et al.4 when the mandible is advanced for Class II patients. In this study, some of the condyle surfaces did not present statistically significant differences between the surgery groups. Clinically, however, the type of movement was clearly different. In addition to the postero-superior movement, the two-jaw surgery patients often showed rotation of the proximal segment. This rotation of the proximal segment in sagittal split osteotomies has been described in previous studies as due to: changes in the condyles and rami area22,26, and related with the rotation of the proximal segment. Using computerized tomograms, Spitzer et al. observed that the lateral and medial condylar poles tend to move (the lateral pole anteriorly and the medial pole posteriorly)27 because of forces applied by a screwdriver during the fixation28. Other explanations include the use of screws that result in torque if there is a gap between the proximal and distal segments29, and the effect of rigid internal fixation30,31. In two-jaw surgery, even though we had anticipated better control of ramus inclination, the ramus was still likely to be pushed posteriorly when the mandible was set back, and recovery of the ramus inclination change was a major component of forward movement of the chin after two-jaw surgery. Additionally, upward movement of the maxilla in some patients allows the chin to rotate upwards and forwards post-surgically.
In summary, marked post-surgical adaptations were observed for the regions of interest evaluated in the present study in both groups, with individual variability. At 1-year post-surgery, the stability of the maxillary advancement was the same regardless of the type of surgery. Despite some instability in the mandibular correction, the two-jaw surgery group still had greater correction of the mandibular position compared to the maxilla-only surgery group, where only autorotation changes occurred. Long-term follow-up at 3 and 5 years post-surgery will elucidate the pattern of bone remodeling and displacement beyond the completion of orthodontic treatment.
Acknowledgments
Funding: NIH grants DE-017727 and DE-018962 from NIDCR.
Ethical approval: The work has been approved by the University's Institutional Review Board Office, Study #03-1642. Subjects gave informed consent to participate in the study.
Footnotes
Competing interests: None declared.
Publisher's Disclaimer: This is a PDF file of an unedited manuscript that has been accepted for publication. As a service to our customers we are providing this early version of the manuscript. The manuscript will undergo copy editing, typesetting, and review of the resulting proof before it is published in its final citable form. Please note that during the production process errors may be discovered which could affect the content, and all legal disclaimers that apply to the journal pertain.
References
- 1.Proffit WR, Phillips C, Prewitt JW, Turvey TA. Stability after surgical–orthodontic correction of skeletal Class III malocclusion. 2. Maxillary advancement. Int J Adult Orthodon Orthognath Surg. 1991;6:71–80. [PubMed] [Google Scholar]
- 2.Proffit WR, Phillips C, Turvey TA. Stability after surgical–orthodontic corrective of skeletal Class III malocclusion. 3. Combined maxillary and mandibular procedures. Int J Adult Orthodon Orthognath Surg. 1991;6:211–225. [PubMed] [Google Scholar]
- 3.Proffit WR, Phillips C, Turvey TA. Stability after mandibular setback: mandible-only versus 2-jaw surgery. J Oral Maxillofac Surg. 2012;70:e408–414. doi: 10.1016/j.joms.2012.01.006. [DOI] [PMC free article] [PubMed] [Google Scholar]
- 4.Carvalho Fde A, Cevidanes LH, da Motta AT, Almeida MA, Phillips C. Three-dimensional assessment of mandibular advancement 1 year after surgery. Am J Orthod Dentofacial Orthop. 2010;137(4 Suppl):S53. doi: 10.1016/j.ajodo.2010.01.017. e1–12; discussion S53–55. [DOI] [PMC free article] [PubMed] [Google Scholar]
- 5.Motta AT, Cevidanes LH, Carvalho FA, Almeida MA, Phillips C. Three-dimensional regional displacements after mandibular advancement surgery: one year of follow-up. J Oral Maxillofac Surg. 2011;69:1447–1457. doi: 10.1016/j.joms.2010.07.018. [DOI] [PMC free article] [PubMed] [Google Scholar]
- 6.Cevidanes LH, Bailey LJ, Tucker SF, Styner MA, Mol A, Phillips CL, et al. Three-dimensional cone-beam computed tomography for assessment of mandibular changes after orthognathic surgery. Am J Orthod Dentofacial Orthop. 2007;131:44–50. doi: 10.1016/j.ajodo.2005.03.029. [DOI] [PMC free article] [PubMed] [Google Scholar]
- 7.Kim YI, Jung YH, Cho BH, Kim JR, Kim SS, Son WS, et al. The assessment of the short- and long-term changes in the condylar position following sagittal split ramus osteotomy (SSRO) with rigid fixation. J Oral Rehabil. 2010;37:262–270. doi: 10.1111/j.1365-2842.2009.02056.x. [DOI] [PubMed] [Google Scholar]
- 8.Kim YI, Cho BH, Jung YH, Son WS, Park SB. Cone-beam computerized tomography evaluation of condylar changes and stability following two-jaw surgery: Le Fort I osteotomy and mandibular setback surgery with rigid fixation. Oral Surg Oral Med Oral Pathol Oral Radiol Endod. 2011;111:681–687. doi: 10.1016/j.tripleo.2010.08.001. [DOI] [PubMed] [Google Scholar]
- 9.Paniagua B, Cevidanes L, Zhu H, Styner M. Outcome quantification using SPHARM-PDM toolbox in orthognathic surgery. Int J Comput Assist Radiol Surg. 2011;6:617–626. doi: 10.1007/s11548-010-0539-z. [DOI] [PMC free article] [PubMed] [Google Scholar]
- 10.Gerig G, Styner M, Jones D, Weinberger D, L J. Shape analysis of brain ventricles using spharm. Mathematical Methods in Biomedical Image Analysis. 2001:171–178. [Google Scholar]
- 11.Cevidanes LH, Hajati AK, Paniagua B, Lim PF, Walker DG, Palconet G, et al. Quantification of condylar resorption in temporomandibular joint osteoarthritis. Oral Surg Oral Med Oral Pathol Oral Radiol Endod. 2010;110:110–117. doi: 10.1016/j.tripleo.2010.01.008. [DOI] [PMC free article] [PubMed] [Google Scholar]
- 12.Paniagua B, Cevidanes L, Walker D, Zhu H, Guo R, Styner M. Clinical application of SPHARM-PDM to quantify temporomandibular joint osteoarthritis. Comput Med Imaging Graph. 2011;35:345–352. doi: 10.1016/j.compmedimag.2010.11.012. [DOI] [PMC free article] [PubMed] [Google Scholar]
- 13.Yushkevich PA, Piven J, Hazlett HC, Smith RG, Ho S, Gee JC, et al. User-guided 3D active contour segmentation of anatomical structures: significantly improved efficiency and reliability. Neuroimage. 2006;31:1116–1128. doi: 10.1016/j.neuroimage.2006.01.015. [DOI] [PubMed] [Google Scholar]
- 14.Cevidanes LH, Bailey LJ, Tucker GR, Jr, Styner MA, Mol A, Phillips CL, et al. Superimposition of 3D cone-beam CT models of orthognathic surgery patients. Dentomaxillofac Radiol. 2005;34:369–375. doi: 10.1259/dmfr/17102411. [DOI] [PMC free article] [PubMed] [Google Scholar]
- 15.Styner M, Oguz I, Xu S, Brechbuhler C, Pantazis D, Levitt JJ, et al. Framework for the statistical shape analysis of brain structures using SPHARM-PDM. Insight J. 2006:242–250. [PMC free article] [PubMed] [Google Scholar]
- 16.Kim NK, Lee C, Kang SH, Park JW, Kim MJ, Chang YI. A three-dimensional analysis of soft and hard tissue changes after a mandibular setback surgery. Comput Methods Programs Biomed. 2006;83:178–187. doi: 10.1016/j.cmpb.2006.06.009. [DOI] [PubMed] [Google Scholar]
- 17.Vasir NS, Thompson RT, Davies TM. Dental and skeletal changes following sagittal split osteotomy for correction of mandibular prognathism. Eur J Orthod. 1991;13:134–142. doi: 10.1093/ejo/13.2.134. [DOI] [PubMed] [Google Scholar]
- 18.Jung YJ, Kim MJ, Baek SH. Hard and soft tissue changes after correction of mandibular prognathism and facial asymmetry by mandibular setback surgery: three-dimensional analysis using computerized tomography. Oral Surg Oral Med Oral Pathol Oral Radiol Endod. 2009;107:763–771. e8. doi: 10.1016/j.tripleo.2008.12.026. [DOI] [PubMed] [Google Scholar]
- 19.Proffit WR, Turvey TA, Phillips C. The hierarchy of stability and predictability in orthognathic surgery with rigid fixation: an update and extension. Head Face Med. 2007;3:21. doi: 10.1186/1746-160X-3-21. [DOI] [PMC free article] [PubMed] [Google Scholar]
- 20.Braun TW, Sotereanos GC. Autogenous regional bone grafting as an adjunct in orthognathic surgery. J Oral Maxillofac Surg. 1984;42:43–48. doi: 10.1016/0278-2391(84)90394-x. [DOI] [PubMed] [Google Scholar]
- 21.Mehra P, Castro V, Freitas RZ, Wolford LM. Stability of the Le Fort I osteotomy for maxillary advancement using rigid fixation and porous block hydroxyapatite grafting. Oral Surg Oral Med Oral Pathol Oral Radiol Endod. 2002;94:18–23. doi: 10.1067/moe.2002.126076. [DOI] [PubMed] [Google Scholar]
- 22.Choi HS, Rebellato J, Yoon HJ, Lund BA. Effect of mandibular setback via bilateral sagittal split ramus osteotomy on transverse displacement of the proximal segment. J Oral Maxillofac Surg. 2005;63:908–916. doi: 10.1016/j.joms.2004.06.064. [DOI] [PubMed] [Google Scholar]
- 23.Schendel SA, Epker BN. Results after mandibular advancement surgery: an analysis of 87 cases. J Oral Surg. 1980;38:265–282. [PubMed] [Google Scholar]
- 24.Bailey LJ, Duong HL, Proffit WR. Surgical Class III treatment: long-term stability and patient perceptions of treatment outcome. Int J Adult Orthodon Orthognath Surg. 1998;13:35–44. [PubMed] [Google Scholar]
- 25.Proffit WR, Turvey TA, Phillips C. Orthognathic surgery: a hierarchy of stability. Int J Adult Orthodon Orthognath Surg. 1996;11:191–204. [PubMed] [Google Scholar]
- 26.Ueki K, Marukawa K, Shimada M, Nakagawa K, Yamamoto E. Change in condylar long axis and skeletal stability following sagittal split ramus osteotomy and intraoral vertical ramus osteotomy for mandibular prognathia. J Oral Maxillofac Surg. 2005;63:1494–1499. doi: 10.1016/j.joms.2005.06.013. [DOI] [PubMed] [Google Scholar]
- 27.Spitzer W, Rettinger G, Sitzmann F. Computerized tomography examination for the detection of positional changes in the temporomandibular joint after ramus osteotomies with screw fixation. J Maxillofac Surg. 1984;12:139–142. doi: 10.1016/s0301-0503(84)80230-1. [DOI] [PubMed] [Google Scholar]
- 28.Proffit WR, White RP, Sarver DM. Contemporary treatment of dentofacial deformity. St. Louis, MO: Mosby; 2003. [Google Scholar]
- 29.Arnett GW. A redefinition of bilateral sagittal osteotomy (BSO) advancement relapse. Am J Orthod Dentofacial Orthop. 1993;104:506–515. doi: 10.1016/0889-5406(93)70076-Z. [DOI] [PubMed] [Google Scholar]
- 30.Angle AD, Rebellato J, Sheats RD. Transverse displacement of the proximal segment after bilateral sagittal split osteotomy advancement and its effect on relapse. J Oral Maxillofac Surg. 2007;65:50–59. doi: 10.1016/j.joms.2005.11.117. [DOI] [PubMed] [Google Scholar]
- 31.Harris MD, Van Sickels JE, Alder M. Factors influencing condylar position after the bilateral sagittal split osteotomy fixed with bicortical screws. J Oral Maxillofac Surg. 1999;57:650–654. doi: 10.1016/s0278-2391(99)90422-6. discussion 654–655. [DOI] [PubMed] [Google Scholar]


