

Abstract
Stimuli-responsive hydrogels have enormous potential in drug delivery applications. They can be used for site-specific drug delivery due to environmental variables in the body such as pH and temperature. In this study, we have developed pH-responsive microgels for the delivery of doxorubicin (DOX) in order to optimize its anti-tumor activity while minimizing its systemic toxicity. We used a copolymer of oligo(polyethylene glycol) fumarate (OPF) and sodium methacrylate (SMA) to fabricate the pH-responsive microgels. We demonstrated that the microgels were negatively charged, and the amounts of charge on the microgels were correlated with the SMA concentration in their formulation. The resulting microgels exhibited sensitivity to the pH and ionic strength of the surrounding environment. We demonstrated that DOX was efficiently loaded into the microgels and released in a controlled fashion via an ion-exchange mechanism. Our data revealed that the DOX release was influenced by the pH and ionic strength of the solution. Moreover, we designed a phenomenological mathematical model, based on a stretched exponential function, to quantitatively analyze the cumulative release of DOX. We found a linear correlation between the maximum release of DOX calculated from the model and the SMA concentration in the microgel formulation. The anti-tumor activity of the released DOX was assessed using a human chordoma cell line. Our data revealed that OPF–SMA microgels prolonged the cell killing effect of DOX.
Keywords: pH-responsive, Doxorubicin, Microgels, Chordoma, Oligo(polyethylene glycol) fumarate
1. Introduction
The heterogeneous blood supply and interstitial pressure in solid tumors can limit drug penetration and dispersion throughout the tumor. Because of this, researchers have evaluated local and regional chemotherapy as either a primary or adjuvant approach to control malignancies [1]. A clinical study has shown that 50% of solid tumors responded to treatment with intratumoral chemotherapy using an injectable gel to administer the drug into the tumors [2]. Polymers have been used to tailor drug release so that the drug concentration is maintained within the desired therapeutic range. However, conventional drug delivery methods are insensitive to metabolic changes in the body. They physically entrap molecules within a polymer lattice; the drug is then released slowly by diffusion or upon degradation of the network. These methods typically result in an early peak in plasma drug concentration, followed by a linear release. Tumor-targeting approaches have been developed for improved efficacy and reduced toxicity by altering the biodistribution of cancer drugs and by using specific cell surface interactions [3,4]. Stimuli-responsive polymers are examples of novel anticancer drug delivery systems designed to overcome the limitations of conventional drug delivery systems. These stimuli include pH, ionic strength and the presence of metabolic chemicals (e.g. enzymes or antigens) [5–9]. Some of the most recent drug carriers respond to stimuli such as light, radiation, ultrasound and magnetic or electrical fields [10–12].
pH-responsive polymers have attracted much attention in the field of drug and gene delivery [13]. They are generally created when weak acids and bases with pKa values between 3 and 10 are incorporated into the hydrogel network [14]. The most commonly studied ionic polymers for pH-responsive behavior include poly(acrylamide) [15], poly(acrylic acid) [16], poly(methacrylic acid) [17] and poly(diethylaminoethyl methacrylate) [18]. In aqueous media of appropriate pH and ionic strength, the pendant groups ionize and develop fixed charges on the polymer network, generating electrostatic repulsive forces that are responsible for pH-dependent swelling or deswelling of the hydrogel. Microscopic particles of hydrogels (microgels) are presently under intense investigation for drug delivery and controlled release of bioactive molecules [19]. The microgels can be used for sustained local delivery of chemotherapeutic agents in order to optimize the anti-tumor activity of these agents while minimizing their systemic effects. The microspheres carrying chemotherapeutic drugs are swollen, and this swelling can be modified by changes in their crosslink density. The electrostatic repulsion of charged groups dispersed in pH-responsive microgels result in additional swelling of the elastic polymer network in aqueous media. This allows the delivery of variable sized microspheres that can be used for chemo-embolization of the tumor’s feeding arteries at different levels within the tumor, and they can thus distribute their drug loads more homogeneously throughout the tumor volume.
In this study, we have used oligo(polyethylene glycol) fumarate (OPF) and sodium methacrylate (SMA) to produce pH-responsive microgels for delivery of chemotherapeutic drugs. OPF hydrogel has been previously used by our group for applications that include bone, cartilage and neural tissue engineering [20–22]. In a recent work, we reported that incorporation of a negatively charged monomer into OPF macromer results in a hydrogel with pH sensitivity [23]. In this work, we have investigated the fabrication of OPF–SMA microspheres and characterized their morphology, electrical charge and pH sensitivity. We used doxorubicin (DOX) as a typical chemotherapeutic drug and characterized the loading kinetics and loading efficiency of microspheres with respect to their electrical charge. We have studied the release kinetics of the microspheres loaded with DOX in phosphate-buffered saline (PBS, pH 7.4) and acidic solutions of varying pH. Moreover, we have used mathematical modeling to analyze the release of DOX from pH-responsive microspheres in different solutions.
Drug release kinetics may be affected by many factors, such as polymer swelling, polymer erosion, drug dissolution/diffusion characteristics, drug distribution inside the matrix, drug/polymer ratio and system geometry (cylinder, sphere, etc.) [24–26]. Thus, mathematical modeling could be useful in identifying the key parameters affecting drug release kinetics and mechanism of release [27–29]. Ultimately, in this work, the anti-tumor effects of released DOX have been studied on viability of human chordoma cells, which are typically more resistant to chemotherapeutic drugs as compared to other bone cancer cells.
2. Materials and methods
2.1. OPF synthesis
OPF was synthesized using poly(ethylene glycol) (PEG) with a number-average molecular weight of 10,000, according to a previously described method [30]. Briefly, 50 g of PEG was azeotropically distilled in toluene to remove residual water and then dissolved in 500 ml of distilled methylene chloride. The resulting PEG was placed in an ice bath and purged with nitrogen for 10 min, before triethylamine (TEA; Aldrich, Milwaukee, WI) and fumaryl chloride (Acros, Pittsburgh, PA) were added dropwise. The reaction vessel was then stirred at room temperature for 48 h. For purification, methylene chloride was removed by rotary evaporation. The resulting OPF was dissolved in ethyl acetate and filtered to remove the salt from the reaction of TEA and chloride. OPF was recrystallized in ethyl acetate, vacuum dried and stored in a freezer at −20 °C.
2.2. Microsphere fabrication and characterization
OPF macromer (final concentration 33 wt.%), co-monomer N-vinyl pyrrolidinone (0.33 wt.%) and SMA (0, 5, 10, 20 wt.%) were dissolved in deionized water. The reaction mixture was emulsified in a light mineral oil (100 ml) containing 0.5 g of polyethylene trioleate and 1.5 ml of sorbitol monostearate at 400 rpm for 10 min under a nitrogen atmosphere, then 468 µl of 0.3 M ammonium persulfate and 468 µl of 0.3 M tetramethylethylenediamine were added and stirred continuously for 30 min at 40 °C. The microspheres were filtered and washed with cold acetone, followed by lyophilization and storage in a freezer until use. The morphology of the microspheres was assessed by scanning electron microscopy (SEM) and confocal laser scanning microscopy (CSLM) after loading with DOX. The zeta potentials of the microspheres were measured using a Zetasizer Nano ZS90 (Malvern Instruments Ltd., Worcestershire, UK). The hydrogel microspheres were swollen to equilibrium for 24 h at 37 °C in PBS and deionized water. The swollen samples were blotted dry and weighed (Ws, swollen weight), then dried in reduced pressure and weighed again (Wd, final dry weight). The swelling ratio of the microgels was calculated using the following equation:
The surface of the OPF–SMA hydrogel films (Supplementry Fig. 1) was characterized by microattenuated total reflectance Fourier transform infrared spectroscopy (micro-ATR-FTIR) using a Nicolet 8700 spectroscope coupled to a Continuum microscope (Thermo Electron Corp., Madison, WI). The microscope used an ATR slide on a germanium crystal and spectra were collected at a resolution of 4 cm−1 for 64 scans.
2.3. Drug loading
For drug loading, 10 mg of microspheres was incubated in 1 ml of an aqueous loading solution containing varying concentrations of DOX (Sigma, St. Louis, MO) at room temperature. The loading rates of the drug into the microspheres were determined by measuring the remaining DOX concentration in the loading solution every hour for 5 h and then at 24 h. A plate reader was used at 490 nm for measurements of DOX concentration.
2.4. In vitro drug release
To measure the release of absorbed drug, hydrogel microspheres were placed in centrifuge tubes with 1 ml of medium (PBS and dH2O at different pHs) and incubated at 37 °C. Medium was collected every day for 6 days and every 3 days thereafter. The release of drug was quantified using the instruments described for drug loading. All release data were normalized to the concentration of the drug initially absorbed by the microgels.
2.5. Mathematical modeling
To quantitatively analyze the cumulative release of DOX, we designed a phenomenological mathematical model based on a stretched exponential function. We found that all data are described well by the following function F(t) for cumulative release normalized to loading efficiency and dependent on time t:
| (1) |
Here M is the maximally achieved cumulative release, τ is the time when the fraction (1 − e−1) = 0.632 of M is achieved and b is the model parameter which defines the stretching of the exponential function. The data were fitted by this model using the weighted non-linear least-squares method. The weights were given as reciprocal squares of standard deviations for each data point. We used our custom-made software with minimization performed by the Simplex and Induction Hybrid (SIH) algorithm [31].
To better understand the significance of how best-fit model parameters change with the conditions of experiments, rather than b and τ we considered the half-time T = τ(ln2)1/b, i.e. the time when half of the maximal cumulative release M is achieved, and the rate of change at that time: r = dF/dt|t=T = Mb(ln2)1 − 1/b/(2τ). These parameters intuitively better describe the extent of change. We estimated the standard deviations for these parameters by using the Monte Carlo method [32].
2.6. Cell culture and anti-tumor effect of released DOX
The UCH1 is an established chordoma cell line that was generously supplied to our group by the Chordoma Foundation. This cell line was cultured in RPMI-1640 medium supplemented with 10% fetal bovine serum, 100 units ml−1 penicillin and 100 µg ml−1 streptomycin. The cells were plated in 24-well plates at a density of 15,000 cells cm−2 in 1 ml of medium, and maintained at 37 °C for 24 h. To determine the biological activity of drug released from the hydrogels, transwells (Corning, Corning, NY) containing charged hydrogel microspheres loaded with DOX were submersed in the cell culture medium. An MTS assay was used to assess cell survival.
2.7. Statistical analysis
The data for hydrogel characterization are reported as means ± standard deviations for triplicate samples unless otherwise described. Single-factor analysis of variance was performed (StatView, version 5.0.1.0, SAS Institute, Inc., Cary, NC) to assess the statistical significance of the results. When the global F-test was positive at the 0.05 level, Bonferroni’s method was used for multiple comparison tests to determine differences between the experimental groups.
3. Results
3.1. Hydrogel fabrication and characterization
Four groups of hydrogel microspheres were fabricated with changing SMA concentration in hydrogel formulations, as shown in Table 1. The Z-potentials of microspheres measured in deionized water revealed that microgels became negatively charged with the incorporation of SMA into their formulations, and their Z-potentials ranged from −1.62 to −22.63. The Z-potentials of the microspheres decreased when positively charged DOX was added to their solutions. To confirm incorporation of SMA into the OPF hydrogel during crosslinking, hydrogel films with OPF/SMA ratios similar to microgels were prepared as previously described [23]. The hydrogel films were analyzed using ATR-FTIR. The FTIR data showed a new peak at 1550 cm−1 that is characteristic of the methacrylate from SMA (S1a). Peak heights of the methacrylate group increased as the SMA concentration in the hydrogel formulation increased (S1a). The relative amount of SMA copolymerization in the OPF hydrogels was calculated by comparing the ratios of the OPF characteristic peak at 1650 cm−1 and the SMA characteristic peak at 1550 cm−1. According to this analysis, the amount of SMA that actually copolymerized within the OPF hydrogels during the cross-linking process increased linearly (R2 = 0.9808) as the amount of SMA added to the formulation was increased (S1b).
Table 1.
OPF–SMA microgel characteristics.
| Microgels | SMA concentration (mmol) | Z-potential (mV) in dH2O | Z-potential (mV) in DOX |
|---|---|---|---|
| HG-0 | 0 | 0.28 ± 1.07 | 0.18 ± 0.07 |
| HG-SMA50 | 0.46 | −1.62 ± 0.03 | −2.13 ± 1.59 |
| HG-SMA100 | 0.92 | −7.46 ± 0.44 | −1.17 ± 0.13 |
| HG-SMA200 | 1.83 | −22.63 ± 0.32 | −3.96 ± 1.33 |
The SEM images in Fig. 1 reveal that microspheres were formed from all hydrogel formulations using water-in-oil solution. After lyophilization, the microspheres had a spherical morphology, with diameters ranging from 2 to 52 µm. Histograms of particle size distribution show that the microspheres had a median diameter of 10–11 µm and an average diameter of about 13 µm regardless of their compositions (Fig. 1). After swelling in dH2O, the diameters of microspheres were measured from optical microscope images (Fig. 2). The results show that HG-0 and HG-SMA50 had median diameters of 32 and 33 µm, with average diameters of 36.7 and 39.6 µm, respectively. However, HG-SMA100 and HG-SMA200 had median diameters of 67 and 66 µm and average diameters of 68.2 and 71.3 µm (Fig. 3a). Changes in microsphere diameters after swelling in dH2O correlated well with their swelling ratios, as shown in Fig. 3b, where hydrogel microspheres without SMA (HG-0) and HG-SMA50 had lower swelling ratios in both dH2O and PBS as compared to HG-SMA100 and HGSMA200. Although, the swelling ratio of HG-SMA50 was similar to that of HG-0 (about 20) in dH2O, it increased to 41 and 59 with increasing SMA concentration in HG-SMA-100 and HG-SMA200, respectively. These increases in swelling ratio of HG-SMA100 and HG-SMA200 were significantly higher than other microsphere groups in both PBS and dH2O.
Fig. 1.

SEM images and histograms of microgel diameters after lyophilization: (a) HG-0, (b) HG-SMA50, (c) HG-SMA100 and (d) HG-SMA200.
Fig. 2.
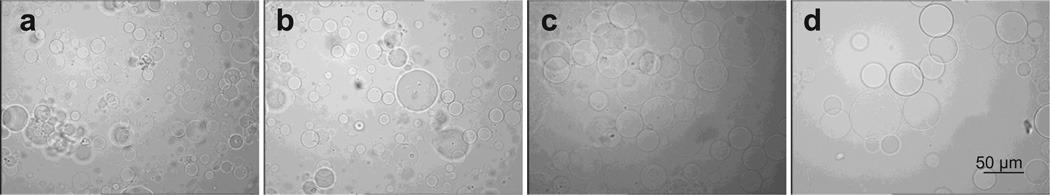
Optical micrographs of microgels after swelling in deionized water: (a) HG-0, (b) HG-SMA50, (c) HG-SMA100 and (d) HG-SMA200.
Fig. 3.

(a) Microgel median and average diameters measured from optical microscope images. (b) Equilibrium swelling ratio of microgels in deionized water and PBS. The swelling ratio in deionized water increased with increasing concentration of SMA in the hydrogel formulation. The change in swelling ratio occurs to a lesser degree in PBS. *p < 0.05 as compared to HG-0 in PBS. #p < 0.005 as compared to HG-0 in water.
3.2. DOX loading efficiency
The loading efficiency of DOX on charged microspheres was assessed using an aqueous solution of DOX (200 and 400 µg ml−1). Measurement of the drug concentration at different time points showed that charged microspheres absorbed most of the DOX within the first half an hour and reached equilibrium within a few hours (Fig. 4a and b). Fig. 4 shows that the loading efficiency increased with increasing SMA concentration in the microsphere formulations. Additionally, HG-SMA100 and HG-SMA200 had higher absorption rates compared to the other microsphere formulations.
Fig. 4.

Amount of DOX adsorbed to the microgels of varying formulations vs. time. Microgels are loaded in 1 ml of DOX solution with concentrations of (a) 200 µg ml−1 and (b) 400 µg ml−1.
A gross picture of hydrogel microspheres in DOX solution (200 µg ml−1) shows that the DOX solutions became depleted in color and the microspheres turned red; however, the drug solution containing microspheres without SMA (HG-0) was still red after 24 h (Fig. 5a). Fig. 5b reveals that the loading efficiency of the microspheres increased with increasing SMA concentration in the microsphere formulations. The loading efficiencies for the HG-0, HG-SMA50, HG-SMA100 and HG-SMA200 microspheres in DOX solution with a concentration of 200 µg ml−1 were 22.5% < 66.5% < 87.8% < 96.6%, respectively. The same trend was observed for loading efficiency of microspheres in 400 µg ml−1 DOX solution. As seen in Fig. 5b, HG-0 and HG-SMA50 microspheres absorbed slightly less drug when the concentration of DOX in solution increased from 200 to 400 µg ml−1. However, the loading efficiencies of the HG-SMA100 and HG-SMA200 microspheres in these solutions were similar (p > 0.05). When the concentration of DOX in the loading solution was 400 µg ml−1, HG-SMA50, HG-SMA100 and HG-SMA200 were loaded with 22.0, 35.3 and 38.8 µg mg−1, respectively. However, the hydrogel without charge (HG-0) absorbed only 7.2 µg mg−1, which is about five times less than hydrogels with charge densities (Fig. 5b).
Fig. 5.

(a) Percent DOX adsorbed to the microgels of varying formulations after 24 h. (b) Amount of DOX adsorbed from 1 ml of loading solution of varying concentrations normalized to the weight of the microgels.
Hydrogel microspheres were imaged after 24 h in 50 µg ml−1 DOX solution, using confocal microscopy (Fig. 6). The red fluorescence in the pictures reveals that all the microspheres absorbed DOX from the solution, and that the fluorescence intensity was higher in the microspheres with higher amounts of SMA in their formulation, indicating a higher DOX absorption. After swelling in DOX solution, all microsphere groups had a median diameter of 27–31 µm and an average diameter of 32–34 µm except the HG-SMA50 microspheres, which were smaller, with a median diameter of about 21 µm and an average diameter of 23 µm.
Fig. 6.

CSLM images and histograms of microgel diameters after loading in DOX solution: (a) HG-0, (b) HG-SMA50, (c) HG-SMA100 and (d) HG-SMA200.
3.3. DOX release
The in vitro experimental release data from microgels after loading in two different loading solutions (200 or 400 µg ml−1) are shown in Fig. 7a and b. HG-0 exhibited a burst release of about 41.5% on the first day, while DOX release from the SMA-modified microgels on the first day was significantly less than from HG-0 (p < 0.05). There was a decreasing trend for DOX release on the first day with increasing SMA concentration in the hydrogel formulations, though both unmodified and SMA-modified microgels exhibited controlled release profiles over the 14 day time period. The same trend was observed for unmodified and SMA modified microgels loaded with a higher amount of DOX (400 µg ml−1) in Fig. 7b.
Fig. 7.

Release of DOX from microgels loaded at (a) 200 µg ml−1 and (b) 400 µg ml−1 loading solutions in PBS over 14 days. The amounts of DOX released from microgels are normalized to the initial amounts of DOX loaded to each formulation (symbol ○). The solid curves are provided by the non-linear least-squares fitting of data by our model (Eq. (1)).
To demonstrate that the drug release kinetics of OPF–SMA microgels is a function of the pH and ionic strength of the solution, we chose microgels with the highest SMA concentration (HG-SMA200) and loaded them in an aqueous solution of DOX with a concentration of 200 µg ml−1. The specimens were then placed in vials with PBS and dH2O at different pHs, and their release profiles were measured at 37 °C for 14 days. Fig. 8 reveals that 52.5% of the DOX is released in the first day in dH2O at pH 3. However, only 8.4% of DOX is released in the aqueous solution at pH 5. An increase in the release kinetics was observed when PBS was used for the release: the DOX release at day 1 increased to 27% at pH 5 when PBS was used in place of dH2O. The release kinetics in PBS at pH 7.4 was much slower than in the acidic condition (13.4% as opposed to 27%).
Fig. 8.

Release of DOX from HG-SMA200 in solutions of varying pH. The amounts of DOX released from microgels are normalized to the initial amounts of loaded DOX (symbol ○). The solid curves are provided by the non-linear least-squares fitting of data by our model (Eq. (1)).
As shown in Figs. 7a and b and 8, the results of model fitting of the experimental release data with Eq. (1) are demonstrated by corresponding curves. As a result of the least-squares fits of the model, three parameters – M (maximum release), T (half time) and slope at half time – were estimated (Table 2). The standard deviations listed in Table 2 were estimated using the Monte Carlo method. For microgels loaded in the 200 µg ml−1 DOX solution, M decreased from 0.7 to 0.18 and T increased from 0.7 to 4.1 days when the SMA concentration was increased in the microgel formulation (Fig. 7a). The estimates obtained from Eq. (1) exhibited the same trend for microgels loaded in the 400 µg ml−1 DOX solution (Fig. 7b). The slope at half time ranged from 0.27 to 0.019 for the microgels loaded in 200 µg ml−1 DOX, while it ranged from 0.35 to 0.009 for those loaded in 400 µg ml−1 DOX. The estimates in Table 2 reveal that M is a function of the pH and ionic nature of the release solutions. In the most acidic solution (pH 3), M was 0.98; this value decreased to 0.27 when the pH was increased to 5. Similarly, the release rate was higher in PBS at pH 5 than at pH 7.4 (Fig. 8). The half time in solutions of varying pHs ranged from 0.9 to 2.3 days with slopes ranging from 0.4 to 0.07.
Table 2.
Model fit results estimated from Eq. (1).
| Microgels | Maximum release (M) |
Half-time (T, days) |
Slope at half time |
|
|---|---|---|---|---|
| Loading: 200 µg ml−1 DOX | ||||
| HG-0 | 0.70 ± 0.01 | 0.71 ± 0.05 | 0.27 ± 0.02 | |
| HG-SMA50 | 0.341 ± 0.002 | 1.78 ± 0.02 | 0.068 ± 0.009 | |
| HG-SMA100 | 0.223 ± 0.009 | 2.4 ± 0.2 | 0.039 ± 0.005 | |
| HG-SMA200 | 0.18 ± 0.02 | 4.1 ± 0.7 | 0.019 ± 0.003 | |
| Loading: 400 µg ml−1 DOX | ||||
| HG-0 | 1.09 ± 0.02 | 0.93 ± 0.05 | 0.35 ± 0.02 | |
| HG-SMA50 | 0.36 ± 0.01 | 1.7 ± 0.1 | 0.070 ± 0.006 | |
| HG-SMA100 | 0.14 ± 0.01 | 2.3 ± 0.4 | 0.024 ± 0.006 | |
| HG-SMA200 | 0.104 ± 0.008 | 4.6 ± 1.7 | 0.009 ± 0.001 | |
| pH | Medium | |||
| 3 | dH2O | 0.98 ± 0.04 | 0.9 ± 0.1 | 0.4 ± 0.1 |
| 5 | dH2O | 0.27 ± 0.03 | 1.9 ± 0.5 | 0.40 ± 0.01 |
| 5 | PBS | 0.70 ± 0.02 | 1.4 ± 0.1 | 0.14 ± 0.01 |
| 7.4 | PBS | 0.50 ± 0.05 | 2.3 ± 0.4 | 0.07 ± 0.01 |
3.4. DOX biological activity
The anti-tumor effect of released DOX was examined using the human chordoma UCH-1 cell line. These cells are resistant to a number of chemotherapeutic drugs [33,34]. Fig. 9 shows the dose-dependent effects of DOX on the viability of human chordoma UCH-1 cells after two consecutive treatments. In the first treatment group, the cells were exposed to varying doses of DOX, ranging from 0.2 to 10 µg, and cell viability was assessed after 3 days using the MTS assay. This showed that there was about 70% cell death with the first treatment. However, changing the DOX dosage had no significant effect on cell death. In the second experimental group, after 3 days of culture in the presence of DOX, the medium was changed with fresh medium and cells were exposed to another dose of DOX. The same amounts of DOX were added to the same well at each time point, and cell viability was assessed after a further 3 days in culture. In this group with two treatments, the cell death increased to 90% (Fig. 9).
Fig. 9.

UCH-1 cell death after treatment with two doses of DOX.
Fig. 10a shows the antitumor effect of DOX after release from the microgels. As seen in the figure, UCH-1 cells cultured in the presence of microgels without DOX maintained their viability, indicating that neither the OPF hydrogel itself nor any potentially leached materials from these microgels had any effect of toxicity. UCH-1 cell survival decreased to about 20% when the cells were exposed to the DOX released from microgels for 3 days (Fig. 10b); the cell survival was less than 10% when they remained in culture with microspheres loaded with DOX for 7 days (Fig. 10b).
Fig. 10.

DOX released from hydrogels maintained its cell killing effects after (a) 3 days and (b) 7 days in culture, while hydrogels without DOX showed no toxicity associated with release of leaching materials. *p < 0.001 as compared to the hydrogels without DOX.
4. Discussion
In the present study, we have fabricated pH-responsive microgels by the incorporation of SMA into OPF hydrogel using a redox initiation system. These microgels were negatively charged and the density of the charge was varied based upon the concentration of SMA in microgel formulation. SEM revealed that all microgel formulations had a spherical morphology. The swelling ratios in both PBS and deionized water were similar for HG-0 and HG-SMA50; however, it significantly increased with increasing SMA concentration in the microgel formulations (HG-SMA-100 and HG-SMA200). As expected for ionic hydrogels, the swelling ratios for HG-SMA-100 and HG-SMA200 were greater in water than in PBS. Furthermore, optical images of the swollen microgels exhibited changes in the microgel sizes correlated with their swelling in deionized water. We also demonstrated that DOX could be rapidly absorbed to the charged microgels due to the electrostatic interactions between the negatively charged microgels and the protonated primary amine group on DOX. Confocal images of microgels after DOX loading exhibited decreases in the HG-SMA100 and HG-SMA200 microgel diameters. This is indicative of DOX absorption to the microgels, resulting in decreased charge densities, as shown by the measurement of zeta potential.
The uptake of DOX by SMA-modified microgels was shown to be a rapid process. HG-SMA200 had a high loading efficiency in both loading solutions (200 and 400 µg ml−1). The microgels absorbed about 97% of the drug within a few hous. The loading kinetics was shown to be a function of SMA concentration in microgel formulation. For example, 97% of the DOX in loading solution was taken up by the HG-SMA200 microgel after 24 h, while 88%, 67% and 23% was absorbed by HG-SMA100, HG-SMA50 and HG-0, respectively, in the loading solution with a concentration of 200 µg ml−1.
Loading efficiency is an important factor in drug delivery approaches. Materials with high loading efficiency reduce drug waste and make it possible to deliver a very high local dose by using only a small amount of polymer. We demonstrated that SMA-containing microgels could release DOX in PBS, which mimics the physiological solution in a controlled manner, with an ion-exchange mechanism. The burst release was significantly decreased with the incorporation of SMA into the microgel formulations.
Our empirical mathematical modeling showed that the release of DOX is described well by a stretched exponential model. The half time for the maximum release estimated from the best-fit model parameters showed a fairly good linear correlation with SMA concentration (R2 = 0.88). An increased half time was obtained as the concentration of SMA increased in microgel formulations. The same model equation was successfully applied for the release of microgels loaded in the solution with the higher DOX concentration (400 µg ml−1), and the maximum release, half time and slope at half time were calculated based on the fits by the model. A linear correlation showing an increase in the half time of maximum release with SMA was also observed at this loading solution (R2 = 0.94). The slope at half time was decreased as the SMA concentration was increased in the microgel formulations.
We also demonstrated that SMA-modified microgels are responsive to the acidic pH of the solution. The release data in solutions of varying pH revealed a significant increase in release kinetics of microgels in acidic pH in both deionized water and PBS. Almost 98% of the loaded DOX was released in deionized water at pH 3, whereas only 27% was released in the same solution at pH 5. In PBS, the maximum release was 70% at pH 5 and this decreased to 50% at pH 7.4. It has been reported that the extracellular pH of tumor tissue is significantly lower than the extracellular pH of normal tissue, whereas the intracellular pH of both tissues is similar. The low intra-tumoral pH [35] markedly affects the response of tumors to various treatments such as chemotherapy, radiotherapy and hyperthermia [36]. For instance, the acidic pH increases the cellular uptake of weakly acidic drugs such as cyclophosphamide and cisplatin, and thus increases the effect of the drugs, whereas it retards the uptake of weakly basic drugs such as doxorubicin and vinblastine, thereby reducing the effect of the drugs [35].
Additionally, the mathematical estimates revealed a shorter half time for the maximal release at low pH in both deionized water and PBS. The slope at half time for both low and high pH in deionized water was 0.4, which decreased to 0.14 at pH 5 in PBS. This could be due to the ionic nature of the PBS solution and the change in osmotic pressure within the microgels, which result in reduced release kinetics.
The antitumor efficacy of DOX released from the hydrogels was investigated by measuring UCH-1 chordoma cell death. UCH-1 cells cultured in the presence of microgels without DOX maintained their viability, indicating that neither the OPF hydrogel itself nor any potentially leached materials from the hydrogels had any toxic effect. However, UCH-1 cell survival decreased to about 20% when they were exposed to the DOX released from microgels over 3 days and decreased further to less than 10% when they were exposed to the released DOX for 7 days.
5. Conclusions
Our results reveal that SMA-modified microgels are responsive to the pH and ionic strength of solutions. We demonstrated that DOX absorption and release can be modulated by changing the SMA concentration in the microgel formulation, and the rate and extent of the release was controlled by the ionic strength and pH of solutions. The release of DOX from microgels was fitted with a stretched exponential model. The half time for maximum release calculated from the model fitting showed a linear correlation with the SMA concentration. Our data revealed that pH-responsive OPF microgels prolonged the cell killing effect of DOX. These microgels can be used for local delivery of chemotherapeutic drugs to malignant tumors in vivo.
Supplementary Material
Acknowledgements
The authors would like to acknowledge Mr. Josh Summer from Chordoma Foundation and Dr. David Alcorta from Duke University for providing UCH-1 cells. The project described was supported by Grant Numbers R01 AR45871 and R01 EB003060 from NIH/NIAMs and the Mayo Foundation.
Footnotes
Conflict of interest
A non-provisional patent has been filed for the photocrosslinkable oligo(polyethylene glycol) fumarate used in this research, and this technology has been licensed to BonWrx.
Appendix A. Figures with essential colour discrimination
Certain figures in this article, particularly Figs. 5 and 6, are difficult to interpret in black and white. The full color images can be found in the on-line version, at http://dx.doi.org/10.1016/j.actbio.2012.09.019.
Appendix B. Supplementary data
Supplementary data associated with this article can be found, in the online version, at http://dx.doi.org/10.1016/j.actbio.2012.09.019.
References
- 1.Needham D, Dewhirst MW. The development and testing of a new temperature-sensitive drug delivery system for the treatment of solid tumors. Adv Drug Deliv Rev. 2001;53:285–305. doi: 10.1016/s0169-409x(01)00233-2. [DOI] [PubMed] [Google Scholar]
- 2.Burris HA, III, Vogel CL, Castro D, Mishra L, Schwarz M, Spencer S, et al. Intratumoral cisplatin/epinephrine-injectable gel as a palliative treatment for accessible solid tumors: a multicenter pilot study. Otolaryngol Head Neck Surg. 1998;118:496–503. doi: 10.1177/019459989811800412. [DOI] [PubMed] [Google Scholar]
- 3.Bae YH. Drug targeting and tumor heterogeneity. J Control Release. 2009;133:2–3. doi: 10.1016/j.jconrel.2008.09.074. [DOI] [PMC free article] [PubMed] [Google Scholar]
- 4.Lee ES, Gao Z, Bae YH. Recent progress in tumor pH targeting nanotechnology. J Control Release. 2008;132:164–170. doi: 10.1016/j.jconrel.2008.05.003. [DOI] [PMC free article] [PubMed] [Google Scholar]
- 5.Meyers SR, Kenan DJ, Grinstaff MW. Enzymatic release of a surface-adsorbed RGD therapeutic from a cleavable peptide anchor. Chem Med Chem. 2008;3:1645–1648. doi: 10.1002/cmdc.200800205. [DOI] [PubMed] [Google Scholar]
- 6.Griset AP, Walpole J, Liu R, Gaffey A, Colson YL, Grinstaff MW. Expansile nanoparticles: synthesis, characterization, and in vivo efficacy of an acid-responsive polymeric drug delivery system. J Am Chem Soc. 2009;131:2469–2471. doi: 10.1021/ja807416t. [DOI] [PubMed] [Google Scholar]
- 7.Suedee R, Jantarat C, Lindner W, Viernstein H, Songkro S, Srichana T. Development of a pH-responsive drug delivery system for enantioselective-controlled delivery of racemic drugs. J Control Release. 2010;142:122–131. doi: 10.1016/j.jconrel.2009.10.011. [DOI] [PubMed] [Google Scholar]
- 8.Kulkarni RV, Boppana R, Krishna Mohan G, Mutalik S, Kalyane NV. pH-responsive interpenetrating network hydrogel beads of poly(acrylamide)-γ-carrageenan and sodium alginate for intestinal targeted drug delivery: synthesis, in vitro and in vivo evaluation. J Colloid Interf Sci. 2012;367:509–517. doi: 10.1016/j.jcis.2011.10.025. [DOI] [PubMed] [Google Scholar]
- 9.Mohajeri SA, Malaekeh-Nikouei B, Sadegh H. Development of a pH-responsive imprinted polymer for diclofenac and study of its binding properties in organic and aqueous media. Drug Dev Ind Pharm. 2012;38:616–622. doi: 10.3109/03639045.2011.621126. [DOI] [PubMed] [Google Scholar]
- 10.Juodkazis S, Mukai N, Wakaki R, Yamaguchi A, Matsuo S, Misawa H. Reversible phase transitions in polymer gels induced by radiation forces. Nature. 2000;408:178–181. doi: 10.1038/35041522. [DOI] [PubMed] [Google Scholar]
- 11.Harris KD, Bastiaansen CW, Lub J, Broer DJ. Self-assembled polymer films for controlled agent-driven motion. Nano Lett. 2005;5:1857–1860. doi: 10.1021/nl0514590. [DOI] [PubMed] [Google Scholar]
- 12.Kwok CS, Mourad PD, Crum LA, Ratner BD. Self-assembled molecular structures as ultrasonically-responsive barrier membranes for pulsatile drug delivery. J Biomed Mater Res. 2001;57:151–164. doi: 10.1002/1097-4636(200111)57:2<151::aid-jbm1154>3.0.co;2-5. [DOI] [PubMed] [Google Scholar]
- 13.You JO, Almeda D, Ye GJ, Auguste DT. Bioresponsive matrices in drug delivery. J Biol Eng. 2010;4:15. doi: 10.1186/1754-1611-4-15. [DOI] [PMC free article] [PubMed] [Google Scholar]
- 14.Schmaljohann D. Thermo- and pH-responsive polymers in drug delivery. Adv Drug Deliv Rev. 2006;58:1655–1670. doi: 10.1016/j.addr.2006.09.020. [DOI] [PubMed] [Google Scholar]
- 15.Liu SQ, Tong YW, Yang YY. Thermally sensitive micelles self-assembled from poly(N-isopropylacrylamide-co-N, N-dimethylacrylamide)-b-poly(d, l-lactide-co-glycolide) for controlled delivery of paclitaxel. Mol Biosyst. 2005;1:158–165. doi: 10.1039/b501756b. [DOI] [PubMed] [Google Scholar]
- 16.Jarvinen K, Akerman S, Svarfvar B, Tarvainen T, Viinikka P, Paronen P. Drug release from pH and ionic strength responsive poly(acrylic acid) grafted poly(vinylidenefluoride) membrane bags in vitro. Pharm Res. 1998;15:802–805. doi: 10.1023/a:1011995725320. [DOI] [PubMed] [Google Scholar]
- 17.Jones MC, Ranger M, Leroux JC. PH-sensitive unimolecular polymeric micelles: synthesis of a novel drug carrier. Bioconjug Chem. 2003;14:774–781. doi: 10.1021/bc020041f. [DOI] [PubMed] [Google Scholar]
- 18.Traitel T, Cohen Y, Kost J. Characterization of glucose-sensitive insulin release systems in simulated in vivo conditions. Biomaterials. 2000;21:1679–1687. doi: 10.1016/s0142-9612(00)00050-8. [DOI] [PubMed] [Google Scholar]
- 19.Vinogradov SV. Colloidal microgels in drug delivery applications. Curr Pharm Des. 2006;12:4703–4712. doi: 10.2174/138161206779026254. [DOI] [PMC free article] [PubMed] [Google Scholar]
- 20.Dadsetan M, Hefferan TE, Szatkowski JP, Mishra PK, Macura SI, Lu L, et al. Effect of hydrogel porosity on marrow stromal cell phenotypic expression. Biomaterials. 2008;29:2193–2202. doi: 10.1016/j.biomaterials.2008.01.006. [DOI] [PMC free article] [PubMed] [Google Scholar]
- 21.Dadsetan M, Knight AM, Lu L, Windebank AJ, Yaszemski MJ. Stimulation of neurite outgrowth using positively charged hydrogels. Biomaterials. 2009;30:3874–3881. doi: 10.1016/j.biomaterials.2009.04.018. [DOI] [PMC free article] [PubMed] [Google Scholar]
- 22.Dadsetan M, Szatkowski JP, Yaszemski MJ, Lu L. Characterization of photo-cross-linked oligo[poly(ethylene glycol) fumarate] hydrogels for cartilage tissue engineering. Biomacromolecules. 2007;8:1702–1709. doi: 10.1021/bm070052h. [DOI] [PubMed] [Google Scholar]
- 23.Dadsetan M, Liu Z, Pumberger M, Giraldo CV, Ruesink T, Lu L, et al. A stimuli-responsive hydrogel for doxorubicin delivery. Biomaterials. 2010;31:8051–8062. doi: 10.1016/j.biomaterials.2010.06.054. [DOI] [PMC free article] [PubMed] [Google Scholar]
- 24.Noh SM, Park MO, Shim G, Han SE, Lee HY, Huh JH, et al. PEGylated poly-l-arginine derivatives of chitosan for effective delivery of siRNA. J Control Release. 2010;145:159–164. doi: 10.1016/j.jconrel.2010.04.005. [DOI] [PubMed] [Google Scholar]
- 25.Park Y, Kang E, Kwon OJ, Hwang T, Park H, Lee JM, et al. Ionically crosslinked Ad/chitosan nanocomplexes processed by electrospinning for targeted cancer gene therapy. J Control Release. 2010;148:75–82. doi: 10.1016/j.jconrel.2010.06.027. [DOI] [PubMed] [Google Scholar]
- 26.Forster RE, Small SA, Tang Y, Heaysman CL, Lloyd AW, Macfarlane W, et al. Comparison of DC Bead-irinotecan and DC Bead-topotecan drug eluting beads for use in locoregional drug delivery to treat pancreatic cancer. J Mater Sci. 2010;21:2683–2690. doi: 10.1007/s10856-010-4107-4. [DOI] [PMC free article] [PubMed] [Google Scholar]
- 27.Grassi M, Grassi G. Mathematical modelling and controlled drug delivery: matrix systems. Curr Drug Deliv. 2005;2:97–116. doi: 10.2174/1567201052772906. [DOI] [PubMed] [Google Scholar]
- 28.Balakrishnan B, Tzafriri AR, Seifert P, Groothuis A, Rogers C, Edelman ER. Strut position, blood flow, and drug deposition: implications for single and overlapping drug-eluting stents. Circulation. 2005;111:2958–2965. doi: 10.1161/CIRCULATIONAHA.104.512475. [DOI] [PubMed] [Google Scholar]
- 29.Tzafriri AR, Lerner EI, Flashner-Barak M, Hinchcliffe M, Ratner E, Parnas H. Mathematical modeling and optimization of drug delivery from intratumorally injected microspheres. Clin Cancer Res. 2005;11:826–834. [PubMed] [Google Scholar]
- 30.Jo S, Shin H, Mikos AG. Modification of oligo(poly(ethylene glycol) fumarate) macromer with a GRGD peptide for the preparation of functionalized polymer networks. Biomacromolecules. 2001;2:255–261. doi: 10.1021/bm000107e. [DOI] [PubMed] [Google Scholar]
- 31.Offord C, Bajzer Z. A hybrid global optimization algorithm involving simplex and inductive search. Lect Notes Comput Sci. 2001;2074:680–688. [Google Scholar]
- 32.Vetterling WT. Numerical recipes example book (C) 2nd en. Cambridge: Cambridge University Press; 1992. [Google Scholar]
- 33.Bruderlein S, Sommer JB, Meltzer PS, Li S, Osada T, Ng D, et al. Molecular characterization of putative chordoma cell lines. Sarcoma. 2010;2010:630129. doi: 10.1155/2010/630129. [DOI] [PMC free article] [PubMed] [Google Scholar]
- 34.Yang C, Hornicek FJ, Wood KB, Schwab JH, Choy E, Iafrate J, et al. Characterization and analysis of human chordoma cell lines. Spine. 2010;35:1257–1264. doi: 10.1097/BRS.0b013e3181c2a8b0. [Phila Pa 1976]. [DOI] [PMC free article] [PubMed] [Google Scholar]
- 35.Gerweck LE, Vijayappa S, Kozin S. Tumor pH controls the in vivo efficacy of weak acid and base chemotherapeutics. Mol Cancer Ther. 2006;5:1275–1279. doi: 10.1158/1535-7163.MCT-06-0024. [DOI] [PubMed] [Google Scholar]
- 36.Ko J, Park K, Kim YS, Kim MS, Han JK, Kim K, et al. Tumoral acidic extracellular pH targeting of pH-responsive MPEG-poly(beta-amino ester) block copolymer micelles for cancer therapy. J Control Release. 2007;123:109–115. doi: 10.1016/j.jconrel.2007.07.012. [DOI] [PubMed] [Google Scholar]
Associated Data
This section collects any data citations, data availability statements, or supplementary materials included in this article.