Abstract
An integrated robotic laser and microscope system has been developed to automatically analyze individual sperm motility and energetics. The custom-designed optical system directs near-infrared laser light into an inverted microscope to create a single-point 3-D gradient laser trap at the focal spot of the microscope objective. A two-level computer structure is described that quantifies the sperm motility (in terms of swimming speed and swimming force) and energetics (measuring mid-piece membrane potential) using real-time tracking (done by the upper-level system) and fluorescent ratio imaging (done by the lower-level system). The communication between these two systems is achieved by a gigabit network. The custom-built image processing algorithm identifies the sperm swimming trajectory in real-time using phase contrast images, and then subsequently traps the sperm by automatically moving the microscope stage to relocate the sperm to the laser trap focal plane. Once the sperm is stably trapped (determined by the algorithm), the algorithm can also gradually reduce the laser power by rotating the polarizer in the laser path to measure the trapping power at which the sperm is capable of escaping the trap. To monitor the membrane potential of the mitochondria located in a sperm’s mid-piece, the sperm is treated with a ratiometrically-encoded fluorescent probe. The proposed algorithm can relocate the sperm to the center of the ratio imaging camera and the average ratio value can be measured in real-time. The three parameters, sperm escape power, sperm swimming speed and ratio values of the mid-piece membrane potential of individual sperm can be compared with respect to time. This two-level automatic system to study individual sperm motility and energetics has not only increased experimental throughput by an order of magnitude but also has allowed us to monitor sperm energetics prior to and after exposure to the laser trap. This system should have application in both the human fertility clinic and in animal husbandry.
Keywords: Sperm tracking, Ratiometric imaging, Membrane potential, Fluorescent probe, Laser tweezers
1 Introduction
Single cell fluorescent measurements can be used to quantify a cell’s physiological state, such as enzymatic activity and membrane potential (Shapiro 2000). In recent years, optical recording techniques have provided a constantly evolving and increasing powerful set of tools for investigation of cellular physiology (Sinha and Saggau 1999 and Nakagawa et al. 2006). In particular, fluorescent techniques used to measure membrane potential have become promising tools for the analysis of sperm function and ultimately for use in human and animal husbandry fertility clinics. This has been demonstrated in past studies by studying the relationship between mitochondrial respiration and sperm vitality (Mei et al. 2005) and quality (Marchetti et al. 2002). Kasai et al. (2002) proposed that sperm motility was dependent on mitochondrial function: as the sperm mitochondrial membrane potential increased, sperm motility also increased together with their fertilization potential. In 2004, Martinez-Pastor, et al. indicated that good sperm motility was associated with high mitochondrial membrane potential.
In order to accurately measure membrane potential and relate it to cell energetics, non-toxic membrane potential-sensitive dyes are needed. In this regard, a variety of dyes have been used to study sperm. The fluorescent dye dihexyloxacarbocyanine iodide (DiOC63) was used by Marchetti et al. (2002), rhodamine 123 by Paniagua-Chavez et al. (2006), and JC-1 dye (5,5′,6,6′-tetra-chloro-1,1′,3,3′-tetraethylbenzimidazolyl-carbocyanine iodide) by Troiano et al. (1998), Kasai et al. (2002), Martinez-Pastor et al. (2004), and Mei et al. (2005). In the previous study using JC-1 (Mei et al. 2005), it was shown that prolonged exposure of domestic dog sperm to the laser tweezers produced a depolarization of the mitochondria. In that experiment, it was observed that the overall sperm motility was negatively affected after adding JC-1 dye (data was not included). A study by Novo et al. (1999) on bacterial physiology found that the ratiometric technique for measuring membrane potential using DiOC2(3) (3,3′-diethyloxacarbocyanine) was substantially more accurate and precise than JC-1. Given the possible negative effects of JC-1 and the success of DiOC2(3) in bacteria, this dye was chosen for our studies.
In both clinical and research situations, sperm motility is commonly assessed by Computer Assisted Sperm Analysis (CASA) systems. These systems have been commercially available since the mid-1980s and a detailed review of CASA can be found in Amann and Katz (2004) and Mortimer (1994). In order to further speed up the automated measurable parameters of sperm motility, Young et al. (1996) and Kuo et al. (2000) developed a real-time automated-stage sperm tracking system to analyze highly dilute sperm suspensions at 30 frames/second.
An additional approach to measuring sperm motility is to use optical tweezers (traps) by measuring sperm swimming forces. Effects of optical trapping on sperm motility in both human clinical samples and research animals samples have been well characterized by Tadir et al. (1989), Dantas et al. (1995), Konig et al. (1996), and Nascimento et al. (2006). In 2006, new advances in hardware and software facilitated the development of a Real-time Automated Tracking and Trapping System (RATTS; Shi et al. 2006). This system measured both the swimming force and speed of individual sperm at video rates (30 frames per second). After manual identification of a sperm of interest within a real time video feed, and a subsequent mouse click on the sperm of interest, RATTS performed all further tracking and trapping functions without human intervention.
In this paper, we describe a system that combines the velocity and force measurements described in Shi et al. (2006) with mitochondrial membrane potential measurements on individual swimming sperm in real time. To achieve this analysis, a two-level integrated system has been developed using the real-time “track and trap” algorithm (performed by upper-level system) and fluorescent ratio imaging (performed by lower-level system). In this system phase contrast images are continuously acquired in real-time and digitized for image analysis and display. Once the user selects a sperm of interest as displayed on the upper-level computer, three subsequent operations are performed automatically: (1) pre-trap: the selected sperm is continuously tracked for a specified sequence length while fluorescent images are sampled periodically, (2) in-trap: the sperm is held within the laser trap with either a constant laser power or a gradually reduced laser power while fluorescent images are sampled continuously, (3) post-trap: the same sperm is continuously tracked while fluorescent images are sampled periodically. This system provides a multiple-parametric set of measurements on individual sperm that will ultimately provide a more complete analysis of sperm motility. Such a system should have significant utility both commercially and for basic research.
2 Materials and methods
2.1 Optical system design
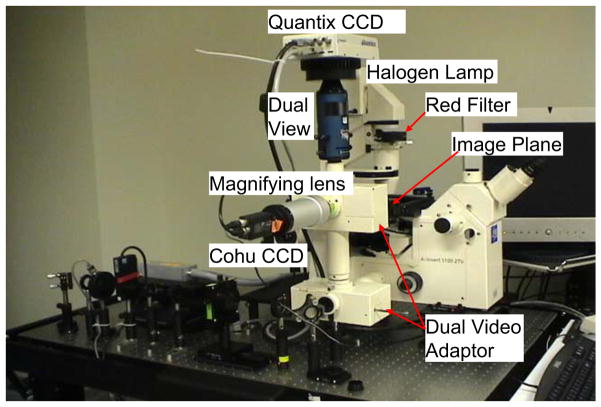
The top view and side view of the optical system to study sperm motility and energetics is shown in Figs. 1 and 2 respectively. An Nd:YVO4 continuous wave 1,064 nm wavelength laser (BL-106C, Newport Corp., Newport, CA, USA) is focused into a Zeiss Axiovert S100 microscope equipped with a ×40 [phase III, NA 1.3] oil immersion objective (Zeiss, Thornwood, NY, USA). The laser creates a single-point 3-D gradient laser trap. The specimen is illuminated with both the halogen lamp for phase contrast images and the arc lamp for fluorescent images. The halogen light is passed through a red filter (bandpass filter, 680 nm center wavelength, 60 nm bandpass) before entering the sample to spectrally separate phase contrast and fluorescent images. The fluorescence excitation light is provided by an arc lamp (Zeiss FluoArc). The fluorescence filter cube contains an HQ 500/20 nm excitation filter and a dichroic beam splitter with a 505 nm cut-on wavelength. A dual video adapter attached to the microscope side port contains a filter cube with a dichroic beam splitter that transmits 1,064 nm laser light to the microscope and reflects visible light coming from the specimen. A filter (Chroma Technology Corp., Model E700SP-2P, Rockingham, VT, USA) is used to prevent back reflections of infrared laser light from exiting the top port of the adapter. A second dual video adapter is attached to the top port of the first video adapter. The filter cube in this second adapter reflects phase images (>670 nm) and transmits fluorescent images (500–670 nm). The phase contrast images are acquired through a digital charge-coupled device (CCD) camera (Cohu, Model 7800, San Diego, CA, USA). The frame rate of Cohu is set at 40 Hz in the experiments discussed in this paper. An HQ 675/50 M bandpass filter is placed in front of the Cohu CCD to block any secondary back reflections from the laser. For the fluorescent images, a Dual-View system (Optical-Insights, Tucson, AZ, USA) splits the red and green fluorescent light emitted by the specimen to produce two spectrally separated images. Fluorescent filters placed in this emission-splitting system filter green and red fluorescence (HQ 535/40 nm M filter, HQ 605/50 M nm filter, Chroma Technology Corp.). The Dual-View system is coupled to a deep cooled digital camera (Quantix 57, Roper Scientific Inc., Tucson, AZ, USA) that captures the fluorescent images.
Fig. 1.
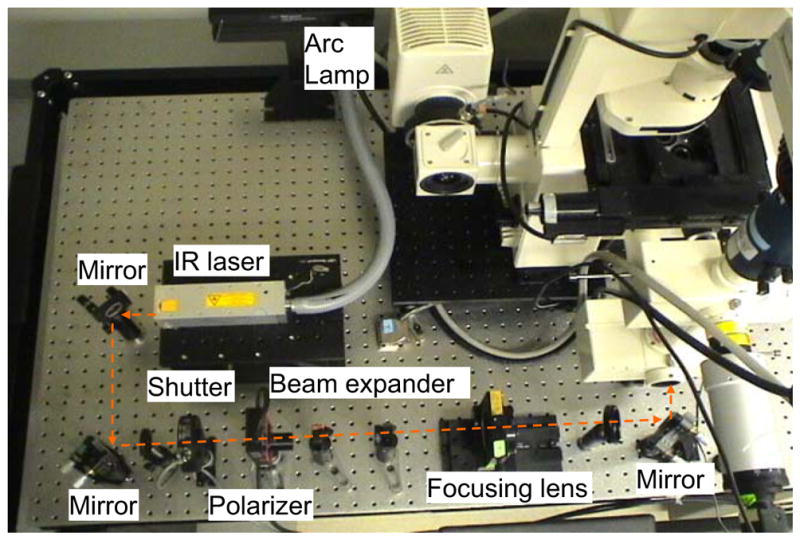
Top view of optical system to study sperm motility and energetics
Fig. 2.
Side view of optical system to study sperm motility and energetics
2.2 Sperm preparation with DiOC2(3) dye
Cryogenically frozen domestic dog sperm were thawed in a water bath (~1 min; 37°C) and the cells were pelleted by centrifugation (10 min/2,000 rpm). The supernatant was removed and the pellet was resuspended in 1 mL of Biggers, Whittens, and Whittingham (BWW) plus bovine serum albumin (BSA) media (1 mg of BSA per 1 mL of BWW, osmolality of 270–300 mmol/kg water, pH of 7.2–7.4; Biggers et al. 1971). Half of the stock solution is reserved for dye preparation. A final concentration of 30 nM of DiOC2(3) was used. The cells were incubated with the dye for 15 min in a 37°C water bath then centrifuged for 10 min/2,000 rpm. The pellet was resuspended in the media by ‘flicking’ the tube according to the protocol for the MitoProbe assay kit (Invitrogen, Carlsbad, CA, USA) for flow cytometry. The sperm dilution is loaded into a 3 mL Rose tissue culture chamber and mounted into a microscope stage. The sample is kept at 37°C using an air curtain incubator (NEVTEK, ASI 400 Air Stream Incubator, Burnsville, VA, USA). A thermocouple is attached to the Rose chamber to insure temperature stability.
2.3 System hardware control
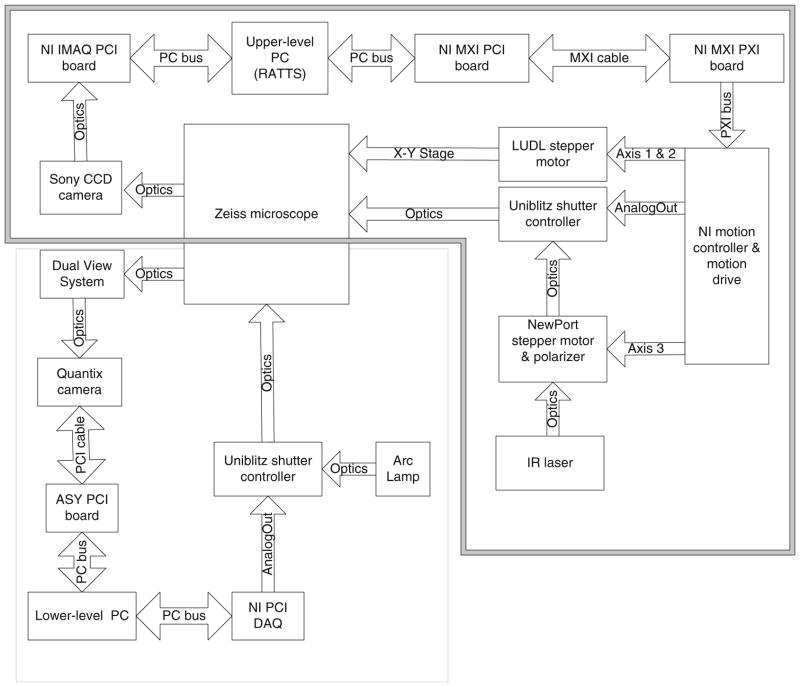
Figure 3 shows the system hardware diagram. The components in the upper-level system are indicated in the double-line box in Fig. 3. An OASIS motion controller/driver (OASIS-4i, Objective Imaging, Cambridge, UK) and an National Instrument (NI) Peripheral Component Interconnect NI-PCI_1422 image acquisition board (National Instrument, Huston, TX, USA) are housed in PCI slots in the host computer (MJ-12 7550I, Alienware, Maimi, FL, USA) which contains an X2 7525 Dual Xeon motherboard supporting two Intel Xeon central processing units (CPUs; 3.4 GHz, 2 MB onboard cache, 800 MHz front side bus) and 4 GB DDR2 PC3200 random access memory. Two hard drives (Serial ATA, 3 GB/s, 160 GB, 16 MB onboard cache, 7,200 RPM, Hitachi, Ltd., Tokyo, Japan) were connected through the motherboard’s Redundant Arrays of Inexpensive Disks level 0 controller configured for data striping with a block size of 64 KB. The four-axis OASIS stepper-motor controller drives the x–y stepper-motor stage (LUDL Electronic Products Ltd., Hawthorne, NY, USA) of the microscope. Video signals from the Cohu camera are connected to the NI-PCI-1422 card. A mechanical shutter (Uniblitz LS6ZM2, Vincent Associates, Rochester, NY, USA) in the laser path is controlled by a shutter driver (Uniblitz VMM-D3, Vincent Associates) through two lines of digital input–output from the OASIS motion controller. A rotary stepper motor mount (PR50PP, Newport Corp.) housing a Glan laser linear polarizer (CLPA-12.0-425-675, CVI Laser, LLC, Albuquerque, NM, USA) is controlled by the OASIS motion controller/driver to modulate laser trapping power.
Fig. 3.
Hardware diagram of system to study sperm motility and energetics. The upper-level system includes the components in the double-line box, and the lower-level system includes the components in the single-line box
The lower-level system, shown in the single-line box in Fig. 3, contains a Dell Socket 478 P4 planar motherboard supporting an Intel Pentium 4 CPU (2.8 GHz). An image acquisition board (Roper Scientific) is housed in the computer to digitize the camera signal from the Quantix camera. A data acquisition board (NI 6024e, National Instruments) is also housed in the computer to control the arc lamp shutter (Uniblitz LS6ZM2; placed in front of Zeiss FluoArc) through a shutter driver (Uniblitz VMM-D3). The Dual-View system in front of the Quantix camera images two spectrally separated copies of the specimen plane onto the camera. The color channels are aligned prior to each experiment.
2.4 System software design
The real-time sperm tracking, automatic laser trapping, and ratiometric fluorescent image processing is custom-coded in the LabView 8.2 language (National Instruments). The operation of real-time tracking and automatic laser trapping is performed in the upper-level system. Fluorescent image acquisition, processing and storage are done in the lower-level system. The two computers are networked together over a gigabit Transmission Control Protocol/Internet Protocol cat5e crossover connection (not shown in Fig. 3). Communication between the two systems is optimized with Labview’s shared variables and VI server functions (National Instruments) in which the lower-level system continuously polls the upper-level system for the next request. This polling method requires a minimal time for communication.
In the upper level system, phase contrast images from the Cohu CCD camera are digitized by the image acquisition board and transferred into a continuous buffer from which they are retrieved for image analysis and displayed in the front panel (graphically user interface) of the custom-designed code as shown in Fig. 4. The bright dots in the image window represent living sperm within a Rose chamber placed on the microscope stage. The tracked sperm is constantly re-centered by moving the microscope stage when it moves towards the edge of the field of view. The command menu (as shown in Fig. 4) allows the user to define different features in the experiment:
Fig. 4.
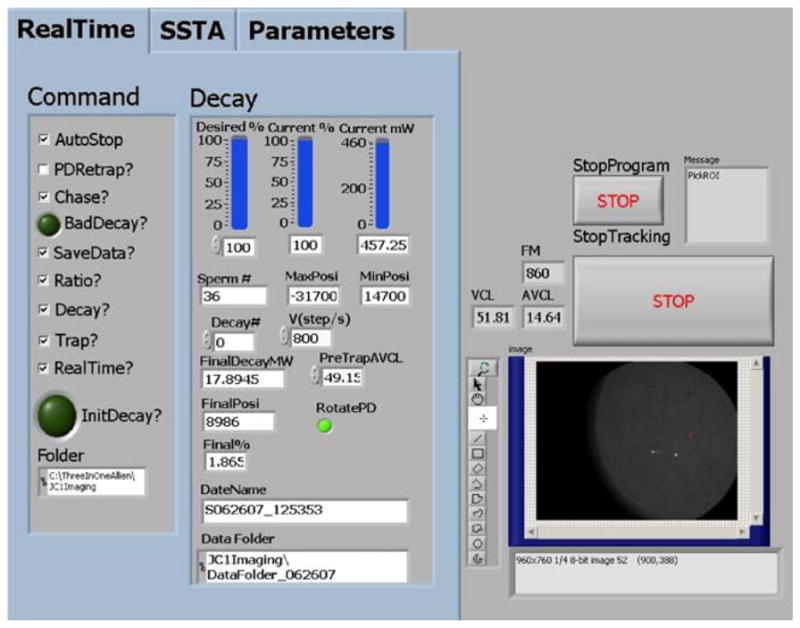
Front panel of custom-designed code to study sperm motility and energetics. The RealTime menu contains all the commands to specify experimental tasks and display laser power for Decay experiments. The SSTA menu (hidden) is used to load the saved images from the hard drive or camcorder. The Parameters menu (hidden) defines the parameters such as laser position, 1st frame to trap, trap duration, and track duration
AutoStop: the program will track a sperm for the track duration (defined in Parameter menu in Fig. 4). If not checked, the program will track the sperm until the user presses StopTracking or StropProgram button.
Trap: the program will move the tracked sperm under the laser trap position (defined in Parameter menu) and turn on the laser trap after tracking it for the trap duration (defined in Parameter menu). If Chase is checked, the sperm centroid position is extrapolated using a multi-thresholding method to predict the sperm’s position beyond the most recent image in order to compensate for swimming during the stage movement.
Decay: laser power is decayed after a sperm is stably trapped. Parameters are entered for maximum laser power, rate of power decay, and if appropriate, duration of the trap in the Decay tab in Fig. 4. If Decay is not checked, the laser power is held constant (0–460 mW at the focal spot after the objective) for the trap duration in the trapping phase of the experiment. If PDRetrap is checked, the program will re-trap the same sperm starting from the maximum laser power and it will gradually decay again.
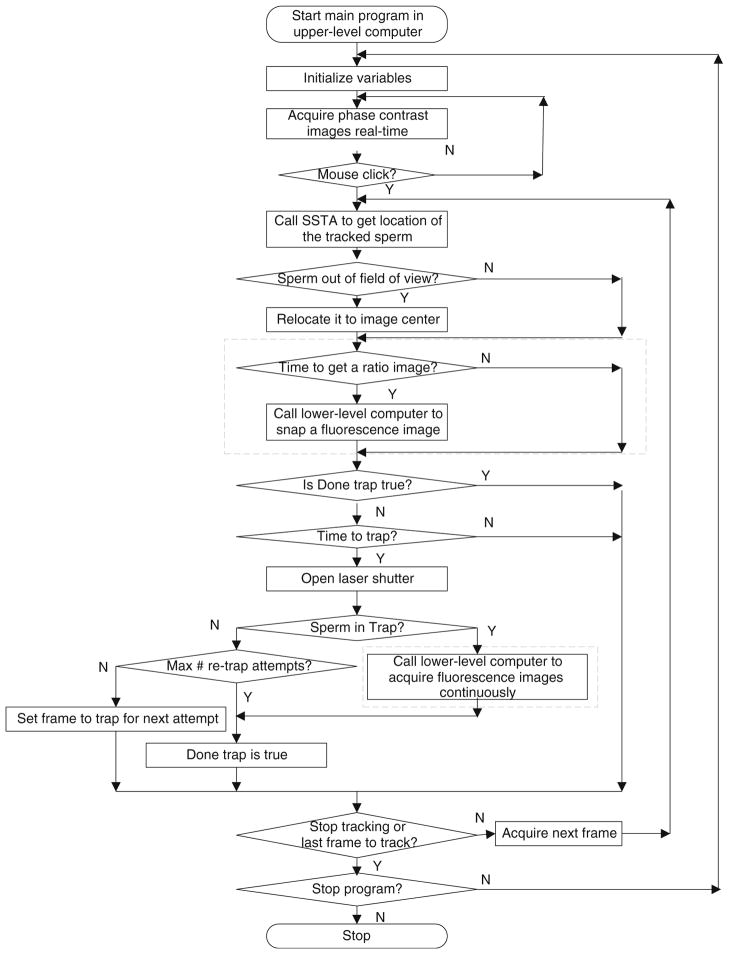
Ratio: the program on the upper-level system establishes a one-way connection and autonomously runs the subroutine on the lower-level system. This subroutine then opens up another one-way connection to the upper-level system, allowing a two-way cross-communication between the systems. During “track and trap”, the program sets a command variable when it is time to acquire the fluorescent image (the variable is set to 1 for pre-trap, 2 for post-trap, and 3 for in-trap). The subroutine records a fluorescent image if the command variable changes to 1 or 2, and continues acquiring the images when the command variable is set to 3.
The flow chart of the algorithm for track–trap-fluorescent imaging is shown in Fig. 5. The two dashed boxes represent the subroutines in the lower-level computer.
Fig. 5.
Flowchart of track–trap-fluorescent imaging. The gray box is for the logic of fluorescent imaging
The proposed program replaces our manual protocol as previously described (Nascimento et al. 2006 and Mei et al. 2005) and adds the fluorescent imaging feature in Shi et al. 2006. User input is limited to selecting a sperm by clicking on its image with the arrow curser on the front panel in Fig. 4. Swimming parameters are calculated and saved in a continuously updated data file. Since new images arrive at 40 frames per second, it is necessary to restrain net computation and data writing time to less than 25 ms in order to capture and process each image. The program is coded to use the most recent frame in the buffer.
The subroutine in the lower-level computer is used to acquire the fluorescent image, calculate the ratio value and store the images to the hard drive when commanded by the upper level computer. A sample raw fluorescence image acquired from the Quantix camera is shown in Fig. 6(a). The image processing logic in the subroutine is:
Fig. 6.

Image processing of fluorescent images (a) the raw image taken by the Quantix camera, (b) and (c) the enlarged partial image of the left and right channels respectively, (d) and (e) are the images after background subtraction
Two square regions are extracted from the raw image centered about the laser trap in both the left (red) half and the right (green) half of the image as shown in Fig. 6(b, c) respectively.
The two images are enhanced separately by subtracting background as shown in Fig. 6(d) for left channel and Fig. 6(e) for the right channel. Any negative pixel values are set to zero.
A four class threshold analysis is performed on each image. Binary images are created using the lower level of the third class as the threshold value.
The binary red image undergoes a morphological transformation (dilation), creating the “red mask.”
The binary green image is multiplied by the red mask in order to eliminate any extraneous background noise. Since both images prior multiplication are in binary format, the particle in the resulting image is size limited by the green image. This ensures that the channel with the lower signal to noise ratio (green channel) governs particle size. The resulting image is the “green mask.”
The green mask is applied to the images found as a result of step (2). This ensures the particle size is identical in both the left and right channels and to avoid division by zero.
The ratio of the red image to the green image is calculated. The maximum, minimum, and mean intensity pixel values of the ratio image are written in real-time to a data file.
3 Results
This system described here provides a real-time platform for analysis of sperm swimming speed (VCL), swimming force (in terms of escape laser power) and energetics (using fluorescent ratio imaging of mid-piece membrane potential). Fluorescent ratio image acquisition and process performed by the lower-level system does not affect the real-time sperm “track and trap” processing time performed the upper-level system since the latter only changes a command variable when it requests an action from the former. The “track and trap” algorithm is able to operate at 40 frames per second when the tracked sperm is swimming inside the field of view, with only one or two images lost during microscope stage movement. Simple selection of various command choices in the front panel of the custom-designed code (Fig. 4) enables the user to perform several different types of biological experiments without requiring further code modifications. Example experiments include tracking sperm for user-preferred length, tracking sperm and acquiring fluorescent ratio values periodically, and tracking and trapping sperm at constant or decaying laser power either with or without fluorescent ratio imaging.
3.1 Sperm tracking and ratio imaging
For experiments using simultaneous sperm tracking and fluorescent ratio imaging, the sperm is tracked continuously and the ratio images are periodically captured. Figure 7(a) plots the ratio values of 38 randomly picked sperm, each tracked continuously for approximately 1 min by the upper-level system at 40 frames per second. Fluorescent images, taken every 1 s, are acquired just after a sperm is relocated via microscope stage movement to the user-defined location. The average ratio value per sperm is calculated (ranging from 4.5 to 6.2), and the total average for those 38 sperm is 5.55. Figure 7(b) shows the average ratio values in Fig. 7(a) with respect to each sperm’s VCL.
Fig. 7.
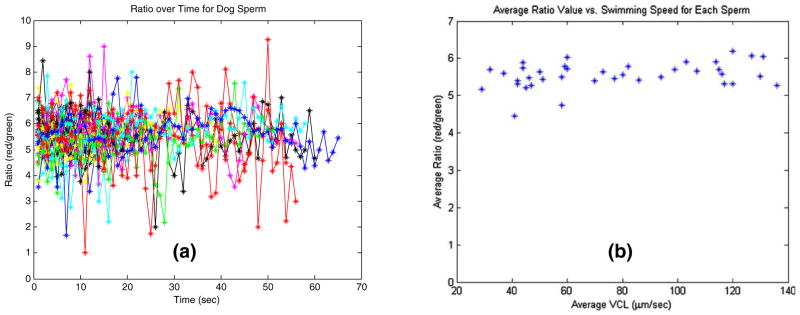
Results of 38 different sperm tracked for approximately 1 min and fluorescently imaged every second. Ratio value is plotted against time (seconds) in (a). (b) plots the average ratio value for each sperm against the sperm’s swimming speed (VCL)
Using the developed system, the VCL and fluorescent ratio fluctuations of each individual sperm in Fig. 7 can be monitored. For each frame, an instantaneous VCL value is calculated. The fluctuations in ratio value are mapped against those of VCL as a function of time. The instantaneous VCL values from three frames (frame prior to ratio image frame, ratio image frame, and frame post ratio image frame) are averaged to account for the longer fluorescent camera exposure time compared to the phase camera exposure time. These two parameters, from randomly selected sperm in Fig. 7, are plotted against time in Fig. 8.
Fig. 8.
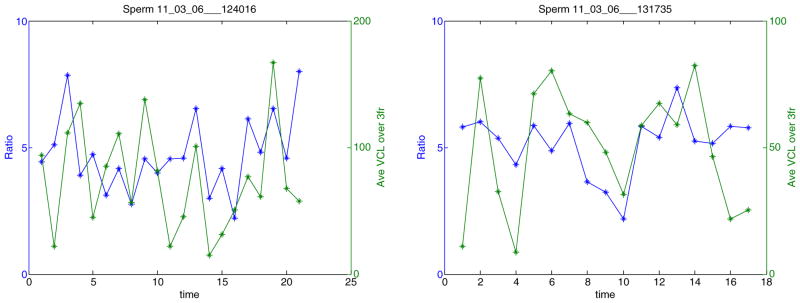
Swimming speed (VCL) and fluorescent ratio fluctuations of each individual sperm. The left y-axis is the ratio value. The right y-axis is the VCL value averaged over three frames around the frame a ratio image is taken. Both are plotted against time (seconds)
3.2 Sperm tracking, laser trapping at constant power and ratio imaging
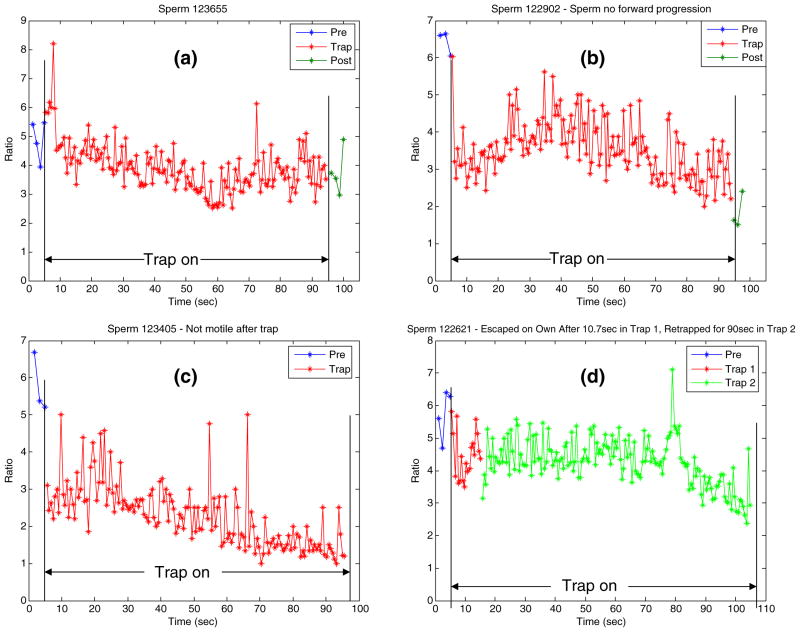
The proposed system also can be used to quantify the effects of prolonged exposure to the laser trap on sperm energetics. Figure 9 plots the ratio values of four different sperm during pre-trap (time from 0 to 5 s), in-trap (time from 5 to 95 s), and post-trap (time from 95 to 100 s) periods. The sperm was trapped with 460 mW laser power (in the focal volume) for 90 s. The average ratio values varied from pre-trap to in-trap to post-trap in all four sperm (actual values are shown in Table 1). The VCL values also varied from pre-trap to post trap as listed in Table 1. Note that the sperm in Fig. 9(b) had no forward progression, after the trap turned off and that the sperm in Fig. 9(c) was immotile. In Fig. 9(d), after 10.7 s, the sperm was able to escape the trap even at the constant high laser power and the program was able to track it and re-trap it stably for the full 90 s. Both the post VCL and ratio values for this sperm were not taken as the sperm swam to a different focal plane after the trap turned off and was lost by the tracking system.
Fig. 9.
(a–d) Ratio values of sperm for pre-trap, in-trap (held at constant power) and post-trap sequences. One fluorescent image is taken every second for the pre-trap and post-trap sequences and continuously for in-trap
Table 1.
Sperm swimming speed (VCL) and ratio values in Fig. 9
| # | Pre-trap VCL (μm/s) | Post-trap VCL (μm/s) | Pre-trap average ratio | In-trap average ratio | 1st in-trap ratio | Last in-trap ratio | Post-trap average ratio |
|---|---|---|---|---|---|---|---|
| 1 | 62 | 55 | 4.89 | 3.92 | 5.8 | 3.5 | 3.78 |
| 2 | 94 | 16 | 6.43 | 3.5 | 6.0 | 2.2 | 1.84 |
| 3 | 45 | 0 | 5.76 | 2.3 | 3.1 | 1.2 | 1.2 |
| 4 | 95 | NA | 5.74 | 4.5trap1 4.3trap2 | 5.8trap1 3.8trap2 | 4.3trap1 2.9trap2 | NA |
3.3 Sperm tracking, laser trapping with decaying power and ratio imaging
For this set of experiments, swimming force is measured (as a function of escape laser power) in addition to swimming speed and mitochondrial membrane potential. After a sperm is stably trapped, the laser power is decayed automatically from a starting power of 460 mW. The ratio values over time of two individual sperm are shown in Fig. 10. The escape power was 115 mW in Fig. 10(a) and 3.6 mW in Fig. 10(b). The VCL varied from 67 μm/s pre-trap to 60 μm/s post trap in Fig. 10(a) and from 72 μm/s pre-trap to 53 μm/s post trap in Fig. 10(b).
Fig. 10.
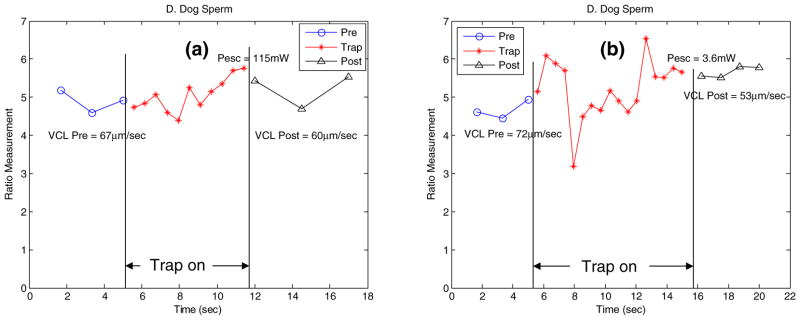
(a, b) Ratio values of sperm for pre-trap, in-trap (decayed) and post-trap sequences. One fluorescent image is taken every second for the pre-trap and post-trap sequences, and continuously for in-trap
4 Discussion
The proposed integrated robotic laser and microscope system has achieved real-time automated measurement of the sperm mitochondria membrane potential using a ratiometrically-encoded fluorescent probe. The measurement of sperm VCL and escape laser power are also obtained simultaneously. A two-level computer system is constructed to do the three tasks at once: the upper-level system performs “track and trap” and the lower-level system achieves fluorescent image acquisition, processing, and storage. The processing time in the upper-level system is not increased using the proposed communication structure. Compared to the previous single-level system described in Mei et al. (2005), the experimental throughput using the two-level automatic system has been increased by an order of magnitude and has allowed the analysis of ratio values prior to and post trapping.
A series of biological experiments have been carried out using the proposed system. As can be seen in Fig. 7, the fluorescent images of the sperm of interest can be acquired and the ratio values of the red channel over the green channel can be calculated in real-time when the sperm is tracked over a period of time (65 s). The ratio values of 38 randomly selected sperm were quite consistent with respect to time within the population as shown in Fig. 7(a). Using the developed system, the swimming speed (VCL) and fluorescent ratio fluctuations of each individual sperm in Fig. 7 can be monitored as shown in Fig. 8. Figure 9 presented the ratio values of four different sperm before, during and after they were trapped. They were held by the laser tweezers at constant power (460 mW in the focal volume) for 90 s. The ratio values appeared to decline in Fig. 9(a–c). The sperm displayed in Fig. 9(d) escaped from the high laser power after 10.7 s. The custom-built algorithm is able to re-trap it and hold it in the laser trap for the defined trap duration. Figure 10 illustrated the ability to measure the ratio values of individual sperm as well as their escape laser power and VCL. The sperm in Fig. 10(a) escaped from the laser trap at a relatively higher laser power than that of the sperm in Fig. 10(b) (115 vs. 3.6 mW). Compared with previous work (Mei et al. 2005), we now can obtain the pre-trap and post-trap ratio values which makes it possible to gain a better understanding of the effect of the optical trap on sperm energetics.
Although it is too early to draw any significant biological conclusions based on these preliminary results, it is demonstrated how the proposed system can be used to study various important questions. One question pertains to the effects of prolonged laser trap exposure. The preliminary results in Fig. 9(a–c) demonstrate that such a long laser trap exposure not only affects sperm swimming speed (as was found in Nascimento et al. 2006), but also mitochondrial membrane potential. Both the average VCL and ratio values after being released from the trap are decreased with respect to the values prior to being in the trap. The extreme example is shown in Fig. 9(c), where the sperm was not motile after being released from the trap. This decrease in motility and membrane potential could be due to the laser-induced rise in temperature. Another question pertains to the relationship between mitochondrial membrane potential and motility (both swimming speed and swimming force). Figures 7 and 10 demonstrate how, with a larger data set, a correlation between (a) swimming speed and membrane potential and (b) swimming force and membrane potential could be determined. Finally, Figs. 7, 8, 9 and 10 demonstrate how significant details on a per-sperm basis can be obtained using the proposed system. This type of detailed information for a given sperm can help lead to a better understanding of the relationship between sperm motility and fertility (Holt et al. 2007).
In summary, the system described here provides a platform to study the relationship between motility and energetics of sperm. This system can be used to test the sensitivity of fluorescent probes such as JC-1 and DiOC2(3). The system can also be used to verify the probes ability to respond to changes in the membrane potential when the cells are treated with agents that are known to affect mitochondrial metabolism. For example, Nascimento et al. (2007) showed an expected decrease in membrane potential when an uncoupler, carbonyl cyanide m-chlorophenylhydrazone (CCCP), was added to the sperm suspension. (CCCP is known to force a decrease in mitochondrial membrane potential, Novo et al. 1999 and Guzman-Grenfell et al. 2000). These kinds of studies should help improve our understanding of the relationship (s) between mitochondrial physiology, sperm energetics and motility.
Acknowledgments
This work was supported by grants from the Air Force Office of Scientific Research (No. F9620-00-1-0371) to MWB, and the Beckman Laser Institute Inc. Foundation.
Contributor Information
Linda Z. Shi, Email: zhixiashi@gmail.com, Department of Bioengineering, University of California San Diego, La Jolla, CA, USA.
Jaclyn M. Nascimento, Department of Electrical and Computer Engineering, University of California San Diego, La Jolla, CA, USA
Charlie Chandsawangbhuwana, Department of Bioengineering, University of California San Diego, La Jolla, CA, USA.
Elliot L. Botvinick, Beckman Laser Institute, University of California, Irvine, 1001 Health Sciences Rd, Irvine, CA 92612, USA. Department of Biomedical Engineering, University of California, Irvine, 3120 Natural Sciences II, Irvine, CA 92697, USA
Michael W. Berns, Department of Bioengineering, University of California San Diego, La Jolla, CA, USA. Department of Electrical and Computer Engineering, University of California San Diego, La Jolla, CA, USA. Beckman Laser Institute, University of California, Irvine, 1001 Health Sciences Rd, Irvine, CA 92612, USA. Department of Biomedical Engineering, University of California, Irvine, 3120 Natural Sciences II, Irvine, CA 92697, USA
References
- Amann RP, Katz DF. J Androl. 2004;25(3):317–325. doi: 10.1002/j.1939-4640.2004.tb02793.x. [DOI] [PubMed] [Google Scholar]
- Biggers JD, Whitten WD, Whittingham DG. In: The culture of mouse embryos in vitro in methods of mammalian embryology. Daniel JC Jr, editor. Freeman; San Francisco: 1971. pp. 86–116. [Google Scholar]
- Dantas ZN, Araujo E, Tadir Y, Berns MW, Schell MJ, Stone SC. Fertil Steril. 1995;63(1):185–188. [PubMed] [Google Scholar]
- Guzman-Grenfell AM, Bonilla-Hernandez MA, Gonzalez-Martinez MT. Biochim Biophys Acta. 2000;1464:188–198. doi: 10.1016/s0005-2736(99)00247-3. [DOI] [PubMed] [Google Scholar]
- Holt WV, O’Brien J, Abaigar T. Reprod Fertil Dev. 2007;19:709–718. doi: 10.1071/rd07037. [DOI] [PubMed] [Google Scholar]
- Kasai T, Ogawa K, Mizuno K, Nagai S, Uchida Y, Ohta S, Fujie M, Suzuki K, Hirata S, Hoshi K. Asian J Androl. 2002;4:97–103. [PubMed] [Google Scholar]
- Konig K, Svaasand L, Liu Y, Sonek G, Patrizio P, Tadir Y, Berns MW. Cell Mol Biol (Noisy-le-grand) 1996;42(4):501–509. [PubMed] [Google Scholar]
- Kuo Y, Tzeng WL, Li PC, Tang TS, Young ST. Arch Androl. 2000;44(1):29–39. doi: 10.1080/014850100262380. [DOI] [PubMed] [Google Scholar]
- Marchetti C, Obert G, Deffosez A, Formstecher P, Marchetti P. Hum Reprod. 2002;17(5):1257–1265. doi: 10.1093/humrep/17.5.1257. [DOI] [PubMed] [Google Scholar]
- Martinez-Pastor F, Johannisson AA, Gil J, Kaabi M, Anel L, Pax P, Rodriguez-Martinez H. Anim Reprod Sci. 2004;84:121–133. doi: 10.1016/j.anireprosci.2003.12.006. [DOI] [PubMed] [Google Scholar]
- Mei A, Botvinick E, Berns MW. Conf Optics and Photonics. SPIE; San Diego: 2005. [Google Scholar]
- Mortimer D. Practical laboratory andrology. Oxford University; New York: 1994. [Google Scholar]
- Nakagawa T, Oghalai JS, Saggau P, Rabbitt RD, Brownell WE. J Neural Eng. 2006;3:79–86. doi: 10.1088/1741-2560/3/2/001. [DOI] [PMC free article] [PubMed] [Google Scholar]
- Nascimento J, Botvinick EL, Shi LZ, Durrant B, Berns MW. J Biomed Opt. 2006;11(4):044001. doi: 10.1117/1.2337559. [DOI] [PubMed] [Google Scholar]
- Nascimento J, Shi LZ, Chandsawangbhuwana C, Tam J, Botvinick EL, Berns MW. J Biomed Opt. 2007 doi: 10.1117/1.2839051. in press. [DOI] [PMC free article] [PubMed] [Google Scholar]
- Novo D, Perlmutter NG, Hunt RH, Shapiro HM. Cytometry. 1999;35:55–63. doi: 10.1002/(sici)1097-0320(19990101)35:1<55::aid-cyto8>3.0.co;2-2. [DOI] [PubMed] [Google Scholar]
- Paniagua-Chavez CG, Jenkins J, Segovia M, Tiersch TR. Cryobiology. 2006;53(1):128–138. doi: 10.1016/j.cryobiol.2006.05.001. [DOI] [PubMed] [Google Scholar]
- Shapiro HM. J Microbiol Methods. 2000;43:3–16. doi: 10.1016/s0167-7012(00)00167-6. [DOI] [PubMed] [Google Scholar]
- Shi LZ, Nascimento J, Chandsawangbhuwana C, Berns MW, Botvinick EL. Microscopy Research and Technology. 2006;69:894–902. doi: 10.1002/jemt.20359. [DOI] [PubMed] [Google Scholar]
- Sinha SR, Saggau P. Methods. 1999;18:204–214. doi: 10.1006/meth.1999.0773. [DOI] [PubMed] [Google Scholar]
- Tadir Y, Wright WH, Vafa O, Ord T, Asch RH, Berns MW. Fertil Steril. 1989;52(5):870–873. [PubMed] [Google Scholar]
- Troiano L, Granata AR, Cossarizza A, Kalashnikova G, Bianchi R, Pini G, Tropea F, Carani C, Franceschi C. Exp Cell Res. 1998;241(2):384–393. doi: 10.1006/excr.1998.4064. [DOI] [PubMed] [Google Scholar]
- Young ST, Tzeng WL, Kuo YL, Ksiao ML, Chiang SR. IEEE Eng Med Bio. 1996;15(6):117–120. [Google Scholar]


