

Abstract
Noninvasive studies of human brain function hold great potential to unlock mysteries of the human mind. The complexity of data generated by such studies, however, has prompted various simplifying assumptions during analysis. Although this has enabled considerable progress, our current understanding is partly contingent upon these assumptions. An emerging approach embraces the complexity, accounting for the fact that neural representations are widely distributed, neural processes involve interactions between regions, interactions vary by cognitive state, and the space of interactions is massive. Because what you see depends on how you look, such unbiased approaches provide the greatest flexibility for discovery.
Why does the brain, and not the pancreas or any other human organ, arouse such popular interest? The key reason is that the brain implements the mind. Understanding how the brain works could help uncover the fundamental principles of cognition and behavior.
The development of magnetic resonance imaging (MRI) began a new era in cognitive neuroscience. Exploiting differences in magnetic susceptibility between oxygenated and deoxygenated blood [blood oxygenation level–dependent(BOLD)contrast], functional MRI (fMRI) detects metabolic activity, and by inference, neuronal activity, noninvasively throughout the brain. This technique generates complex data sets: ~100,000 locations, measured simultaneously hundreds of times, resulting in billions of pairwise relations, collected in multiple experimental conditions, and from dozens of participants per study. With this powerful technology in widespread use, data analysis has become the bottleneck for progress. What is the best way to find the mind in brain data?
This review is organized around four desiderata for examining the mind with fMRI, each embracing a different aspect of the nature and complexity of human brain function: (i) neural representations are widely distributed within and across brain regions, (ii) neural processes depend on dynamic interactions between regions, (iii) these interactions vary systematically by cognitive state, and (iv) the space of possible interactions has high dimensionality. All four complexities can be accounted for by harnessing recent advances in large-scale computing. Such unbiased approaches are beginning to reveal how disparate parts of the brain work in concert to orchestrate the mind.
Distributed Representations
The most basic approach for finding the mind in the brain is to test for homologies between mental functions and brain regions. The expectation that functions should align to discrete regions emerged from studies of patients with focal brain damage, an emphasis in systems neuroscience on brain “areas,” and theoretical views about modular brain organization. This approach identified several specialized brain regions, including areas for perception, action, language, emotion, and memory.
In fMRI, brain activity is not measured at the level of regions but rather in terms of volumetric pixels (voxels). The average amplitude of BOLD activity evoked by trials relative to baseline (“activation”) identifies voxels that are responsive to the function engaged by that trial type (Fig. 1). A classic discovery is that discrete clusters of voxels in visual cortex are selective for particular object categories (1). This univariate approach remains dominant and productive; for example, it was used recently to show that category selectivity may, in fact, be organized as a continuous gradient, with each voxel reflecting a point in semantic space (2).
Fig. 1. Standard types of fMRI analysis.
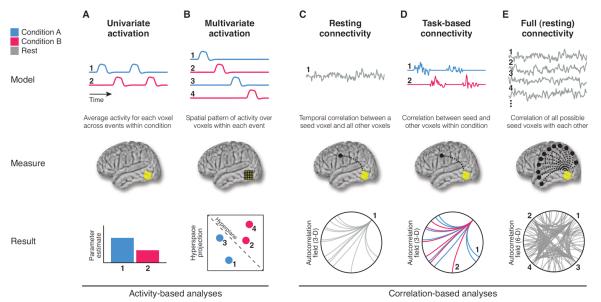
(A) Univariate activation refers to the average amplitude of BOLD activity evoked by events of an experimental condition. (B) Multivariate classifiers are trained on patterns of activation across voxels to decode distributed representations for specific events. (C) Resting connectivity is the temporal correlation of one or more seed regions with the remainder of the brain during rest. (D) Task-based connectivity examines how these correlations differ by cognitive state. (E) Full connectivity considers all pairwise correlations in the brain, most commonly at rest.
There is nothing intrinsically flawed about measuring activation in a voxel or region in isolation from the rest of the brain. Limitations can arise, however, from the use and interpretation of this approach, especially when voxels or regions are assumed to be independent. Although fMRI discretizes the brain into images, the underlying areas of tissue are not necessarily discrete. Because the goal is to understand the brain—not the content of these images per se—methods sensitive to dependence between voxels are necessary.
Multivariate pattern analysis (MVPA) was developed in response (3). This technique relies on tools from machine learning to decode patterns of activation across voxels. One of the first discoveries enabled by MVPA was that information about a category is present throughout visual cortex, beyond voxels with the strongest activation to that category (4). This was a watershed moment: Seemingly atomic mental functions could be reflected in distributed and overlapping patterns in the brain.
The value of MVPA is especially clear when the overall activation in a region is weak or similar across conditions, but the pattern over voxels is informative. For instance, it has long been known that expectations influence perception—but how? There are two potential mechanisms: Either neurons coding for expected stimuli in sensory cortex are suppressed to minimize the redundancy of information in the brain, or neurons coding for unexpected stimuli are suppressed to sharpen population responses around expected stimuli. Neuronal activity in visual areas, such as V1, should decrease on average in both cases, which leads to attenuated but indistinguishable activation. However, MVPA revealed more information about expected versus unexpected stimuli in V1, consistent only with sharpening (5).
As another example, how can we hold vivid images in our mind's eye? Frontal and parietal regions that help maintain information in working memory lack detailed visual selectivity, and visual areas with the needed selectivity show little delay-period activation in working memory tasks. Despite this weak activation, however, MVPA of visual cortex can successfully decode what information is being held in mind (6, 7)—revealing that sensory machinery is recruited for working memory.
Interactive Processes
The advent of MVPA eliminated a bias to interpret brain regions as having homogeneous and discrete functions. This approach helped capture another core aspect of brain function: Regions do not work in isolation, with computation depending on local and long-range interactions. This can be reflected in fMRI coactivation: Voxels containing interacting neurons are more likely to activate together, which could produce distributed patterns visible to MVPA.
However, a limitation of most uses of MVPA is that they focus on (patterns of) activation and are thus blind to certain kinds of interactions. Voxels need not vary in activation to have selectivity: Neuronal populations may generally be active, with their function defined on the basis of which specific neurons are communicating with each other (8). (This is not a flaw of MVPA itself, which, as discussed later, can work with any kind of pattern.)
Examining temporal correlations in BOLD activity between voxels—functional connectivity (9)—helped address this issue. Even if a voxel has stable activation across experimental conditions, its functional connectivity with other voxels may vary. This technique has limitations, including that BOLD correlations do not indicate neuronal communication, say little about directionality, and must be interpreted cautiously (two voxels may interact with a common third voxel or a global factor, such as head motion, rather than each other). Nonetheless, some initial concerns have been allayed: Correlation is generally an appropriate metric, candidate neuronal substrates exist (10), and functional connectivity is anatomically constrained (11).
The most common application of functional connectivity is examining intrinsic correlations while participants rest, typically by modeling whole-brain BOLD activity with the time course from a seed region. This approach has helped characterize the functional architecture of the brain, namely, how regions group together into broader systems. One such system is the “default network,” a set of regions that are robustly correlated at rest. However, this finding did not fully realize the promise of functional connectivity for new discovery, as the same network had previously been identified in terms of baseline activation (12).
The added value of this approach is more apparent in a study that examined the default network with higher temporal resolution (13). Accelerated multiband fMRI sequences revealed that the default network may not be a stable network: Over time, its constituents interact differently with each other and with the rest of the brain. The existence of these temporally distinct “modes” is consistent with the neuronal populations above—the function of a region in the default network may only be definable with respect to its functional connectivity at that moment. Such investigations may also enhance our understanding of disorders like Alzheimer's disease, which targets the default network, as reflected in amyloid plaque deposits and disrupted function (12).
Active Tasks
The proliferation of functional connectivity eliminated a bias toward using activation as the basic unit of study, placing emphasis on pairwise relationships instead. However, as noted above, most functional connectivity studies are conducted at rest. There are advantages to this, including that data sets can be collected and compared across research sites and clinical populations (14). But, if the goal is to understand the mind, resting connectivity is only partly the answer—cognition is neither manipulated nor measured. Indeed, functional connectivity can be similar over rest and task states, but this is not guaranteed (15). For instance, resting connectivity itself is influenced by recent tasks (16, 17).
Studying connectivity during tasks is a more direct way to understand how cognitive processes are realized in the brain. There are many flavors of task-based functional connectivity, each with strengths and weaknesses (9). To highlight one approach, “background connectivity” retains the simplicity of resting connectivity but accounts for different cognitive states (18). The logic is that BOLD activity contains two task-related sources of variance: evoked activity related to stimuli and responses and endogenous activity related to establishing and maintaining the current cognitive state (19). After accounting for nuisance variables, precise models of the evoked activity leave the endogenous activity in the residuals, which can be correlated across voxels to estimate background connectivity in different cognitive states.
As a case study, consider selective attention—our ability to prioritize sensory input that is important for achieving one's current goals (20). In humans, this has typically been examined with activation. For example, when shown a blended image of a face and a scene, attending to the face activates face-selective visual cortex and attending to the scene activates scene-selective visual cortex (21). Attended information gets prioritized because these strengthened representations compete better against those of unattended information.
A different mechanism is suggested by models of cognitive control, which emphasize the guidance of activity along neural pathways (22), and by neurophysiological studies, which link attention to long-range synchrony (23). Attention may act as if switching train tracks: Goals represented in frontal and parietal cortex establish connections between visual areas to route sensory information along relevant pathways. We recently found evidence consistent with this mechanism (Fig. 2): In the task above, attending to faces increased background connectivity between brain area V4 and face-selective cortex, and attending to scenes increased connectivity between V4 and scene-selective cortex (24). This modulation of connectivity predicted behavior, was unrelated to activation, and persisted without stimulation. These findings in the human brain join with recent findings in nonhuman primates (25, 26) to form a coherent story about how functional connectivity within the visual system supports attention.
Fig. 2. Attentional modulation of functional connectivity.

(A) The guided activation theory of cognitive control posits that prefrontal cortex (PFC) sends feedback to posterior cortex to switch connectivity between areas and establish task-relevant pathways (22). (B) Such pathways exist in the visual cortex of nonhuman primates: V4 shows enhanced coherence with the area of V1 containing receptive fields for the attended target (25). (C) This mechanism also supports category-based selection in human visual cortex: V4 shows stronger background connectivity with the fusiform face area (FFA) when faces are attended and with the parahippocampal place area (PPA) when scenes are attended (24). Figures adapted with permission.
Task-based connectivity is especially useful for understanding how brain systems influence each other. For example, we frequently make decisions between options with which we have no direct experience, such as new restaurants or books—how is this possible? Interactions between the striatum and hippocampus may help: When a stimulus is rewarded, the value created in the striatum not only attaches to the rewarded stimulus, but also, via functional connectivity, to other associated stimuli reactivated in the hippocampus—creating preferences by association (27). This technique can even be used to study how entire brains influence each other: during communication, the brains of speakers and listeners become coupled, and the extent of coupling predicts comprehension (28).
Full Correlation
Relating brain dynamics to tasks eliminated a bias to assume that functional connectivity is stationary. Nevertheless, this approach is not fully unbiased, as seed regions typically need to be chosen. This is problematic for two reasons. First, it resurrects the issue that inspired functional connectivity in the first place: Seeds are often defined on the basis of activation in different tasks, which leads to an assumption that regions with robust activation (or activation differences) are most interactive or that their interactions are most informative. Second, seeds restrict analysis to a tiny subset of possible interactions. A brain with N = 50,000 voxels contains N(N – 1)/2 = 1,249,975,000 unique voxel pairs, but only N – 1 = 49,999 of these are considered for any given seed. Placing such limits on analysis can hamper progress when the effects of interest in a field are unknown (29).
Why then does functional connectivity analysis use seeds at all, rather than the full voxelwise correlation matrix? One reason is to avoid the statistical challenges associated with big data and to allow more specific models to be tested with greater power. A second reason is that calculating such matrices is computationally demanding, and seeds shorten and simplify analysis. With the increased availability of high-performance computing, however, such compromises are becoming unnecessary.
The full correlation matrix can be represented as a six-dimensional (6-D) autocorrelation field: For each voxel in the 3-D brain, there is a 3-D brain of functional connectivity with every other voxel. Computing all pairwise correlations was prohibitively slow in the past—up to hours or days (30). Matrix multiplication can be used for drastically improved computational speed: If each voxel's time course is mean-centered and the result is divided by its root sum of squares, the Pearson correlation of any two voxels is reduced to the sum of pointwise products over time (the dot product), and the full matrix of coefficients is obtained by the product of a voxels-by-time matrix and its transpose (31). Technological advances can reduce such large matrix multiplication operations to less than 1 s.
Analysis of the full correlation matrix during rest has started yielding insights into the topology and dynamics of human brain networks. If each voxel is treated as a node, and all correlations between that and other nodes above some threshold are treated as edges, then the resulting binary matrix generates a graph (32). These voxelwise graphs can be characterized quantitatively with network measures (33), including degree, number of edges for a node; modularity, density of edges within versus between node clusters; path length, minimum number of edges between nodes; and centrality, proportion of shortest paths passing through a node.
In this lexicon, functional brain networks exhibit high modularity and short path lengths (32, 34). High modularity reflects strong connections between nodes that contribute to the same function, such as in visual cortex, whereas short path lengths reflect connections between these node communities via “hub” nodes that have high centrality and tend to be connected to each other, such as in frontal cortex (35). These two properties fit the definition of a “small-world” network, an organizational scheme found in many biological and nonbiological complex systems that enables efficient information processing, both locally within modules and globally across the network (33).
Thinking of brain function as a small-world network has enabled progress on several fronts. For example, it was recently discovered that although voxelwise graphs from infants' brains also have small-world properties, their cortical hubs are located in different places than adults—unexpectedly, in primary sensorimotor cortex (36). There is variation in network properties even among adults: Some brains have shorter path lengths, and these individuals score higher on an intelligence test (37). These studies suggest that investigating how information is integrated across the brain holds particular promise for understanding the origins and limits of cognition.
Outlook
Taking stock, we have considered four desiderata: fMRI analysis should account for the fact that neural representations are widely distributed, that neural processes depend on interactions, that these interactions differ by cognitive state, and that the space of interactions is massive. Developing approaches that incorporate all of these complexities holds tremendous potential. Although the full correlation studies described above come close, they have largely only examined the resting state, missing an opportunity to relate the brain's large-scale structure and dynamics directly to ongoing cognition.
The full combined approach (or full correlation matrix analysis, FCMA) could involve several steps (Fig. 3). During an fMRI experiment with different experimental conditions, whole-brain BOLD activity might be divided into separate time windows for each instance of a condition. The full correlation matrix would be computed for each window. This restructures the data from 4-D (3-D brain over time) to 7-D (6-D autocorrelation field over windows). The resulting matrices might then be mined using MVPA, with voxel pairs defining the dimensions of a large hyperspace, and the correlation coefficient for each pair providing the value in that dimension. Several outcome measures are possible, including the classifier's cross-validation accuracy, which indicates the extent to which task-related interactions were present. In addition, the weights of the classifier or the output from a feature selection step could be used to identify which specific pairwise relationships discriminated best between conditions. A software toolbox that we developed to implement this analysis pipeline on a compute cluster shows that it is computationally tractable (www.princeton.edu/fcma).
Fig. 3. Full correlation matrix analysis pipeline.

(A) An fMRI data set is divided into time windows, which are labeled with an experimental condition. (B) Each window contains multiple time points, and each time point corresponds to a 3-D brain image. (C) The time course of BOLD activity in every voxel is correlated with every other voxel to produce a full correlation matrix for each window. (D) An example matrix from a 36-s block of fMRI data is depicted with 39,038 voxels arranged in a circle and 0.01% of correlations of >0.3 plotted as links (visualization created with Circos, www.circos.ca). The luminance and thickness of links reflects the absolute correlation in four graded steps. The surrounding histogram is a count of the number of above-threshold links per voxel. (E) These matrices can be submitted as examples to MVPA, with each voxel pair as an input dimension. Data-driven feature selection helps discover meaningful relationships for classification. For more information: www.princeton.edu/fcma.
There are several challenges for the large-scale multivariate analysis of task-based functional connectivity, including consideration of statistical correction, spatial and temporal resolution, spectral frequency, causality, intersubject alignment, and visualization. Indeed, although there are likely bigger “big data” in neuroscience, such as cellular-level structural connectivity and gene expression assays, FCMA presents unique opportunities related to studying the dynamics of human brain function in vivo and noninvasively. The greater resolution enabled by multiband fMRI (13)—coupled with consideration of multiple time windows, window lengths, and phase offsets, as well as a large number of psychological variables and the rich repertoire of human behavior—increases the computational load by several orders of magnitude.
Nevertheless, elements of FCMA can be found in the literature. Some studies have computed large correlation matrices during different cognitive states but did not use MVPA. Instead, they focused on relating network measures to cognitive states. For example, path length is shorter when awake compared to when in stage-1 sleep (38) and also in successful versus unsuccessful auditory learners (39). Other studies have used MVPA to classify cognitive states but only over smaller regional or subregional correlation matrices (40, 41).
One study of the latter type engaged participants in four tasks: remembering the day's events, resting with eyes closed, silently singing lyrics, or counting backward (42). The correlation matrix from 90 functional regions of interest was computed for each task in one group of participants, and the cells in the matrix (region pairs) selective for each task were used to construct “connectivity templates” (Fig. 4). Correlation matrices were computed for the same tasks in a separate group of participants. The task from which these matrices were obtained could be classified with high accuracy on the basis of their similarity to the other group's templates.
Fig. 4. Pattern analysis of correlations.
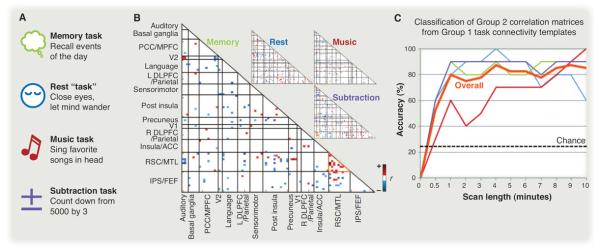
(A) fMRI data were collected during four cognitive states. (B) The correlation matrix of 90 functional regions during each state. Each cell reflects the correlation between two regions, thresholded on the basis of the reliability of the correlation across participants. Pairs that were reliable in more than one state were excluded, generating a task-specific template. Grid lines demarcate anatomical regions, each containing a variable number of functional regions. (C) Using these templates, correlation matrices from a second group of participants could be decoded into cognitive states with high accuracy. Figures adapted with permission from (42).
Conclusions
Interactions between variables may hold the key to understanding complex biological and social systems (43). There is precedence for this in neuroscience, where physiological recordings of single neurons are giving way to large multiunit arrays and multiple recording sites (44). Immensely rich data are generated by fMRI, of which only a fraction is typically analyzed. An unbiased approach, combining advances in computer science (from large-scale computing, machine learning, and graph theory) with clever experiments in psychology and cutting-edge tools from neuroscience, provides a fruitful platform for new discovery about the human brain—and about the mind that it implements.
Acknowledgments
The author thanks N. Hindy, V. Jackson-Hanen, and Y. Wang for help with manuscript preparation; J. Cohen, K. Li, and Y. Wang for formative discussions; and A. Ghazanfar, U. Hasson, C. Honey, and K. Norman for insightful comments on an earlier draft. This work was supported by the Pyne fund from Princeton University, the John Templeton Foundation, NSF grant MRI BCS1229597, and NIH grant R01 EY021755. The opinions expressed in this paper are those of the author and do not necessarily reflect the official views of these funding sources.
References and Notes
- 1.Kanwisher N. Proc. Natl. Acad. Sci. U.S.A. 2010;107:11163–11170. doi: 10.1073/pnas.1005062107. [DOI] [PMC free article] [PubMed] [Google Scholar]
- 2.Huth AG, Nishimoto S, Vu AT, Gallant JL. Neuron. 2012;76:1210–1224. doi: 10.1016/j.neuron.2012.10.014. [DOI] [PMC free article] [PubMed] [Google Scholar]
- 3.Norman KA, Polyn SM, Detre GJ, Haxby JV. Trends Cogn. Sci. 2006;10:424–430. doi: 10.1016/j.tics.2006.07.005. [DOI] [PubMed] [Google Scholar]
- 4.Haxby JV, et al. Science. 2001;293:2425–2430. doi: 10.1126/science.1063736. [DOI] [PubMed] [Google Scholar]
- 5.Kok P, Jehee JFM, de Lange FP. Neuron. 2012;75:265–270. doi: 10.1016/j.neuron.2012.04.034. [DOI] [PubMed] [Google Scholar]
- 6.Harrison SA, Tong F. Nature. 2009;458:632–635. doi: 10.1038/nature07832. [DOI] [PMC free article] [PubMed] [Google Scholar]
- 7.Serences JT, Ester EF, Vogel EK, Awh E. Psychol. Sci. 2009;20:207–214. doi: 10.1111/j.1467-9280.2009.02276.x. [DOI] [PMC free article] [PubMed] [Google Scholar]
- 8.Vaadia E, et al. Nature. 1995;373:515–518. doi: 10.1038/373515a0. [DOI] [PubMed] [Google Scholar]
- 9.Smith SM. Neuroimage. 2012;62:1257–1266. doi: 10.1016/j.neuroimage.2012.01.022. [DOI] [PubMed] [Google Scholar]
- 10.Wang L, Saalmann YB, Pinsk MA, Arcaro MJ, Kastner S. Neuron. 2012;76:1010–1020. doi: 10.1016/j.neuron.2012.09.033. [DOI] [PMC free article] [PubMed] [Google Scholar]
- 11.Honey CJ, et al. Proc. Natl. Acad. Sci. U.S.A. 2009;106:2035–2040. doi: 10.1073/pnas.0811168106. [DOI] [PMC free article] [PubMed] [Google Scholar]
- 12.Buckner RL. Neuroimage. 2012;62:1137–1145. doi: 10.1016/j.neuroimage.2011.10.035. [DOI] [PubMed] [Google Scholar]
- 13.Smith SM, et al. Proc. Natl. Acad. Sci. U.S.A. 2012;109:3131–3136. doi: 10.1073/pnas.1121329109. [DOI] [PMC free article] [PubMed] [Google Scholar]
- 14.Biswal BB, et al. Proc. Natl. Acad. Sci. U.S.A. 2010;107:4734–4739. doi: 10.1073/pnas.0911855107. [DOI] [PMC free article] [PubMed] [Google Scholar]
- 15.Hutchison RM, et al. Neuroimage. 2013;80:360–378. doi: 10.1016/j.neuroimage.2013.05.079. [DOI] [PMC free article] [PubMed] [Google Scholar]
- 16.Stevens WD, Buckner RL, Schacter DL. Cereb. Cortex. 2010;20:1997–2006. doi: 10.1093/cercor/bhp270. [DOI] [PMC free article] [PubMed] [Google Scholar]
- 17.Tambini A, Ketz N, Davachi L. Neuron. 2010;65:280–290. doi: 10.1016/j.neuron.2010.01.001. [DOI] [PMC free article] [PubMed] [Google Scholar]
- 18.Norman-Haignere SV, McCarthy G, Chun MM, Turk-Browne NB. Cereb. Cortex. 2012;22:391–402. doi: 10.1093/cercor/bhr118. [DOI] [PMC free article] [PubMed] [Google Scholar]
- 19.Summerfield C, et al. PLOS Biol. 2006;4:e128. doi: 10.1371/journal.pbio.0040128. [DOI] [PMC free article] [PubMed] [Google Scholar]
- 20.Chun MM, Golomb JD, Turk-Browne NB. Annu. Rev. Psychol. 2011;62:73–101. doi: 10.1146/annurev.psych.093008.100427. [DOI] [PubMed] [Google Scholar]
- 21.O'Craven KM, Downing PE, Kanwisher N. Nature. 1999;401:584–587. doi: 10.1038/44134. [DOI] [PubMed] [Google Scholar]
- 22.Miller EK, Cohen JD. Annu. Rev. Neurosci. 2001;24:167–202. doi: 10.1146/annurev.neuro.24.1.167. [DOI] [PubMed] [Google Scholar]
- 23.Noudoost B, Chang MH, Steinmetz NA, Moore T. Curr. Opin. Neurobiol. 2010;20:183–190. doi: 10.1016/j.conb.2010.02.003. [DOI] [PMC free article] [PubMed] [Google Scholar]
- 24.Al-Aidroos N, Said CP, Turk-Browne NB. Proc. Natl. Acad. Sci. U.S.A. 2012;109:14675–14680. doi: 10.1073/pnas.1202095109. [DOI] [PMC free article] [PubMed] [Google Scholar]
- 25.Bosman CA, et al. Neuron. 2012;75:875–888. doi: 10.1016/j.neuron.2012.06.037. [DOI] [PMC free article] [PubMed] [Google Scholar]
- 26.Saalmann YB, Pinsk MA, Wang L, Li X, Kastner S. Science. 2012;337:753–756. doi: 10.1126/science.1223082. [DOI] [PMC free article] [PubMed] [Google Scholar]
- 27.Wimmer GE, Shohamy D. Science. 2012;338:270–273. doi: 10.1126/science.1223252. [DOI] [PubMed] [Google Scholar]
- 28.Stephens GJ, Silbert LJ, Hasson U. Proc. Natl. Acad. Sci. U.S.A. 2010;107:14425–14430. doi: 10.1073/pnas.1008662107. [DOI] [PMC free article] [PubMed] [Google Scholar]
- 29.Beckmann CF, DeLuca M, Devlin JT, Smith SM. Philos. Trans. R. Soc. London B Biol. Sci. 2005;360:1001–1013. doi: 10.1098/rstb.2005.1634. [DOI] [PMC free article] [PubMed] [Google Scholar]
- 30.Tomasi D, Volkow ND. Proc. Natl. Acad. Sci. U.S.A. 2010;107:9885–9890. doi: 10.1073/pnas.1001414107. [DOI] [PMC free article] [PubMed] [Google Scholar]
- 31.Worsley KJ, Chen J-I, Lerch J, Evans AC. Philos. Trans. R. Soc. London B Biol. Sci. 2005;360:913–920. doi: 10.1098/rstb.2005.1637. [DOI] [PMC free article] [PubMed] [Google Scholar]
- 32.Eguíluz VM, Chialvo DR, Cecchi GA, Baliki M, Apkarian AV. Phys. Rev. Lett. 2005;94:018102. doi: 10.1103/PhysRevLett.94.018102. [DOI] [PubMed] [Google Scholar]
- 33.Bullmore E, Sporns O. Nat. Rev. Neurosci. 2012;13:336–349. doi: 10.1038/nrn3214. [DOI] [PubMed] [Google Scholar]
- 34.Mumford JA, et al. Neuroimage. 2010;52:1465–1476. doi: 10.1016/j.neuroimage.2010.05.047. [DOI] [PMC free article] [PubMed] [Google Scholar]
- 35.Power JD, Schlaggar BL, Lessov-Schlaggar CN, Petersen SE. Neuron. 2013;79:798–813. doi: 10.1016/j.neuron.2013.07.035. [DOI] [PMC free article] [PubMed] [Google Scholar]
- 36.Fransson P, Åden U, Blennow M, Lagercrantz H. Cereb. Cortex. 2011;21:145–154. doi: 10.1093/cercor/bhq071. [DOI] [PubMed] [Google Scholar]
- 37.van den Heuvel MP, Stam CJ, Kahn RS, Hulshoff Pol HE. J. Neurosci. 2009;29:7619–7624. doi: 10.1523/JNEUROSCI.1443-09.2009. [DOI] [PMC free article] [PubMed] [Google Scholar]
- 38.Uehara T, et al. Cereb. Cortex. 2013 [Google Scholar]
- 39.Sheppard JP, Wang J-P, Wong PCM. J. Cogn. Neurosci. 2012;24:1087–1103. doi: 10.1162/jocn_a_00210. [DOI] [PMC free article] [PubMed] [Google Scholar]
- 40.Mokhtari F, Hossein-Zadeh G-A. J. Neurosci. Methods. 2013;212:259–268. doi: 10.1016/j.jneumeth.2012.10.012. [DOI] [PubMed] [Google Scholar]
- 41.Pantazatos SP, Talati A, Pavlidis P, Hirsch J. PLOS Comput. Biol. 2012;8:e1002441. doi: 10.1371/journal.pcbi.1002441. [DOI] [PMC free article] [PubMed] [Google Scholar]
- 42.Shirer WR, Ryali S, Rykhlevskaia E, Menon V, Greicius MD. Cereb. Cortex. 2012;22:158–165. doi: 10.1093/cercor/bhr099. [DOI] [PMC free article] [PubMed] [Google Scholar]
- 43.Reshef DN, et al. Science. 2011;334:1518–1524. doi: 10.1126/science.1205438. [DOI] [PMC free article] [PubMed] [Google Scholar]
- 44.Nicolelis MAL, Ghazanfar AA, Faggin BM, Votaw S, Oliveira LMO. Neuron. 1997;18:529–537. doi: 10.1016/s0896-6273(00)80295-0. [DOI] [PubMed] [Google Scholar]