

Abstract
Budding yeast has served as an important model organism for aging research, and previous genetic studies have led to the discovery of conserved genes/pathways that regulate lifespan across species. However, the molecular causes of aging and death remain elusive, since it is very difficult to directly observe the cellular and molecular events accompanying aging in single yeast cells by the traditional approach based on micro-manipulation. We have developed a microfluidic system to track individual mother cells throughout their lifespan, allowing automated lifespan measurement and direct observation of cell cycle dynamics, cell/organelle morphologies, and various molecular markers. We found that aging of the wild type cells is characterized by an increased general stress and a progressive lengthening of the cell cycle for the last few cell divisions; these features are much less apparent in the long-lived FOB1 deletion mutant. Following the fate of individual cells revealed that there are different forms of cell death that are characterized by different terminal cell morphologies, and associated with different levels of stress and lifespan. We have identified a molecular marker – the level of the expression of Hsp104, as a good predictor for the lifespan of individual cells. Our approach allows detailed molecular phenotyping of single cells in the process of aging and thus provides new insight into its mechanism.
Introduction
Half a century ago, Mortimer and Johnston made the seminal discovery that individual cells of budding yeast have a finite lifespan even though the whole clone is immortal (Mortimer & Johnston 1959). This is possible as budding yeast divides asymmetrically, giving rise to a mother and a daughter that have different lifespans. While the mother cell progressively ages, the lifespan of the daughter is, to a good approximation, independent of the age of the mother. Mortimer and Johnston’s observed that individual mother cells become senescent and eventually die after producing on average about 25 daughters, a phenomenon termed replicative aging. In the 50 years since their initial discovery, yeast replicative aging has been established as an important model system, and genetic studies of mutants that alter the replicative lifespan have revealed many insights into conserved pathways and molecular mechanisms that function in other species (Johnson et al. 1999; Bishop & Guarente 2007; Kaeberlein 2010a). Such knowledge is beginning to translate into potentials for drug intervention, and indeed, some of the promising anti-aging drugs, originally found to extend lifespan of yeast, have already moved to clinical trials for treating age related diseases (Powers et al. 2006; Medvedik et al. 2007; Kaeberlein 2010b).
Despite the enormous progress made in the field over the last several decades, some of the fundamental questions remain unanswered. What goes wrong with the cell as it progressively ages? What are the changes occurring in various organelles during aging? What types of molecular damage eventually cause cell arrest and death? Genetic studies have identified a number of mutants that extend lifespan. However, the downstream mechanisms of action through which these mutations exert their effect on lifespan are largely unknown.
A major limitation to yeast aging research has been the inability to track mother cells and observe molecular markers during the process of aging. Fifty years after Mortimer and Johnston’s discovery, the technology used to analyze replicative aging remained essentially the same. To measure the number of daughter cells produced by each mother cell, Mortimer and Johnston grew yeast cells on an agar plate and used a micromanipulator (a microscope with a dissector) to remove daughter cells after each cell division. This is still the most widely used method for analyzing yeast lifespan. However, because the cells are grown on an agar plate, it is almost impossible to follow cell and organelle morphologies and track molecular markers throughout the lifespan of individual cells. Such high resolution, single cell analysis is critical for developing a mechanistic understanding of cellular aging and death. In addition, the traditional assay is laborious and time consuming, which makes it very difficult to perform large-scale screening for mutants with lifespan phenotypes. Previously, a number of attempts have been made to automatically separate the daughter from the mother cell by using microdevices (Koschwanez et al. 2005; Ryley & Pereira-Smith 2006). However, the devices developed so far lack sufficient stability and can track mother cells only for the first few generations, a time scale too short for the aging study.
Here we report the development of a microfluidic system capable of retaining mother cells in the microfluidic chambers while flushing away the daughter cells throughout the lifespan of the mother cells. Coupled with time-lapsed microscopy, the system allows us to simultaneously follow lifespan, cell division dynamics, cell/organelle morphology, and various fluorescently labeled proteins, in a large number of individual cells. Using this system, we were able to characterize various cellular and molecular phenotypes of aging cells, identify a molecular marker predictive of the lifespan of individual cells, evaluate the relevance of specific stresses to the aging process, and perform detailed molecular “autopsies” to examine the potential causes of cell death. Such detailed molecular characterization adds a new dimension to the analysis of the mechanism of cellular aging and death.
Results
The design of the microfluidic system and automated lifespan measurement
To develop a microfluidic system that can retain mother cells while flushing away daughter cells, we have made use of the two properties of the mother cells that distinguish them from their daughters: 1) mother cell is in general larger than it’s daughters; 2) mother cell keeps the old cell wall while the cell wall of its daughters is newly synthesized. Previous designs exploited the size difference between mother and daughter in order to separate them, e.g., a microfluidic device was developed that confine mother cells in micro-jails with open gates for daughter cells to escape. However such a device only works for the first few generations. As the size of the mother and the daughter cells grows with age, the daughter cells eventually become large enough to jam the gates (Ryley & Pereira-Smith 2006).
We found that confinement of the mother cells from the direction perpendicular to the flow plane (by setting the height of microfluidic chambers comparable to the size of the mother cells) achieves better differential retention between mother and daughter cells. However the effect is sensitive to the height of the chamber and the flow speed, causing the system to perform unreliably. The cells tend to either flush away or clog the device after several generations. To further differentially immobilize mother cells, we chemically modified the surface of the mother cells by Sulfo-NHS-LC-biotin, and modified the glass surface by biotinylated-BSA followed by neutravidin, so that the mother cells will adhere to the surface due to the formation of biotin-avidin bonds (Figure 1b). Daughter cells do not stick to the surface since they synthesize their cell wall anew. This chemical modification, by itself, does not produce a bond strong enough to withstand flow speeds sufficient for mother-daughter separation. However, in concert with the geometric confinement of the chamber, it permits the system to retain the mother cells without jamming throughout their lifespan. One chip design is illustrated in Figure 1, with the geometry of the chambers and channels shown in Figure 1c. Such a design leads to a smooth gradient of flux in different chambers, which is convenient for exploring the range of flux that is sufficient to separate the daughter cells (Supplementary Figure 1). The typical flow velocity in the main channel is ~300µm/s, and the typical range of velocities in the chambers is from 0 to ~30 µm/s.
Figure 1.
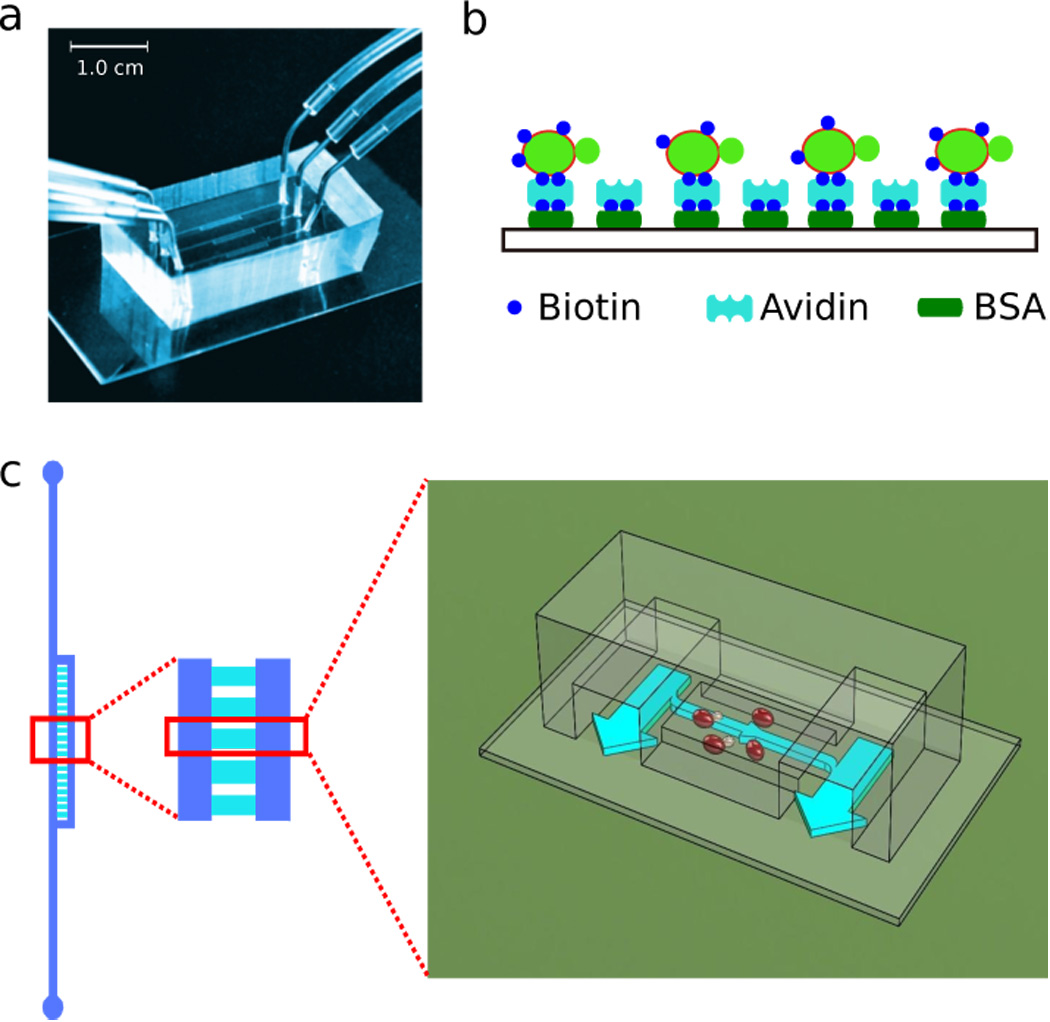
An example of chip design. a) A photograph of a chip with three independent channels. A soft PDMS with micro-channels (top) is sealed on a thin glass slide (bottom). The size of the device is indicated by the scale bar. b) A schematic of mother cell surface labeling and glass modification. c) Geometries of the channels (blue) and chambers (cyan). Arrows show the directions of fluid flow, with broader arrow indicating bigger flux. Cells (red ellipsoids) are loaded inside the chambers.
A number of considerations went into the design and several parameters were optimized after comparative studies of many different devices. These include the geometries of the chambers and channels that best discriminate mother from daughter, the uniformity of the flow speed in different chambers, the design of the main and the side channels to guide occasional air bubbles so that they will not wipe out the loaded cells, and a cell loading protocol that optimizes the adhesion of mother cells to the surface. The details of the design, the parameters, and the experimental protocols are described in the supplementary materials, and videos showing typical experiments are included in the supplementary files.
Using the designed microfluidic device and time-lapsed microscopy, we continuously monitored the growth and division of initially loaded mother cells throughout their lifespan (typically recording up to three days with a 10 minute time interval). The lifespan of each mother cell was obtained by counting the number of daughter cells it produced (see sample videos from the supplementary files). We observe typically more than 60 cells in order to get a lifespan distribution, and the cumulative distribution (percent of cells with lifespan longer than a given number of generations) gives the standard survival curve. Our automated lifespan measurement reproduced the results from the previously identified long-lived mutants. One example is the FOB1 deletion mutant (Figure 2b). Consistent with the previous plate based assays, we observed a significant increase of the lifespan compared to the wide type strain (Defossez et al. 1999). As a control, we grew a wild type strain with a GFP tag under identical conditions and loaded the control and mutant cells together into the same chamber, such that the growth condition and the environment is identical. GFP tagging of the wild type strain did not alter the lifespan, since the tagged strain has identical survival curve as the non-tagged strain (Figure 2a). Although the lifespan of the wild type strain is shorter than that from the plate assay, the strict control we employed allowed us to observe the relative effect on lifespan caused by specific mutations. Our setup allows a medium throughput screening for mutants with lifespan phenotype; one of the current designs has eight channels controlled by independent pumps, allowing lifespan measurements for eight different strains in parallel.
Figure 2.
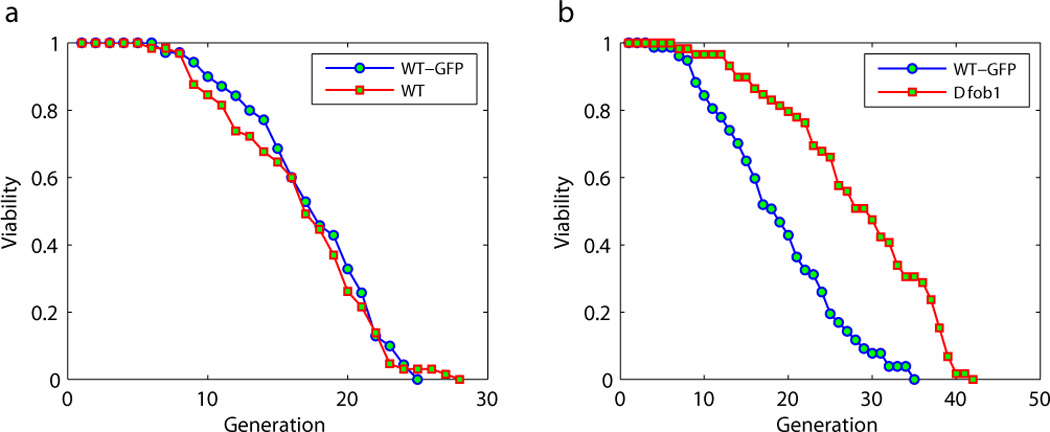
Survival curves of the wild type strain (a) and the FOB1 deletion mutant (b) measured by using the microfluidic device. Shown is the percent of cells still dividing after a given number of generations. A wild type strain with a GFP tag is loaded to the some channel as a control (blue curves). The number of cells measured to generate the survival curves: (a) WT-GFP 70, WT 65; (b) WT-GFP 77, Δfob1 59.
Monitoring lifespan and gene expression in single cells identified a lifespan marker
The ability to track individual mother cells in the microfluidic chambers allowed us to monitor cell growth/division and various molecular markers simultaneously. To investigate the nature of the damage that may cause mother cells to age, we analyzed a number of stress response reporters, including a reporter for the promoter activity of the molecular chaperone Hsp104 -- a GFP driven by the HSP104 promoter (Figure 3a). Previous study found that after a brief heat shock, the level of a GFP reporter driven by the HSP-16.2 promoter positively correlates with the lifespan of individual worms (Rea et al. 2005). We found that in the context of aging without externally imposed stress, the activity of HSP104 promoter negatively correlates with the lifespan of individual yeast cells (r=−0.67 and p-value=2e-10, Figure 3b): cells with lower level of HSP104 promoter activity have longer replicative lifespan. Hsp104 is a heat shock protein that cooperates with Hsp40 and Hsp70 to refold and reactivate previously denatured aggregated proteins and its expression can be induced by heat shock or artificial unfolded proteins (Glover & Lindquist 1998; Kaganovich et al. 2008). The observation of a negative correlation between Hsp104 expression and the lifespan of individual cells prompted us to ask whether unfolded/aggregated protein stress is the upstream signal. We thus wish to analyze the activity of the upstream regulators that control HSP104 promoter.
Figure 3.
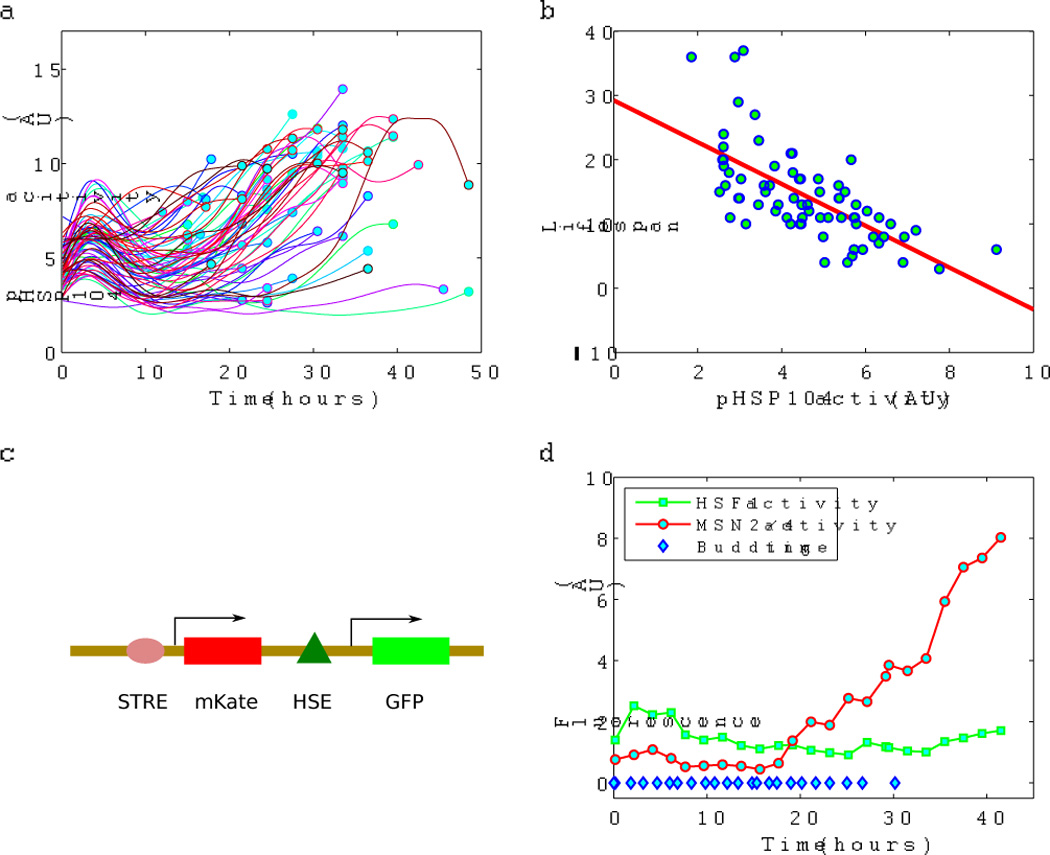
Monitoring the lifespan and fluorescence reporters simultaneously identified a lifespan marker. a) The activity of HSP104 promoter (reported by a GFP driven by the HSP104 promoter) as a function of time in individual cells. Fluorescence was measured once every two hours. Curves are spline fits to guide the eyes. Each curve corresponds to an individual cell. Circles indicate the last budding event. b) Lifespan of individual cells negatively correlates with HSP104 promoter activity (measured at 8 hours after the cell loading). Number of cells = 71. c) A schematic of the dual reporter construct, with the binding site of Msn2/4 (STRE) upstream of mKate and the binding site of Hsf1 (HSE) upstream of GFP, both in the context of a crippled CYC1 promoter. d) A typical example of the age dependence of Msn2/4 and Hsf1 activities in a single cell, as reported by the dual reporter. Budding time (blue diamond) was tracked simultaneously.
It is known that the HSP104 promoter is controlled by the general stress response transcription factors Msn2/4, and Hsf1, a heat shock transcription factor (Grably et al. 2002). While Msn2/4 activity is induced by general stress (Boy-Marcotte et al. 1998; Garreau et al. 2000; De Wever et al. 2005; Gasch et al. 2000), Hsf1 activity is specifically induced by unfolded proteins (Hahn et al. 2004; Eastmond & Nelson 2006). Bioinformatic analysis of HSP104 promoter sequence revealed that it contains a binding site for Hsf1 (Heat shock element or HSE) and several binding sites for Msn2/4 (stress response element or STRE) (Boy-Marcotte et al. 1999). To delineate the effect due to the regulation by Msn2/4 and Hsf1, we constructed a dual reporter, with a GFP fused to a crippled CYC1 promoter (which is transcriptionally silent in the absence of an upstream activating sequence) with HSE upstream and a mKate fused to a similar promoter with STRE upstream (Figure 3c). Tracking the dual reporter as a function of age in individual mother cells revealed that the Msn2/4 reporter expression increases with age in a subpopulation of cells, while the expression of the Hsf1 reporter remains the same throughout the lifespan (Figure 3d, and Supplementary Figure 2 for more examples). We checked that the Hsf1 reporter is inducible in old mother cells by heat shock. Thus we did not find evidence that yeast aging is accompanied by an elevated unfolded/aggregated protein stress.
Evaluating specific stresses as candidate for the cause of aging
In search of other specific stresses that may cause the up-regulation of Msn2/4 activity during aging, we tracked several fluorescence markers that report the level of oxidative stress, osmotic stress, and ER stress (stress due to unfolded proteins in the endoplasmic reticulum) respectively. Oxidative stress is a leading candidate, as oxidative damage has long been proposed to be a major cause of aging (Harman 1956; Shigenaga et al. 1994; Finkel & Holbrook 2000; Balaban et al. 2005), and a prime cause of oxidative damage is believed to be the reactive oxygen species (ROS) produced by the mitochondria. Consistent with this theory, we found that ROS level, as measured by DCFH-DA staining, increases significantly in old cells relative to young cells (Figure 4a). DCFH-DA can be oxidized to become fluorescent by a number of oxidants (Bilski et al. 2002; Bonini et al. 2006). Interestingly, several reporters for oxidative stress do not show age dependence. For example, a reporter for Yap1 activity (a CYC1 promoter containing Yap1 binding sites), remains the same for the entire lifespan of the mother cells (Figure 4b). Yap1 is a transcription factor that regulates the transcription of its target genes in response to oxidative stress (Toone & Jones 1999; Temple et al. 2005) and is sensitive to hydrogen peroxide (Delaunay et al. 2000) (Supplementary Figure 3). The expression of GSH1, which is a transcriptional target of Yap1, also showed no increase with age (Figure 4c). In addition, the level of a fluorescent marker that reports the redox potential of the cell (roGFP with two different excitation wavelengths for the two different confirmations that correspond to the oxidized and the reduced forms (Hanson et al. 2004; Merksamer et al. 2008)) also remains the same throughout the lifespan (Figure 4d). ro-GFP may sense oxidant by a mechanism similar to Yap1, i.e., via the oxidation of cysteine residues to form intra-molecular disulfide bond (Hanson et al. 2004). Together our data indicate that ROS level increases in old cells, however hydrogen peroxide or related species (such as superoxide or single oxygen) may not be directly responsible for such increase.
Figure 4.
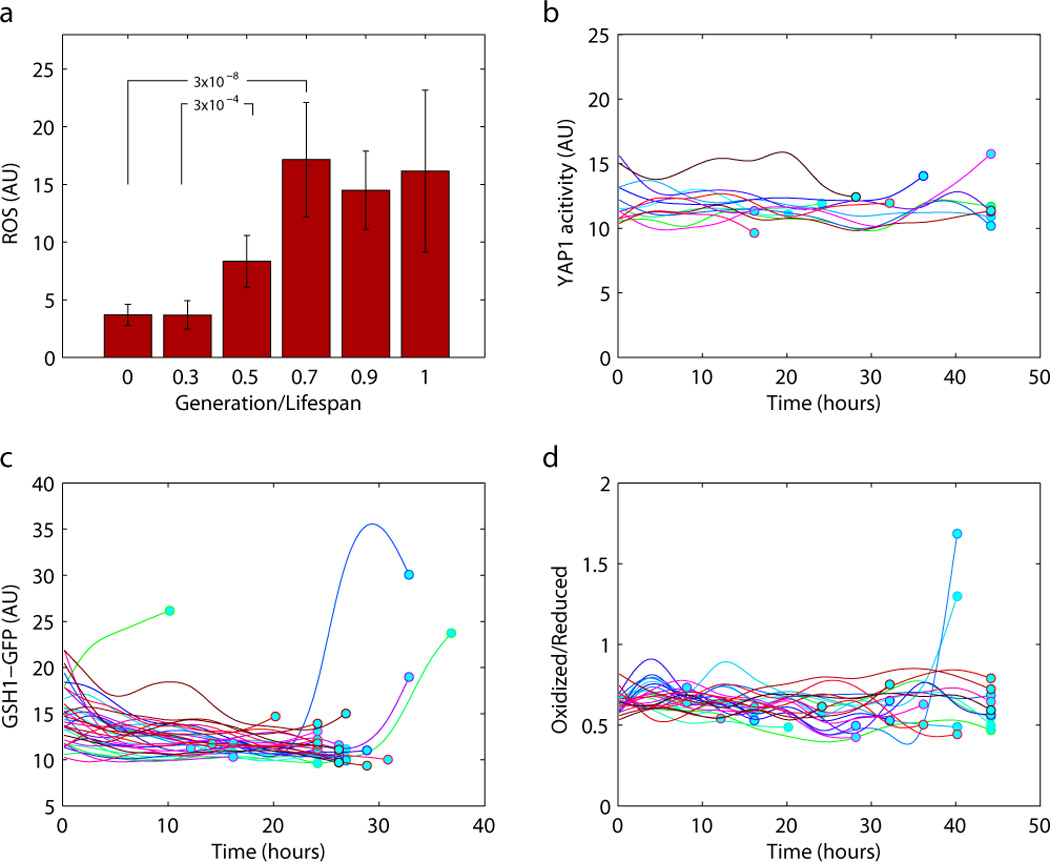
Oxidative stress as a function of age in individual cells. a) DCFH-DA staining showed increased ROS level in the aged cell populations. Staining was performed at 0, 11, 22, and 33 hours after cell loading in separate channels. Cells were grouped by their relative lifespan (generation normalized by the total lifespan) at the time of staining. b) Yap1 activity as a function of age remains the same throughout the lifespan. Yap1 activity is reported by a YFP driven by a crippled CYC1 promoter containing a Yap1 binding site. c) The protein level of Gsh1 (a transcriptional target of Yap1) as reported by a 3’ GFP fusion does not increase with age. d) Redox potential reported by the roGFP. The ratio of the oxidized to the reduced forms of the roGFP (arbitrary unit) was calculated from the fluorescence signals from the two different forms, as excited by two different wavelengths.
We have analyzed reporters for osmotic stress and ER stress and found no evidence that they increase with age. ER stress was reported by a CYC1 promoter with the binding site of Hac1, which is a transcription factor that turns on several hundred target genes in response to accumulated unfolded proteins in ER (Mori et al. 1996; Cox & Walter 1996). We found that for the majority of the cells, the expression of the ER stress reporter decreases slightly as they age (Supplementary Figure 5). Osmotic stress was reported by a Hog1-GFP construct and by observing the change of the protein localization. It is known that under normal condition Hog1 localizes to the cytosol while under osmotic stress, it re-localizes to nucleus (Mattison & Ota 2000). We have observed no change of localization throughout the lifespan of mother cells.
Cellular/molecular phenotyping of aging in wild type and long-lived mutant cells
In addition to lifespan and molecular markers, the continuous imaging of mother cells also provides detailed information about cell growth and cell division dynamics, which can lead to mechanistic insight. We recorded the time at which each bud appeared and plotted the time interval between two successive budding events as a function of the generation (Figure 5a & b). Comparing this budding profile between the wild type strain and the long-lived FOB1 deletion mutant revealed a striking difference. While the average budding time interval is comparable between the two strains, their budding profiles showed very distinct age dependence. For the wild type, for the majority of the cells, the budding time interval is more or less uniform through most of the lifespan, and becomes progressively longer for the last few cell divisions (Figure 5a). The interval between the last and the second to the last budding is usually the longest, indicating that accumulated “damage” causes cell cycle delay and eventually arrest. For the FOB1 deletion mutant, we found clear subpopulations (Figure 5b and Supplementary Figure 4). In the first subpopulation, cells have a constant budding time interval until they reach a sudden death (a sudden shrinkage of the cell volume) with no pre-symptoms based on cell morphology or cell division dynamics. In the second subpopulation, cells have intermittent long budding time intervals in the middle of their life followed by faster (but still slower than the wild type) budding. Only a small number of cells show progressively lengthening cell cycle as observed in most of the wild type cells. Fob1 is a nucleolar protein that binds the rDNA replication fork barrier site and is required for replication fork blocking. Previous studies indicate that FOB1 deletion extends lifespan by reducing extra-chromosomal ribosomal DNA circles (ERCs) (Defossez et al. 1999). Our observations suggest that while FOB1 deletion helps alleviate the problem associated with ERC, it might also cause problems with DNA replication and recombination. While the subpopulation with progressive lengthened cell cycle is greatly reduced, the subpopulation with sudden death and another subpopulation with delayed cell cycle in the middle life increase. In the latter case, perhaps certain DNA repair mechanisms are engaged in response to DNA damage signal to recover cell growth/division.
Figure 5.
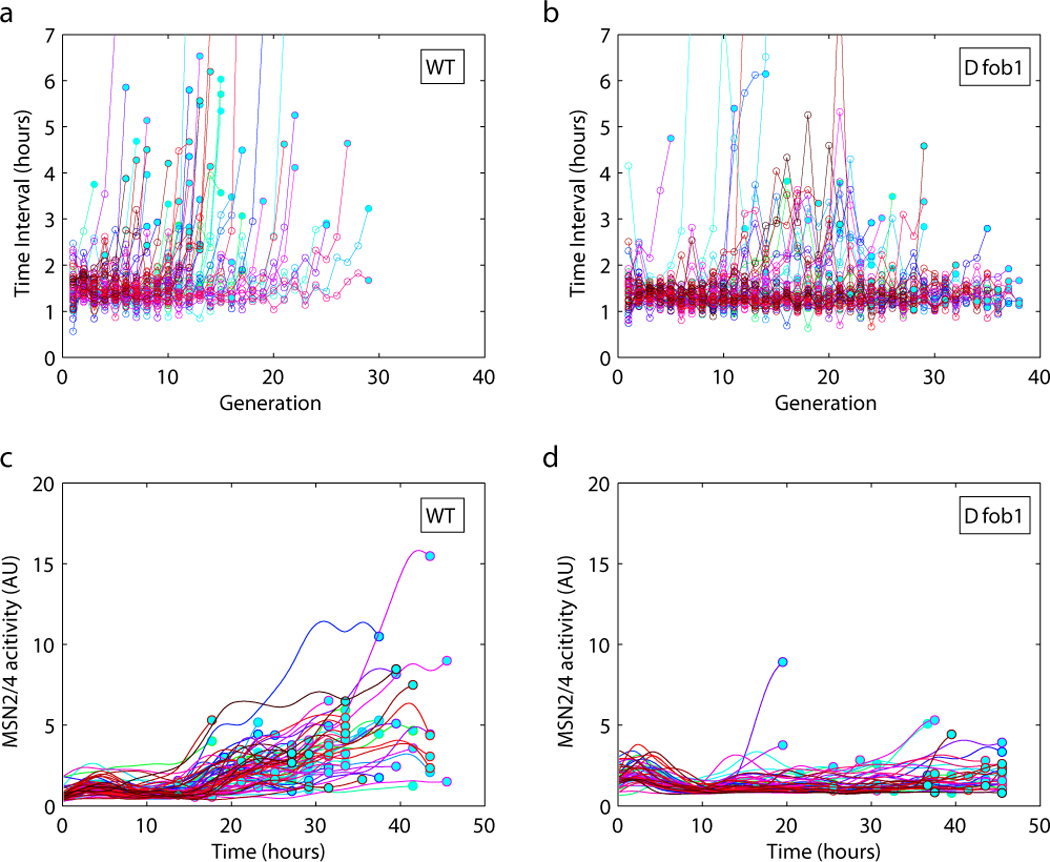
Budding time interval (a & b) and stress response (c & d) profiles of the wild type and the FOB1 deletion mutant. Budding time interval, defined as the time between two successive budding events, is plotted against the replicative age of the cell. Each curve corresponds to a single cell. Data points are connected by straight lines (a & b) and spline fitted (c & d) to guide the eyes. The filled circles indicate the last budding event. Stress response is measured by the activity of Msn2/4, reported by a GFP driven by a crippled CYC1 promoter containing a STRE. Number of cells: a 59, b 59, c 93, d 59.
To further characterize aging in the wild type and in the FOB1 deletion mutant cells, we compared the activity profiles of the STRE reporter (reflecting the activity of the general stress response regulator Msn2/4) in the two strains. We found that this molecular marker also displayed a striking difference between the wild type and FOB1 deletion mutant. While the reporter activity increases with age in a significant fraction of wild type cells, it remains low and flat through out the lifespan of most mutant cells, suggesting that the upstream stress signal that cause Msn2/4 to respond in the wild type has been alleviated (Figure 5c,d). This difference in the stress response behavior is consistent with the observation that FOB1 deletion greatly reduces the subpopulation with a progressive slowdown of their budding time intervals, suggesting that the increase in general stress and lengthening of cell cycle in the wild type cell might be caused by the same upstream signal, which is reduced by the FOB1 deletion.
Different forms of cell death
To investigate the possible causes of cell death, we analyzed terminal cell morphologies after the aging cells stopped dividing. We found several different forms of cell death, characterized by different terminal morphologies and different stress reporter levels; two forms predominate, referred to here as type I and type II death. In type I death, the dead cells assume a rounded shape (Figure 6a, red arrows), and the daughter cells produced by the last few cell divisions can no longer divide. In type II death, the dead cell assumes an elongated shape, and the last daughter cannot separate from the mother cell (Figure 6a, green arrows). Cells terminated by type I death have on average a shorter lifespan, and a higher level of HSP104 promoter activity compared to those terminated by type II death (Figure 6b,d).
Figure 6.
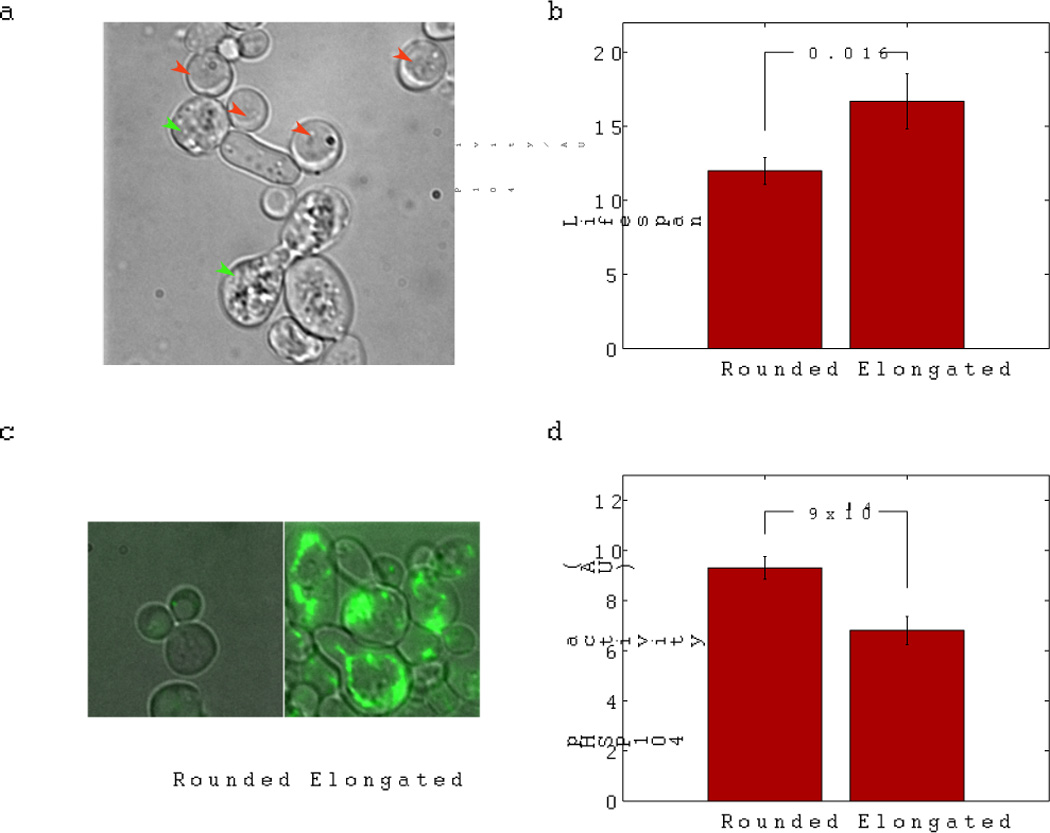
Characterization of the different forms of cell death. a) Different forms of cell death as defined by different terminal cell morphologies. Two predominant forms are type I (rounded shape, red arrows) and type II (elongated shape, green arrows). Type I-rounded cells have shorter lifespan (b), more severely damaged mitochondria (as reported by the Leu4-GFP marker) (c), and higher stress levels (reported by the HSP104 promoter activity) (d), relative to type II-elongated cells.
More detailed analysis of various organelles (by following molecular markers and using chemical staining) revealed different degrees of damage in the two types of cells. In particular, we found that the type I death is characterized by a more severe mitochondrial dysfunction compared to type II death, as indicated by a complete loss of the mitochondrial marker Leu4-GFP (Leu4 is an enzyme in the leucine biosynthetic pathway and is located in mitochondria). In contrast, Leu4 marker is more or less normal in cells terminated by the type II death (Figure 6c). Measuring mitochondrial proton gradient by DiOC6 staining showed similar difference between the two types. It is possible that the elevated stress response in type I death is related to the more severe mitochondrial damage, but further experiments are needed to establish the link.
Discussion
The microfluidic system we developed for analyzing yeast aging has a number of advantages. The ability to track individual mother cells for a large number of generations by time-lapsed microscopy made it possible to automate the lifespan measurement, which is much more efficient than the traditional approach based on micromanipulation. Our current designs have multiple channels on the same chip that can be controlled independently, allowing the study of multiple strains in parallel. More importantly, the ability to simultaneously track cell division dynamics, morphological changes, and various molecular markers opens up new windows through which we can examine the mechanistic details of the aging process. Using this approach, we identified a molecular marker that is predictive of the lifespan of individual cells, found striking differences in cell division dynamics and stress response behavior between the wild type cells and the long lived FOB1 mutant, and revealed different forms of death in the aging population that can be characterized by different terminal cell morphologies and stress levels. These observations serve as a starting point for further investigation of the mechanisms of aging and death.
The microfluidic device we developed for this study used both geometric confinement (perpendicular to the flow direction) and mother cell surface modification to differentially retain mother cells. However, it is possible to generalize the chip design to achieve differential mother cell retention only by geometric confinement, eliminating the requirement for surface modification. We have recently developed a prototype design in which an array of islands in a microfluidic channel can trap mother cells in the gap between the top of the island and the surface of the channel. Such design solved the problem of jamming as the size of the micro-colonies is limited by the size of the islands – cells growing out of the islands are flushed away.
Our examination of the correlation between Hsp104 expression and lifespan in individual cells was motivated by an early observation that linked Hsp-16.2 expression with the lifespan of individual worms (Rea et al. 2005). Rea et al. reported that after a transient heat shock, the induction level of Hsp-16.2 positively correlates with the lifespan of individual worms, i.e., worms with a higher level of induction live longer. We found that in yeast, in the context of natural aging with no externally imposed stress, HSP104 promoter activity negatively correlates with the lifespan, i.e., cells with lower expression level of Hsp104 live longer. These observations in two different organisms may not necessarily conflict each other, as in the former case in worm, a higher level of Hsp-16.2 after heat shock may indicate a better ability to respond to stress, and perhaps leads to better protective effect, while in the latter case in yeast, a higher level of Hsp104 may indicate that the cell is more stressed. A recent study in flies yielded results similar to our observation (Yang & Tower 2009). The finding of a molecular marker that is predictive of lifespan can have important applications, for example, for screening mutants and drugs that can extend lifespan, if the marker is predictive of lifespan across different strains and different environmental conditions. This is currently under investigation.
Our study suggests that aging in yeast cells is accompanied by an increased general stress, as reflected by the expression level of the Msn2/4 reporter. One possible candidate for the upstream signal is the extra-chromosomal ribosomal DNA circle (ERC), which has been implicated in yeast aging (Sinclair & Guarente 1997). We observed that in the wild type cells, cell cycle for the last few cell divisions progressively lengthens, accompanied by increased general stress. However FOB1 deletion, which is known to reduce ERC formation (Defossez et al. 1999), seems to alleviate these problems. Thus the accumulation of ERC may cause the drastic increase of stress and lengthened cell cycle for the last few cell divisions. Could the elevated Msn2/4 response be caused solely by slowed growth in old cells? Our single cell data seem to argue against this possibility as we often observed significant increase of Msn2/4 reporter level long before appreciable slow down of cell cycle (Figure 3d, Supplementary Figure 2).
Oxidative damage by ROS has long been proposed to be a major cause of aging and there are ample data demonstrating the correlation between oxidative damage and aging in different species (Finkel & Holbrook 2000; Shigenaga et al. 1994; Sohal et al. 1994; Balaban et al. 2005). In the context of yeast replicative aging in rich media, we observed a significant increase of ROS level in aged cells as measured by the DCFH-DA staining. Our data from several live reporters for oxidative stress suggest that hydrogen peroxide and related species (such as superoxide and single oxygen) may not be the responsible oxidants.
As a striking demonstration of the heterogeneity of the aging phenomena, we found different forms of cell death in the aging population. Cells that died of different forms assume different terminal morphologies, and have different stress levels and lifespan, which is consistent with the observation of subpopulations with lifespan limited by different factors. These different forms of cell death may be caused by stochastic failure of different organelles/cellular processes. The exact mechanism is still unknown, but our preliminary studies indicate that type I death may relate to severe mitochondrial problems while type II death may be due to DNA damage. This is consistent with previous finding that mutation in the DNA repair pathway can alter the relative proportion of cells with different terminal morphology (McVey et al. 2001). By combining the power of microfluidic devices with various molecular markers and staining techniques, one can perform molecular “autopsy” of the single cells with high resolution, and thus probe deeply into the molecular mechanisms of cell aging and death.
Supplementary Material
Acknowledgement
We thank Peter Walter, Hiten Madhani, and Amir Mitchell for helpful comments on our manuscript, P. Fordyce for discussion on the biotin protocol, V. Chubukov, J.S. Zheng, J. Stewart-Ornstein, I. Zuleta and Zairan Liu for sharing strains. This work was supported by an NIH R01 (GM070808) and a Packard Fellowship in Science and Engineering to HL, the NIH Center for Systems and Synthetic Biology (P50 GM081879), NSFC of China (10721463), and by the MOST of China (2009CB918500).
Footnotes
The authors declare no conflict of interest.
References
- Balaban RS, Nemoto S, Finkel T. Mitochondria, oxidants, and aging. Cell. 2005;120:483–495. doi: 10.1016/j.cell.2005.02.001. [DOI] [PubMed] [Google Scholar]
- Bilski P, Belanger AG, Chignell CF. Photosensitized oxidation of 2’,7’-dichlorofluorescin: singlet oxygen does not contribute to the formation of fluorescent oxidation product 2’,7’-dichlorofluorescein. Free Radic. Biol. Med. 2002;33:938–946. doi: 10.1016/s0891-5849(02)00982-6. [DOI] [PubMed] [Google Scholar]
- Bishop NA, Guarente L. Genetic links between diet and lifespan: shared mechanisms from yeast to humans. Nat. Rev. Genet. 2007;8:835–844. doi: 10.1038/nrg2188. [DOI] [PubMed] [Google Scholar]
- Bonini MG, Rota C, Tomasi A, Mason RP. The oxidation of 2’,7’-dichlorofluorescin to reactive oxygen species: a self-fulfilling prophesy? Free Radic. Biol. Med. 2006;40:968–975. doi: 10.1016/j.freeradbiomed.2005.10.042. [DOI] [PubMed] [Google Scholar]
- Boy-Marcotte E, Lagniel G, Perrot M, Bussereau F, Boudsocq A, Jacquet M, Labarre J. The heat shock response in yeast: differential regulations and contributions of the Msn2p/Msn4p and Hsf1p regulons. Mol. Microbiol. 1999;33:274–283. doi: 10.1046/j.1365-2958.1999.01467.x. [DOI] [PubMed] [Google Scholar]
- Boy-Marcotte E, Perrot M, Bussereau F, Boucherie H, Jacquet M. Msn2p and Msn4p control a large number of genes induced at the diauxic transition which are repressed by cyclic AMP in Saccharomyces cerevisiae. J. Bacteriol. 1998;180:1044–1052. doi: 10.1128/jb.180.5.1044-1052.1998. [DOI] [PMC free article] [PubMed] [Google Scholar]
- Cox JS, Walter P. A novel mechanism for regulating activity of a transcription factor that controls the unfolded protein response. Cell. 1996;87:391–404. doi: 10.1016/s0092-8674(00)81360-4. [DOI] [PubMed] [Google Scholar]
- Defossez P-A, Prusty R, Kaeberlein M, Lin S-J, Ferrigno P, Silver PA, Keil RL, Guarente L. Elimination of Replication Block Protein Fob1 Extends the Life Span of Yeast Mother Cells. Mol. Cell. 1999;3:447–455. doi: 10.1016/s1097-2765(00)80472-4. [DOI] [PubMed] [Google Scholar]
- Delaunay A, Isnard AD, Toledano MB. H2O2 sensing through oxidation of the Yap1 transcription factor. EMBO J. 2000;19:5157–5166. doi: 10.1093/emboj/19.19.5157. [DOI] [PMC free article] [PubMed] [Google Scholar]
- Eastmond DL, Nelson HCM. Genome-wide analysis reveals new roles for the activation domains of the Saccharomyces cerevisiae heat shock transcription factor (Hsf1) during the transient heat shock response. J. Biol. Chem. 2006;281:32909–32921. doi: 10.1074/jbc.M602454200. [DOI] [PMC free article] [PubMed] [Google Scholar]
- Finkel T, Holbrook NJ. Oxidants, oxidative stress and the biology of ageing. Nature. 2000;408:239–247. doi: 10.1038/35041687. [DOI] [PubMed] [Google Scholar]
- Garreau H, Hasan RN, Renault G, Estruch F, Boy-Marcotte E, Jacquet M. Hyperphosphorylation of Msn2p and Msn4p in response to heat shock and the diauxic shift is inhibited by cAMP in Saccharomyces cerevisiae. Microbiology (Reading, Engl.) 2000;146(Pt 9):2113–2120. doi: 10.1099/00221287-146-9-2113. [DOI] [PubMed] [Google Scholar]
- Gasch AP, Spellman PT, Kao CM, Carmel-Harel O, Eisen MB, Storz G, Botstein D, Brown PO. Genomic expression programs in the response of yeast cells to environmental changes. Mol. Biol. Cell. 2000;11:4241–4257. doi: 10.1091/mbc.11.12.4241. [DOI] [PMC free article] [PubMed] [Google Scholar]
- Glover JR, Lindquist S. Hsp104, Hsp70, and Hsp40: a novel chaperone system that rescues previously aggregated proteins. Cell. 1998;94:73–82. doi: 10.1016/s0092-8674(00)81223-4. [DOI] [PubMed] [Google Scholar]
- Grably MR, Stanhill A, Tell O, Engelberg D. HSF and Msn2/4p can exclusively or cooperatively activate the yeast HSP104 gene. Mol. Microbiol. 2002;44:21–35. doi: 10.1046/j.1365-2958.2002.02860.x. [DOI] [PubMed] [Google Scholar]
- Hahn J-S, Hu Z, Thiele DJ, Iyer VR. Genome-wide analysis of the biology of stress responses through heat shock transcription factor. Mol. Cell. Biol. 2004;24:5249–5256. doi: 10.1128/MCB.24.12.5249-5256.2004. [DOI] [PMC free article] [PubMed] [Google Scholar]
- Hanson GT, Aggeler R, Oglesbee D, Cannon M, Capaldi RA, Tsien RY, Remington SJ. Investigating mitochondrial redox potential with redox-sensitive green fluorescent protein indicators. J. Biol. Chem. 2004;279:13044–13053. doi: 10.1074/jbc.M312846200. [DOI] [PubMed] [Google Scholar]
- Harman D. Aging: a theory based on free radical and radiation chemistry. J. Gerontol. A Biol. Sci. Med. Sci. 1956;11:298–300. doi: 10.1093/geronj/11.3.298. [DOI] [PubMed] [Google Scholar]
- Johnson FB, Sinclair DA, Guarente L. Molecular Biology of Aging. Cell. 1999;96:291–302. doi: 10.1016/s0092-8674(00)80567-x. [DOI] [PubMed] [Google Scholar]
- Kaeberlein M. Lessons on longevity from budding yeast. Nature. 2010a;464:513–519. doi: 10.1038/nature08981. [DOI] [PMC free article] [PubMed] [Google Scholar]
- Kaeberlein M. Resveratrol and rapamycin: are they anti-aging drugs? Bioessays. 2010b;32:96–99. doi: 10.1002/bies.200900171. [DOI] [PubMed] [Google Scholar]
- Kaganovich D, Kopito R, Frydman J. Misfolded proteins partition between two distinct quality control compartments. Nature. 2008;454:1088–1095. doi: 10.1038/nature07195. [DOI] [PMC free article] [PubMed] [Google Scholar]
- Koschwanez J, Holl M, Carlson R, McMurray M, Gottschling D, Meldrum D. Automated lifetime analysis of a single yeast cell. Automation Science and Engineering, 2005. IEEE International Conference on; Automation Science and Engineering, 2005. IEEE International Conference on; 2005. [Accessed October 12, 2010]. pp. 13–18. Available at: 10.1109/COASE.2005.1506738. [Google Scholar]
- Mattison CP, Ota IM. Two protein tyrosine phosphatases, Ptp2 and Ptp3, modulate the subcellular localization of the Hog1 MAP kinase in yeast. Genes Dev. 2000;14:1229–1235. [PMC free article] [PubMed] [Google Scholar]
- McVey M, Kaeberlein M, Tissenbaum HA, Guarente L. The short life span of Saccharomyces cerevisiae sgs1 and srs2 mutants is a composite of normal aging processes and mitotic arrest due to defective recombination. Genetics. 2001;157:1531–1542. doi: 10.1093/genetics/157.4.1531. [DOI] [PMC free article] [PubMed] [Google Scholar]
- Medvedik O, Lamming DW, Kim KD, Sinclair DA. MSN2 and MSN4 link calorie restriction and TOR to sirtuin-mediated lifespan extension in Saccharomyces cerevisiae. PLoS Biol. 2007;5:e261. doi: 10.1371/journal.pbio.0050261. [DOI] [PMC free article] [PubMed] [Google Scholar]
- Merksamer PI, Trusina A, Papa FR. Real-time redox measurements during endoplasmic reticulum stress reveal interlinked protein folding functions. Cell. 2008;135:933–947. doi: 10.1016/j.cell.2008.10.011. [DOI] [PMC free article] [PubMed] [Google Scholar]
- Mori K, Kawahara T, Yoshida H, Yanagi H, Yura T. Signalling from endoplasmic reticulum to nucleus: transcription factor with a basic-leucine zipper motif is required for the unfolded protein-response pathway. Genes Cells. 1996;1:803–817. doi: 10.1046/j.1365-2443.1996.d01-274.x. [DOI] [PubMed] [Google Scholar]
- Mortimer RK, Johnston JR. Life span of individual yeast cells. Nature. 1959;183:1751–1752. doi: 10.1038/1831751a0. [DOI] [PubMed] [Google Scholar]
- Powers RW, Kaeberlein M, Caldwell SD, Kennedy BK, Fields S. Extension of chronological life span in yeast by decreased TOR pathway signaling. Genes Dev. 2006;20:174–184. doi: 10.1101/gad.1381406. [DOI] [PMC free article] [PubMed] [Google Scholar]
- Rea SL, Wu D, Cypser JR, Vaupel JW, Johnson TE. A stress-sensitive reporter predicts longevity in isogenic populations of Caenorhabditis elegans. Nat. Genet. 2005;37:894–898. doi: 10.1038/ng1608. [DOI] [PMC free article] [PubMed] [Google Scholar]
- Ryley J, Pereira-Smith OM. Microfluidics device for single cell gene expression analysis in Saccharomyces cerevisiae. Yeast. 2006;23:1065–1073. doi: 10.1002/yea.1412. [DOI] [PubMed] [Google Scholar]
- Shigenaga MK, Hagen TM, Ames BN. Oxidative damage and mitochondrial decay in aging. Proc. Natl. Acad. SciU.SA. 1994;91:10771–10778. doi: 10.1073/pnas.91.23.10771. [DOI] [PMC free article] [PubMed] [Google Scholar]
- Sinclair DA, Guarente L. Extrachromosomal rDNA circles--a cause of aging in yeast. Cell. 1997;91:1033–1042. doi: 10.1016/s0092-8674(00)80493-6. [DOI] [PubMed] [Google Scholar]
- Sohal RS, Ku HH, Agarwal S, Forster MJ, Lal H. Oxidative damage, mitochondrial oxidant generation and antioxidant defenses during aging and in response to food restriction in the mouse. Mech. Ageing Dev. 1994;74:121–133. doi: 10.1016/0047-6374(94)90104-x. [DOI] [PubMed] [Google Scholar]
- Temple MD, Perrone GG, Dawes IW. Complex cellular responses to reactive oxygen species. Trends Cell Biol. 2005;15:319–326. doi: 10.1016/j.tcb.2005.04.003. [DOI] [PubMed] [Google Scholar]
- Toone WM, Jones N. AP-1 transcription factors in yeast. Curr. Opin. Genet. Dev. 1999;9:55–61. doi: 10.1016/s0959-437x(99)80008-2. [DOI] [PubMed] [Google Scholar]
- De Wever V, Reiter W, Ballarini A, Ammerer G, Brocard C. A dual role for PP1 in shaping the Msn2-dependent transcriptional response to glucose starvation. EMBO J. 2005;24:4115–4123. doi: 10.1038/sj.emboj.7600871. [DOI] [PMC free article] [PubMed] [Google Scholar]
- Yang J, Tower J. Expression of hsp22 and hsp70 transgenes is partially predictive of drosophila survival under normal and stress conditions. J. Gerontol. A Biol. Sci. Med. Sci. 2009;64:828–838. doi: 10.1093/gerona/glp054. [DOI] [PMC free article] [PubMed] [Google Scholar]
Associated Data
This section collects any data citations, data availability statements, or supplementary materials included in this article.