

Abstract
Introduction
The traditional description of the Triangle of Dysplasia in Arrhythmogenic Right Ventricular Dysplasia/Cardiomyopathy (ARVD/C) predates genetic testing and excludes biventricular phenotypes.
Methods and Results
We analyzed Cardiac Magnetic Resonance (CMR) studies of 74 mutation-positive ARVD/C patients for regional abnormalities on a 5-segment RV and 17-segment LV model. The location of electroanatomic endo- and epicardial scar and site of successful VT ablation was recorded in 11 ARVD/C subjects. Among 54/74 (73%) subjects with abnormal CMR, the RV was abnormal in almost all (96%), and 52% had biventricular involvement. Isolated LV abnormalities were uncommon (4%). Dyskinetic basal inferior wall (94%) was the most prevalent RV abnormality, followed by basal anterior wall (87%) dyskinesis. Subepicardial fat infiltration in the posterolateral LV (80%) was the most frequent LV abnormality. Similar to CMR data, voltage maps revealed scar (<0.5 mV) in the RV basal inferior wall (100%), followed by the RV basal anterior wall (64%) and LV posterolateral wall (45%). All 16 RV VTs originated from the basal inferior wall (50%) or basal anterior wall (50%). Of 3 LV VTs, 2 localized to the posterolateral wall. In both modalities, RV apical involvement never occurred in isolation.
Conclusion
Mutation-positive ARVD/C exhibits a previously unrecognized characteristic pattern of disease involving the basal inferior and anterior RV, and the posterolateral LV. The RV apex is only involved in advanced ARVD/C, typically as a part of global RV involvement. These results displace the RV apex from the Triangle of Dysplasia, and provide insights into the pathophysiology of ARVD/C.
Keywords: Arrhythmogenic Right Ventricular Dysplasia/Cardiomyopathy, magnetic resonance imaging, electroanatomic mapping, ventricular tachcardia, phenotype, genetics, implantable cardioverter defibrillator
Introduction
The “Triangle of Dysplasia” in Arrhythmogenic Right Ventricular Dysplasia/Cardiomyopathy (ARVD/C) refers to a unique pattern of right ventricular (RV) structural abnormalities affecting the RV inflow tract, outflow tract and apex. This concept was first described in 1982, when Marcus and colleagues reported on 24 patients with arrhythmias of RV origin and right heart failure1. This traditional disease phenotype was based on RV angiographic findings and autopsy data, and predates genetic testing for ARVD/C.
Over the last decade, we and several other investigators have reported on cardiac structural and functional changes and the clinical course of patients with ARVD/C2-5,6, 7. Cardiac magnetic resonance imaging (CMR) has gained popularity as the modality of choice for cardiac imaging, allowing for noninvasive morphological and functional evaluation, as well as tissue characterization. As a result, we now know that structural abnormalities in ARVD/C often are not confined to the RV, and that the disease exhibits significant clinical heterogeneity based on genotype7-9. Therefore, better characterization of ARVD/C is critical to accurate diagnosis, management strategies and understanding the disease mechanism in ARVD/C.
The objective of this study was to reexamine the pattern of regional cardiac involvement in ARVD/C. To accomplish this, we systematically evaluated cardiac structural disease in a large cohort of ARVD/C-associated pathogenic mutation carriers who met criteria for ARVD/C diagnosis from the Johns Hopkins and Dutch ARVD/C registries. In addition, we studied the location and distribution of electroanatomic scar, and the sites of origin of ventricular tachycardia (VT) in mutation-positive ARVD/C patients with ventricular arrhythmias.
Methods
Study population
The study population was identified from the Johns Hopkins ARVD/C Registry (ARVD.com) and the Interuniversity Cardiology Institute of the Netherlands ARVD/C Registry (referred to as the “Dutch registry”). Both registries prospectively enroll ARVD/C patients and their family members with a possible history of the disease. For the present study, registry enrollees were included who 1) harbored a pathogenic ARVD/C-associated desmosomal mutation (see Supplementary Table 1); 2) fulfilled revised ARVD/C Task Force Criteria (TFC) at last follow-up10; and 3) underwent either CMR imaging according to standard protocol11, 12 (74 patients), and/or a complete electrophysiological study including endo- and epicardial electroanatomical mapping and ablation (11 patients) available for analysis. Five patients underwent both CMR and electrophysiological study.
Cardiac magnetic resonance
Cardiac structural changes were evaluated on CMR studies obtained from 74 ARVD/C subjects: 56 subjects from the Johns Hopkins ARVD/C registry, and 18 individuals included in the Dutch ARVD/C registry. Patients from the Johns Hopkins ARVD/C registry were significantly more often male than patients from the Dutch registry; all other patient characteristics were comparable between the two cohorts (see Supplementary Table 2). Comprehensive CMR was performed according to a standard protocol as previously described11, 12. CMR was reviewed using consensus agreement of three experienced CMR physicians blinded to clinical history. The presence of wall motion abnormalities and abnormal myocardial signal intensity on fat sensitive and delayed enhancement sequences were scored on a 5-segment model of the RV and 17-segment model of the left ventricle (LV) for every segment separately13 (Supplementary Figure 1). Segments were classified as affected in case any abnormality was found. Subjects were categorized into limited, moderate, and advanced ARVD/C based on the number of abnormal RV segments, and the pattern of regional RV involvement was evaluated.
Electrophysiological study
The distribution of endo- and epicardial electroanatomic scar and arrhythmic substrate was assessed in a cohort of 11 patients with documented sustained ventricular arrhythmia who were referred for electrophysiological study and catheter ablation at the Johns Hopkins ARVD/C center. Five patients were also included in the CMR cohort, all of whom underwent electrophysiological study after CMR.
Electrophysiological testing and radiofrequency ablation procedures including mapping and ablation techniques have been previously described14, 15. A detailed electroanatomic map of the RV endocardium and biventricular epicardium was created during sinus rhythm. The peak-to-peak signal amplitude of the bipolar electrogram was measured and displayed as color gradients on a 3-dimensional computerized bipolar voltage map. RV signal amplitude ≥1.5 mV was classified as normal15, 16. Electroanatomic scar was defined as an area >1 cm2 of at least 3 bipolar points with signal amplitude <0.5 mV. All electroanatomic scar areas were sharply demarcated and surrounded by a border zone with low signal amplitude (0.5 to 1.5 mV), which merged into normal myocardium (≥1.5 mV).
To induce ventricular arrhythmias, programmed stimulation with up to 3 ventricular extrastimuli were delivered from 2 different RV sites. Additionally, all patients underwent an aggressive stimulation protocol, which included high-dose isoproterenol infusion (starting at 2 mcg/min and incrementally increasing to 30 mcg/min) and rapid ventricular burst pacing. Induced ventricular tachycardia (VT) morphologies were carefully mapped and recorded for each patient. Different VTs within a patient were distinguished by an axis shift >30 degrees. All patients underwent a substrate-based ablation targeting isolated late potentials, as previously described17. Sites of successful ablation were carefully recorded for every VT.
Statistical analysis
Continuous data were presented as mean ± standard deviation, and categorical data as numbers (percentages) or median (range). Continuous variables were compared using the independent Student t-test or analysis of variance, and categorical data using the Chi-square test. The cumulative freedom from arrhythmic events since presentation was determined by Kaplan Meier method. Differences in survival among groups were evaluated with a log-rank test. A p-value of <0.05 was considered statistically significant. Statistical calculations were performed using SPSS version 19.0 (IBM, Chicago, Illinois).
Results
Study population
The study population comprised 80 patients from 58 families harboring a pathogenic ARVD/C-associated desmosomal mutation (83% Plakophilin-2 (PKP2), Supplementary Table 1). Patient characteristics are shown in Table 1. Mean age was 33.3 ± 14.3 years, and 35 (44%) were male. Symptoms were reported in the majority of patients (n=56 (70%)). All patients fulfilled revised TFC for ARVD/C at last follow-up (median 7 points, range 4-10).
Table 1.
Characteristics of the study population.
| Overall * (n=80) | |
|---|---|
| Male | 35 (44) |
| Age at CMR/EPS (yrs) | 33.3 ± 14.3 |
| Symptomatic | 56 (70) |
| Syncope | 25 (31) |
| Presyncope | 20 (25) |
| Palpitations | 45 (56) |
| Chest pain | 9 (11) |
| TFC | 7 (range 4-10) |
| Epsilon wave | 5 (6) |
| Prolonged TAD | 31 (39) |
| Negative T waves | 75 (94) |
| V1-3 or beyond | 58 (73) |
| V1-2 | 14 (18) |
| V4-6 with complete RBBB | 3 (4) |
| Late potentials on SAECG* | 28/42 (67) |
| LBBB VT with superior axis | 19 (24) |
| LBBB VT | 28 (35) |
| PVC >500/24 h † | 47/64 (73) |
| Structural major TFC | 40 (50) |
| Structural minor TFC | 14 (18) |
Overall, 74 patients underwent CMR, 11 patients underwent electrophysiological study, and 5 patients underwent both.
42 patients underwent SAECG.
64 patients underwent Holter monitoring. Abbreviations: CMR: cardiac magnetic resonance, EPS: electrophysiological study, LBBB: left bundle branch block, PVC: premature ventricular complex, RBBB: right bundle branch block, SAECG: signal-averaged ECG, TAD: terminal activation duration, TFC: Task Force Criteria, VT: ventricular tachycardia.
CMR results
Seventy-four patients (mean age 33.7 ± 15.0 years, 31 (42%) male) underwent CMR. Among 54/74 (73%) subjects who had CMR abnormalities, RV abnormalities were reported in 52 (96%) patients, and 28 (52%) individuals had biventricular involvement. Two (4%) patients had isolated LV abnormalities (both Desmoplakin (DSP) mutation carriers). Extensive CMR results are presented in the Supplementary Material. Dyskinetic basal inferior wall was the most prevalent RV finding (n=49/52, 94%), followed by basal anterior wall dyskinesis (n=45/52, 87%). Subepicardial fat infiltration in the LV posterolateral wall was the most common LV finding in 24/30 (80%) patients. Representative examples of RV and LV abnormalities are shown in Figure 1 and Figure 2, respectively.
Figure 1. Representative CMR Examples of RV Involvement in ARVD/C.
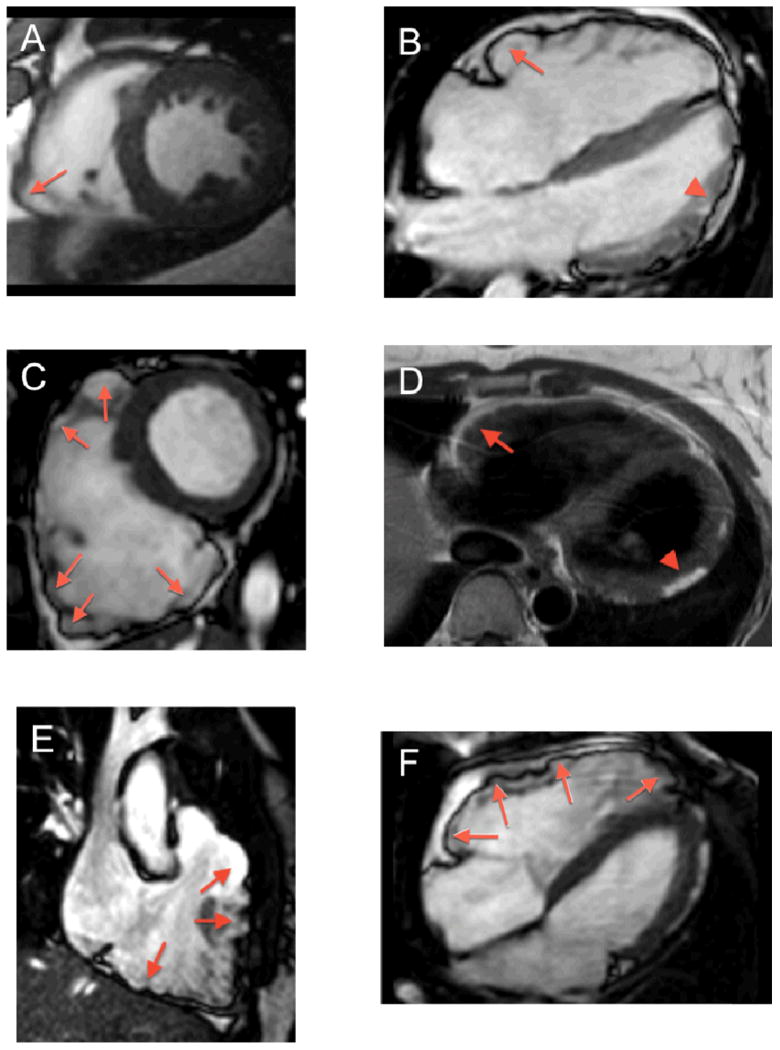
(A) Short axis bright blood image showing dyskinesis of the acute angle (arrow). (B) Horizontal long axis bright blood image showing subtricuspid bulging (arrow). Note subepicardial fat infiltration and wall thinning of the LV apicolateral region (arrowhead). (C) Short axis bright blood image showing a dilated RV with microaneurysms and dyskinesis of the inferior wall, acute angle, and anterior wall of the RV (arrows). (D) T1-weighted image reveals moderate subepicardial fat infiltration of the RV anterior wall, extending as “fingers” into the myocardium (arrow). Note fatty infiltration in the LV lateral wall (arrowhead). (E) RVOT bright blood image showing dyskinesis of the RVOT and RV inferior wall (arrows). (F) Horizontal long axis bright blood image showing dyskinesis of the subtricuspid region, RV anterior wall and RV apex (arrows). Abbreviations: ARVD/C: Arrhythmogenic Right Ventricular Dysplasia/Cardiomyopathy, CMR: cardiac magnetic resonance, RV: right ventricular, RVOT: right ventricular outflow tract.
Figure 2. LV Abnormalities in ARVD/C.
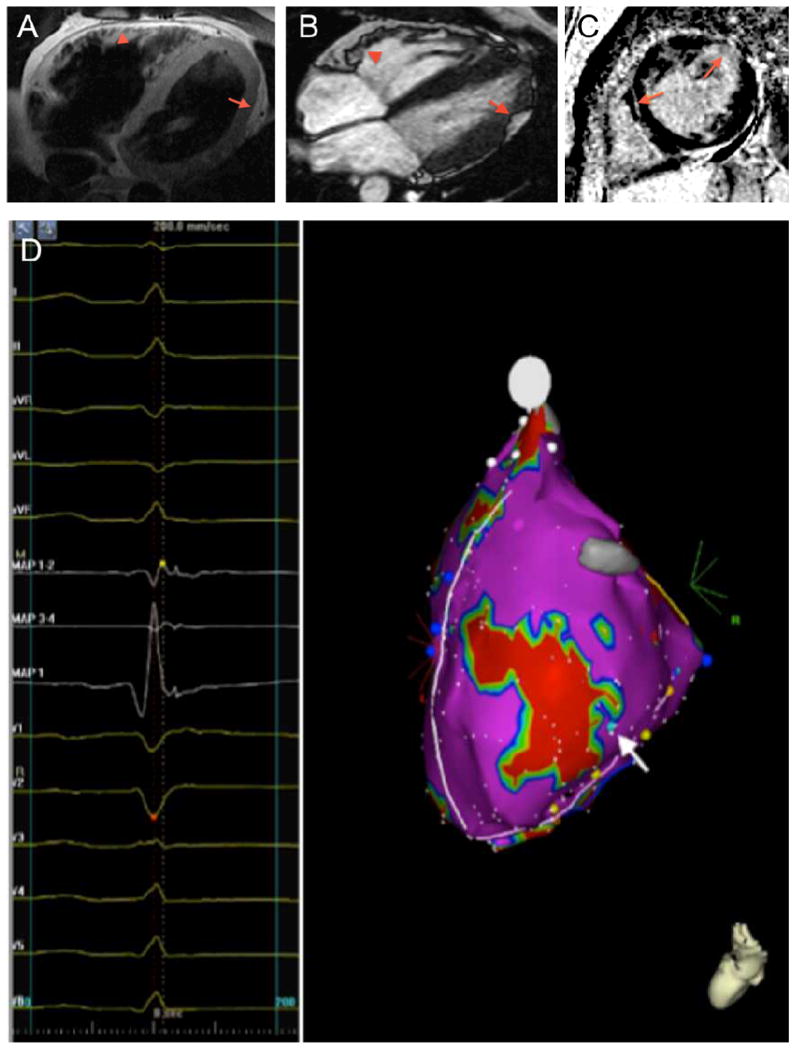
(A) T1-weighted CMR image revealing subepicardial fat infiltration with myocardial wall thinning in the mid- to apical LV lateral wall (arrow). Also note subepicardial fat infiltration in the RV anterior wall (arrowhead). (B) Horizontal long axis bright blood CMR image showing subepicardial fat infiltration in the mid- to apical LV lateral wall (arrow). In addition, microaneurysms of the RV anterior wall are observed (arrowhead). (C) Late gadolinium enhanced short-axis CMR image showing delayed enhancement of the LV anterolateral wall, and a streak of intramyocardial delayed enhancement in the septal wall (arrows). (D) Left lateral electroanatomic voltage map revealing late potentials in the LV lateral wall surrounding an area of electroanatomic dense scar (<0.5 mV, colored red) (arrow). Abbreviations: ARVD/C: Arrhythmogenic Right Ventricular Dysplasia/Cardiomyopathy, CMR: cardiac magnetic resonance, LV: left ventricular, RV: right ventricular.
Pattern of Structural Involvement
We divided our patient cohort into three groups based on the number of abnormal RV segments: 1) limited disease, defined as 0 or 1 abnormal RV segments (n=27); 2) moderate disease, defined as 2 or 3 abnormal RV segments (n=20); and 3) advanced disease, defined as >3 abnormal RV segments (n=27). As highlighted in Figure 3, a pattern of RV involvement was observed. Among 5 patients with one abnormal RV segment, only the inferior wall abutting the diaphragm close to the base (n=2, 40%), the basal anterior wall below the RV outflow tract (RVOT) (n=2, 40%), or the segment where the inferior wall meets the anterior wall, i.e., the acute angle of the RV (n= 1, 20%) were affected. In patients with two or three abnormal RV segments, abnormalities extended to the RV outflow tract (RVOT) (n=3, 15%) and RV apex (n=2, 10%). Patients with more than three abnormal RV segments had involvement of the entire RV with a higher proportion of RVOT (n=23, 85%) and RV apical involvement (n=20, 74%) than patients with limited or moderate disease (p<0.001 and p=0.002, respectively). As noted in Figure 3, the RV apex was never involved in limited cases and uncommonly (n=2/20, 10%) in moderate disease. Global RV volumes were significantly higher and RV function was significantly lower with increasing number of abnormal RV segments (RV EDV/BSA and RV EF both p<0.001, Supplementary Table 3).
Figure 3. RV Regional Cardiac Involvement.
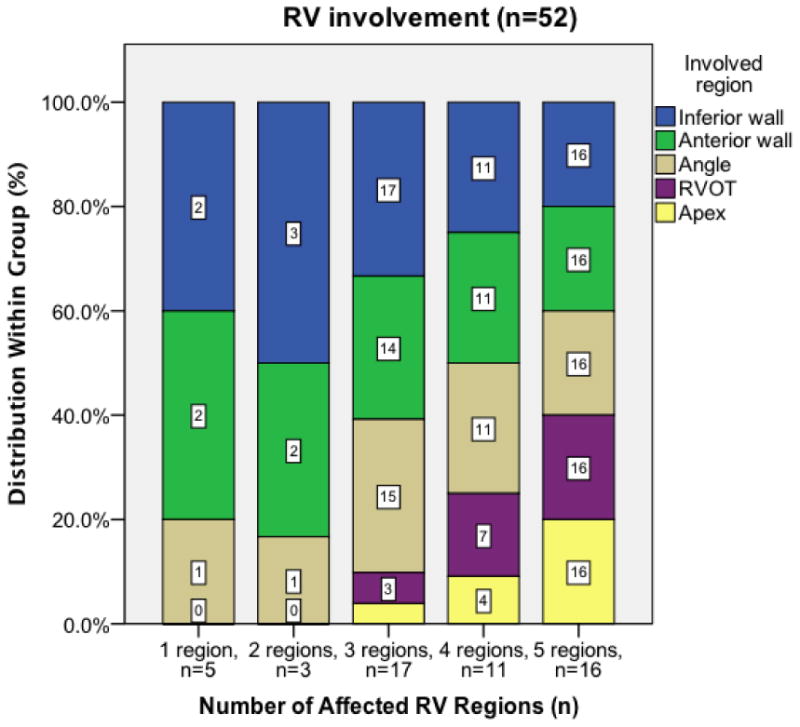
Patients are stratified based on number of RV regions involved; numbers in the bars refer to number of patients with involvement of that specific region. A pattern of RV involvement is observed. In patients with limited disease (1 region affected), only the RV inferior wall, anterior wall, and/or acute angle are affected. In patients with moderate disease (2-3 regions affected), the RVOT and RV apex may also be affected, but abnormalities in these regions are infrequent. In patients with advanced disease (4-5 regions affected), a higher proportion of RVOT and RV apical involvement is observed. Abbreviations: RV: right ventricular, RVOT: right ventricular outflow tract.
Although LV involvement was significantly more likely in advanced RV disease (n=19, 70%) (p=0.006), it was also seen in both limited (n=4, 15%) and moderate (n=5, 25%) ARVD/C. In addition, 2 (9%) patients with no RV abnormalities had LV abnormalities (both DSP mutation carriers). Involvement of the LV posterolateral wall was significantly more often observed than RV apical involvement in limited and moderate ARVD/C cases (23% vs 4%, p=0.012). Among those with LV involvement, LV volume was normal (LV EDV/BSA 88.3 ± 15.6 ml/m2), and LV function was low normal (LV EF 49.6 ± 6.8 %).
Clinical implications
We compared patients with increasing structural severity with respect to clinical and outcome variables (Supplementary Table 4). During 6.0 ± 5.6 years of follow-up, 30 (41%) patients experienced an arrhythmic event. The first arrhythmic event was a spontaneous sustained VT in 20 (67%) patients, appropriate ICD intervention in 7 (23%) patients (median cycle length 270 ms (range 200-325 ms)), and resuscitated sudden cardiac death in 3 (10%) patients. Mean age at time of the first event was 27.7 ± 10.9 years; mean cycle length was 273 ± 50 ms. Among patients who experienced a first arrhythmic event after or within 3 months of CMR, arrhythmia free survival was significantly lower in patients with more abnormal RV segments (p<0.001) (Figure 4). Among those with advanced structural abnormalities (n=24), cumulative survival free from arrhythmic events after 1, 5 and 10 years was 57% (95% CI 37-77%), 42% (95% CI 20-64%) and 35% (95% CI 13-57%). None of the study population died or required cardiac transplantation during follow-up.
Figure 4. Incremental Risk of Sustained Ventricular Arrhythmia with Increasing Severity of Structural Disease.
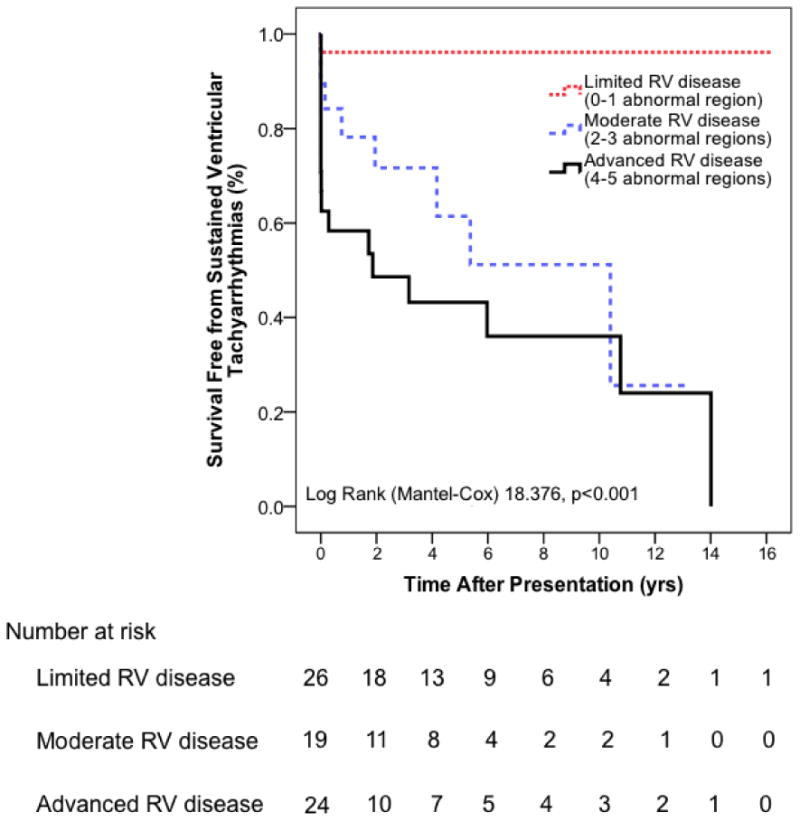
Arrhythmogenic Right Ventricular Dysplasia/Cardiomyopathy patients with more severe structural disease (i.e. more abnormal right ventricular regions) have a significantly higher arrhythmic propensity compared to patients with limited structural disease.
Electroanatomic and Arrhythmic Substrate in ARVD/C
Electroanatomic Scar
Eleven patients (mean age 30.8 ± 8.7 years, 5 (45%) male), all of whom with clinical sustained tachyarrhythmia (left bundle branch block VT in 9 patients, right bundle branch block VT in 1 patient, no available documentation in 1 patient), underwent electrophysiological study. Representative epicardial electroanatomic voltage maps are shown in Figure 5A; endocardial voltage maps can be found in the Supplementary Material. A mean of 379 ± 190 and 228 ± 167 points were sampled in the epicardium and endocardium, respectively. All 11 subjects had epicardial scar (<0.5 mV), and 6 (54%) patients had endocardial scar (<0.5 mV). Electroanatomic scar was significantly more extensive in the epicardium compared to the endocardium (64.5 ± 43.4 cm2 vs. 7.0 ± 9.4 cm2, p<0.001).
Figure 5. Electroanatomic Scar and Arrhythmic Substrate in ARVD/C.
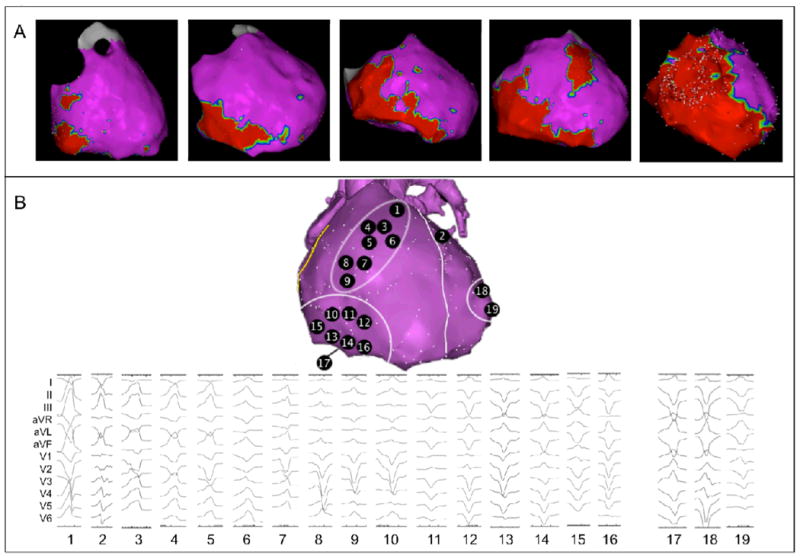
(A) RV involvement follows a pattern, as shown by representative epicardial electroanatomic voltage maps. Electroanatomic scar (<0.5 mV) is colored red; normal and low-voltage epicardium (≥0.5 mV) is colored purple. From left to right: patients with limited disease typically show scar in the subtricuspid region. In patients with moderate disease, an extension of scar along the inferior wall towards the RV apex, as well as to the basal anterior wall is observed. Advanced cases of ARVD/C show global RV involvement. Notably, RVOT and RV apical involvement were never observed as an isolated abnormality. (B) Sites of successful VT ablation in ARVD/C patients. All 19 induced VTs are shown, as well as corresponding sites of successful VT ablation. VTs are arranged and numbered based on bundle branch block morphology and axis. Overall, 16 VTs were mapped to and successfully ablated on the RV surface, clustering to two regions: VTs 1 and 3-9 were mapped to the basal anterior wall below the RVOT, VTs 10-16 were mapped to the subtricuspid region extending along the inferior wall. VT 17 was mapped to the RV inferior wall close to the interventricular groove. Overall, 3 VTs were mapped to and successfully ablated on the LV surface: VT 2 (anterior wall close to the interventricular septum), VT 18 (lateral wall), and VT 19 (posterolateral wall). Overall, 18 VTs came from the epicardial surface; only VT 12 was successfully ablated on the endocardium. Abbreviations: ARVD/C: Arrhythmogenic Right Ventricular Dysplasia/Cardiomyopathy, LV: left ventricular, RV: right ventricular, RVOT: right ventricular outflow tract, VT: ventricular tachycardia.
The pattern of epicardial scar location on electroanatomic mapping showed a striking similarity to the pattern of regional abnormalities in the CMR cohort. RV epicardial scar was most frequently located to the subtricuspid region (n=11, 100%), followed by the RV basal anterior wall (n=7, 64%) (Figure 5A). In patients with more extensive involvement, the RVOT and RV apex were affected in order of decreasing frequency (n=5 (45%) and n=2 (18%), respectively). Again, isolated RVOT or RV apical scar was not observed. Low voltage (<1.5mV) regions in the LV epicardium were seen in 6 (55%) patients, most commonly in the LV lateral wall (5/6, 83%) (Figure 2D).
Origin of Ventricular Arrhythmias
A total of 19 monomorphic VTs were induced in 10 (91%) of 11 patients who underwent electrophysiological study. In the remaining patient, ventricular flutter of undetermined morphology was induced. Mean cycle length of the induced VTs was 374 ± 73 msec. Overall, 18 of 19 VTs were mapped and successfully ablated from the epicardial surface. Each of the ablation sites had fractionated electrograms with discrete presystolic potentials during tachycardia. The site of successful ablation for each VT is shown in Figure 5B. Of 19 VTs, 16 (84%) originated from the RV, and 3 (16%) were mapped to the LV (2 LV posterolateral wall and 1 LV anterior wall). All RV VTs clustered to the subtricuspid region (n=8, 50%) and basal anterior wall (n=8, 50%), similar to the pattern of CMR abnormalities and electroanatomic scar. No VT originated from the RV apex.
Discussion
The finding of isolated RV disease in young subjects presenting with ventricular arrhythmias of RV origin raises the suspicion of ARVD/C. This notion derives its roots from the seminal description of ARVD/C three decades ago, and formed the basis for the diagnostic TFC1, 10. As such, LV disease and right bundle branch block arrhythmias are thought to be uncommon in ARVD/C, and their presence is believed to suggest alternative diagnosis. Further, the pattern of preferential RV disease described in the early ARVD/C literature has lead to a series of investigations focusing on developmental differences between the two ventricles. Difficulty in interpreting the physiologic cardiac fat distribution and RV apical wall motion has lead to misdiagnosis of ARVD/C, often with therapeutic consequences in essentially healthy individuals18. Our results in carefully genotyped and phenotyped ARVD/C patients reveal a previously unrecognized characteristic pattern of cardiac disease in ARVD/C that involves the epicardial surface of the basal RV and lateral LV. Electroanatomic scar mapping confirms this disease pattern, and arrhythmias originating from the epicardial LV are not uncommon. These data redefine the cardiac phenotype of this peculiar, difficult to diagnose disease and provide information that may be of use for physicians encountering this diagnosis.
Pattern of Cardiac Disease in ARVD/C
Limited ARVD/C preferentially affects the basal inferior RV, extending to the basal anterior RV below the RVOT in moderate disease. Advanced ARVD/C is accompanied with global RV involvement. RV abnormalities usually manifest as abnormal wall motion, which in our cohort corresponded to a decrease in global RV function with advanced disease. It is notable that RV apical involvement was never observed as an isolated abnormality; involvement of this region only occurred in advanced ARVD/C typically as a part of global RV involvement. Interestingly, the extent of RV involvement was significantly related to the occurrence of critical arrhythmias in this cohort. As involvement of the RV apex only occurred in moderate and advanced ARVD/C, this confirms late involvement of this region in the disease process. This is particularly important, as the RV apex is often thin and difficult to assess, resulting in a frequent cause of misdiagnosis in ARVD/C18.
In contrast, epicardial fat infiltration of the LV posterolateral wall was significantly more prevalent than RV apical involvement in limited or moderate disease. Our study reveals that LV involvement in ARVD/C may occur at any stage of RV myopathy, and that global LV function usually is preserved. Recognition of this pattern of LV involvement may help the clinician to correctly establish ARVD/C diagnosis.
Electroanatomic Scar and Arrhythmias in ARVD/C
Another important result of this study is the predominant epicardial distribution of electroanatomic scar in ARVD/C. On electroanatomic voltage maps, scar located predominantly to the epicardial basal RV and posterolateral LV, and 18 of 19 VTs were successfully ablated on the epicardial surface. This is in concordance with prior studies, which showed a larger epicardial than endocardial substrate in ARVD/C19, 20. Importantly, VTs in our study arose from both ventricles, originating from regions with low voltage and late potentials surrounding the scar. None of the spontaneous or induced arrhythmias originated from the septal RVOT or RV apical region. This may assist in distinguishing ARVD/C from other causes of RV arrhythmias. Notably, 16% of induced VTs were mapped to the LV, suggesting that LV VTs are not uncommon in ARVD/C. These results have important implications for electrophysiological management strategies in ARVD/C, indicating target regions for substrate mapping and ablation, and suggesting that the threshold for considering epicardial mapping and ablation in ARVD/C should be lowered.
The Triangle of Dysplasia Displaced in ARVD/C
With these results, our study supports the presence of a new biventricular triangle in early ARVD/C involving the RV basal inferior wall, RV basal anterior wall and LV posterolateral wall, displacing the RV apex (Supplementary Figure 5). The historic Triangle of Dysplasia involving the RV inferior wall, RVOT, and RV apex is likely to reflect severe cases of ARVD/C, and is probably not applicable to early disease manifestations. This is understandable, as prior studies describing the Triangle of Dysplasia were conducted in tertiary centers before genetic testing for ARVD/C became available and revised diagnostic TFC were adopted1, 2, 20. Since the 1994 TFC had low sensitivity for early diagnosis21, these early patient series most likely reflected a severe and advanced form of the disease. Although preferential involvement of the subtricuspid region and LV posterolateral wall has been described before in separate ARVD/C reports4, 8, the focus on the pattern of involvement and description of the “new Triangle of Dysplasia” is novel. This finding has significant implications for ARVD/C diagnosis and management in clinical practice.
Insights into Etiopathophysiology of ARVD/C
Although several hypotheses have been put forth to explain the preferential involvement of the RV in ARVD/C, there currently is no unifying hypothesis that explains the patchy, yet predictable pattern of RV involvement that we observed. Based on the results of this study, we hypothesize that conduction delay, one of the defining features of ARVD/C, plays an important role in the disease process. The epicardial RV perivalvular area and LV posterolateral wall are late activated regions in the normal heart during sinus rhythm22, 23. In ARVD/C, this activation delay is aggravated, since desmosomal mutations have been shown to give rise to conduction delay through gap junction remodeling and sodium channel dysfunction24, 25. It is notable that involvement of the RVOT, which also is a physiologically late activated region, was only observed in moderate and advanced ARVD/C. Hypothetically, elevated regional wall stress may contribute to disease expression in late activated regions. The subpulmonic RVOT, mainly serving as a conduit for RV output, receives less wall stress than the basal inferior and anterior RV, possibly explaining the disease pattern that we observed. Although our report provides important insights into patterns of regional involvement and possible disease mechanisms, these hypotheses need to be mechanistically addressed.
Study Limitations
Studies on ARVD/C are typically small in size. Only 5 patients of the CMR cohort underwent a complete electrophysiological study. However, the observed pattern of regional involvement was strikingly similar on CMR and electrophysiological study in the overall cohort, and the association of this pattern with critical arrhythmias is convincing. Since the group of patients who underwent electrophysiological study is small, these data should primarily be regarded as validation of the CMR results. We only included patients who carried an ARVD/C-associated desmosomal mutation in this study. Therefore, we need to consider that our results may not pertain to ARVD/C patients without pathogenic mutations. It would be interesting to see if similar results can be obtained in mutation negative patients. The areas of CMR or electrophysiological abnormalities were not corroborated by pathological analysis in this study. Unfortunately, endomyocardial biopsies were not routinely performed in this cohort. While we only used CMR and electrophysiological study to describe the pattern of cardiac involvement, these widely accepted techniques presented us with the opportunity to provide a complete overview of the structural and electrical substrate in ARVD/C.
Conclusion
In this cohort of genetically confirmed ARVD/C patients, we show that regional cardiac involvement in ARVD/C mutation carriers follows a previously unrecognized characteristic pattern involving the basal RV and posterolateral LV. RV apical involvement is only observed in advanced cases of ARVD/C, typically as a part of global RV disease. Arrhythmias may arise from both ventricles, originating from the diseased regions. Further research is warranted to confirm our results and to elucidate the role of electrical conduction delay in the etiopathophysiology of ARVD/C.
Supplementary Material
Supplementary Figure 1. Schematic representation of our scoring system for regional cardiac involvement. A 5-segment RV and 17-segment LV model13 was used to score cardiac regional involvement. Abbreviations: LV: left ventricular, RV: right ventricular, RVOT: right ventricular outflow tract.
Supplementary Figure 2. Epicardial electroanatomic voltage maps for 11 patients who underwent a complete electrophysiological study. Numbers in the images refer to sites of successful VT ablation in these patients (Figure 5B in the main manuscript). Electroanatomic scar (<0.5 mV) is colored red; normal and low-voltage myocardium (≥0.5 mV) is colored purple. Abbreviations: VT: ventricular tachycardia.
Supplementary Figure 3. Endocardial electroanatomic voltage maps for 11 patients who underwent a complete electrophysiological study. Electroanatomic scar (<0.5 mV) is colored red; normal and low-voltage myocardium (≥0.5 mV) is colored purple.
Supplementary Figure 4. Representative example of correspondence between epicardial scar (<0.5 mV) and endocardial low voltage area (<1.5 mV) in an ARVD/C patient. Abbreviations: ARVD/C: Arrhythmogenic Right Ventricular Dysplasia/Cardiomyopathy.
(A). Anteroposterior view of the epicardial electroanatomic voltage map showing a large area of epicardial scar involving the subtricuspid region, RV inferior wall, and RV free wall. An encircled area of normal voltage can be appreciated in the RV anterior wall. Abbreviations: RV: right ventricular, RVOT: right ventricular outflow tract.
(B). Anteroposterior view of the endocardial electroanatomic voltage map revealing low voltage in the subtricuspid region, RV inferior wall, and RV anterior wall. Epicardial scar and endocardial low voltage show a very similar regional distribution. Abbreviations: RV: right ventricular.
Supplementary Figure 5. New Triangle of Structural Abnormalities in Early ARVD/C. Structural abnormalities in ARVD/C preferentially locate to the epicardial subtricuspid region (1), the RV basal anterior wall (2), and the LV posterolateral wall (3). These regions are all late activated region of the normal heart during sinus rhythm, depicted by isochronic activation times (based on Durrer et al, Circulation 1970; 41:899-912). This activation delay is aggravated in ARVD/C. Abbreviations: ARVD/C: Arrhythmogenic Right Ventricular Dysplasia/Cardiomyopathy, LV: left ventricular, RV: right ventricular.
Supplementary Table 1. Mutations among the study population.
Supplementary Table 2. Patient Characteristics in the Johns Hopkins and Dutch CMR cohort.
Supplementary Table 3. CMR results for the study population.
Supplementary Table 4. Comparison of patients with increasing structural severity with respect to clinical variables.
Acknowledgments
The authors are grateful to the ARVD/C patients and families who have made this work possible.
The authors wish to acknowledge funding from the Dutch Heart Foundation (to ASJMtR), the Alexandre Suerman Stipend (to ASJMtR), the Interuniversity Cardiology Institute of the Netherlands (to JAG), the National Heart, Lung, and Blood Institute (K23HL093350 to HT), the St. Jude Medical Foundation, and Medtronic Inc. The Johns Hopkins ARVD/C Program (ARVD.com) is supported by the Bogle Foundation, the Healing Hearts Foundation, the Campanella family, and Wilmerding Endowments, and the Dr. Francis P. Chiaramonte Private Foundation.
Dr. Calkins received research support from Medtronic and St. Jude Medical.
Footnotes
Other authors: No disclosures.
References
- 1.Marcus FI, Fontaine GH, Guiraudon G, Frank R, Laurenceau JL, Malergue C, Grosgogeat Y. Right ventricular dysplasia: a report of 24 adult cases. Circulation. 1982;65:384–398. doi: 10.1161/01.cir.65.2.384. [DOI] [PubMed] [Google Scholar]
- 2.Corrado D, Basso C, Thiene G, McKenna WJ, Davies MJ, Fontaliran F, Nava A, Silvestri F, Blomstrom-Lundqvist C, Wlodarska EK, Fontaine G, Camerini F. Spectrum of clinicopathologic manifestations of arrhythmogenic right ventricular cardiomyopathy/dysplasia: a multicenter study. J Am Coll Cardiol. 1997;30:1512–1520. doi: 10.1016/s0735-1097(97)00332-x. [DOI] [PubMed] [Google Scholar]
- 3.Dalal D, Nasir K, Bomma C, Prakasa K, Tandri H, Piccini J, Roguin A, Tichnell C, James C, Russell SD, Judge DP, Abraham T, Spevak PJ, Bluemke DA, Calkins H. Arrhythmogenic right ventricular dysplasia: a United States experience. Circulation. 2005;112:3823–3832. doi: 10.1161/CIRCULATIONAHA.105.542266. [DOI] [PubMed] [Google Scholar]
- 4.Sen-Chowdhry S, Syrris P, Ward D, Asimaki A, Sevdalis E, McKenna WJ. Clinical and genetic characterization of families with arrhythmogenic right ventricular dysplasia/cardiomyopathy provides novel insights into patterns of disease expression. Circulation. 2007;115:1710–1720. doi: 10.1161/CIRCULATIONAHA.106.660241. [DOI] [PubMed] [Google Scholar]
- 5.Marcus FI, Zareba W, Calkins H, Towbin JA, Basso C, Bluemke DA, Estes NA, 3rd, Picard MH, Sanborn D, Thiene G, Wichter T, Cannom D, Wilber DJ, Scheinman M, Duff H, Daubert J, Talajic M, Krahn A, Sweeney M, Garan H, Sakaguchi S, Lerman BB, Kerr C, Kron J, Steinberg JS, Sherrill D, Gear K, Brown M, Severski P, Polonsky S, McNitt S. Arrhythmogenic right ventricular cardiomyopathy/dysplasia clinical presentation and diagnostic evaluation: results from the North American Multidisciplinary Study. Heart Rhythm. 2009;6:984–992. doi: 10.1016/j.hrthm.2009.03.013. [DOI] [PMC free article] [PubMed] [Google Scholar]
- 6.Li CH, Lin YJ, Huang JL, Wu TJ, Cheng CC, Lin WS, Tuan TC, Chang SL, Lo LW, Hu YF, Chao TF, Chung FP, Tsai CF, Tsao HM, Chen SA. Long-term follow-up in patients with arrhythmogenic right ventricular cardiomyopathy. J Cardiovasc Electrophysiol. 2012;23:750–756. doi: 10.1111/j.1540-8167.2011.02288.x. [DOI] [PubMed] [Google Scholar]
- 7.Marcus FI, Abidov A. Arrhythmogenic right ventricular cardiomyopathy 2012: diagnostic challenges and treatment. J Cardiovasc Electrophysiol. 2012;23:1149–1153. doi: 10.1111/j.1540-8167.2012.02412.x. [DOI] [PubMed] [Google Scholar]
- 8.Bauce B, Basso C, Rampazzo A, Beffagna G, Daliento L, Frigo G, Malacrida S, Settimo L, Danieli G, Thiene G, Nava A. Clinical profile of four families with arrhythmogenic right ventricular cardiomyopathy caused by dominant desmoplakin mutations. Eur Heart J. 2005;26:1666–1675. doi: 10.1093/eurheartj/ehi341. [DOI] [PubMed] [Google Scholar]
- 9.Sen-Chowdhry S, Prasad SK, Syrris P, Wage R, Ward D, Merrifield R, Smith GC, Firmin DN, Pennell DJ, McKenna WJ. Cardiovascular magnetic resonance in arrhythmogenic right ventricular cardiomyopathy revisited: comparison with task force criteria and genotype. J Am Coll Cardiol. 2006;48:2132–2140. doi: 10.1016/j.jacc.2006.07.045. [DOI] [PubMed] [Google Scholar]
- 10.Marcus FI, McKenna WJ, Sherrill D, Basso C, Bauce B, Bluemke DA, Calkins H, Corrado D, Cox MG, Daubert JP, Fontaine G, Gear K, Hauer R, Nava A, Picard MH, Protonotarios N, Saffitz JE, Sanborn DM, Steinberg JS, Tandri H, Thiene G, Towbin JA, Tsatsopoulou A, Wichter T, Zareba W. Diagnosis of arrhythmogenic right ventricular cardiomyopathy/dysplasia: proposed modification of the task force criteria. Circulation. 2010;121:1533–1541. doi: 10.1161/CIRCULATIONAHA.108.840827. [DOI] [PMC free article] [PubMed] [Google Scholar]
- 11.Tandri H, Calkins H, Nasir K, Bomma C, Castillo E, Rutberg J, Tichnell C, Lima JA, Bluemke DA. Magnetic resonance imaging findings in patients meeting task force criteria for arrhythmogenic right ventricular dysplasia. J Cardiovasc Electrophysiol. 2003;14:476–482. doi: 10.1046/j.1540-8167.2003.02560.x. [DOI] [PubMed] [Google Scholar]
- 12.Dalal D, Tandri H, Judge DP, Amat N, Macedo R, Jain R, Tichnell C, Daly A, James C, Russell SD, Abraham T, Bluemke DA, Calkins H. Morphologic variants of familial arrhythmogenic right ventricular dysplasia/cardiomyopathy a genetics-magnetic resonance imaging correlation study. J Am Coll Cardiol. 2009;53:1289–1299. doi: 10.1016/j.jacc.2008.12.045. [DOI] [PubMed] [Google Scholar]
- 13.Cerqueira MD, Weissman NJ, Dilsizian V, Jacobs AK, Kaul S, Laskey WK, Pennell DJ, Rumberger JA, Ryan T, Verani MS. Standardized myocardial segmentation and nomenclature for tomographic imaging of the heart: a statement for healthcare professionals from the Cardiac Imaging Committee of the Council on Clinical Cardiology of the American Heart Association. Circulation. 2002;105:539–542. doi: 10.1161/hc0402.102975. [DOI] [PubMed] [Google Scholar]
- 14.Stevenson WG, Khan H, Sager P, Saxon LA, Middlekauff HR, Natterson PD, Wiener I. Identification of reentry circuit sites during catheter mapping and radiofrequency ablation of ventricular tachycardia late after myocardial infarction. Circulation. 1993;88:1647–1670. doi: 10.1161/01.cir.88.4.1647. [DOI] [PubMed] [Google Scholar]
- 15.Corrado D, Basso C, Leoni L, Tokajuk B, Bauce B, Frigo G, Tarantini G, Napodano M, Turrini P, Ramondo A, Daliento L, Nava A, Buja G, Iliceto S, Thiene G. Three-dimensional electroanatomic voltage mapping increases accuracy of diagnosing arrhythmogenic right ventricular cardiomyopathy/dysplasia. Circulation. 2005;111:3042–3050. doi: 10.1161/CIRCULATIONAHA.104.486977. [DOI] [PubMed] [Google Scholar]
- 16.Marchlinski FE, Callans DJ, Gottlieb CD, Zado E. Linear ablation lesions for control of unmappable ventricular tachycardia in patients with ischemic and nonischemic cardiomyopathy. Circulation. 2000;101:1288–1296. doi: 10.1161/01.cir.101.11.1288. [DOI] [PubMed] [Google Scholar]
- 17.Marchlinski FE, Zado E, Dixit S, Gerstenfeld E, Callans DJ, Hsia H, Lin D, Nayak H, Russo A, Pulliam W. Electroanatomic substrate and outcome of catheter ablative therapy for ventricular tachycardia in setting of right ventricular cardiomyopathy. Circulation. 2004;110:2293–2298. doi: 10.1161/01.CIR.0000145154.02436.90. [DOI] [PubMed] [Google Scholar]
- 18.Bomma C, Rutberg J, Tandri H, Nasir K, Roguin A, Tichnell C, Rodriguez R, James C, Kasper E, Spevak P, Bluemke DA, Calkins H. Misdiagnosis of arrhythmogenic right ventricular dysplasia/cardiomyopathy. J Cardiovasc Electrophysiol. 2004;15:300–306. doi: 10.1046/j.1540-8167.2004.03429.x. [DOI] [PubMed] [Google Scholar]
- 19.Garcia FC, Bazan V, Zado ES, Ren JF, Marchlinski FE. Epicardial substrate and outcome with epicardial ablation of ventricular tachycardia in arrhythmogenic right ventricular cardiomyopathy/dysplasia. Circulation. 2009;120:366–375. doi: 10.1161/CIRCULATIONAHA.108.834903. [DOI] [PubMed] [Google Scholar]
- 20.Basso C, Thiene G, Corrado D, Angelini A, Nava A, Valente M. Arrhythmogenic right ventricular cardiomyopathy. Dysplasia, dystrophy, or myocarditis? Circulation. 1996;94:983–991. doi: 10.1161/01.cir.94.5.983. [DOI] [PubMed] [Google Scholar]
- 21.Cox MG, van der Smagt JJ, Noorman M, Wiesfeld AC, Volders PG, van Langen IM, Atsma DE, Dooijes D, Houweling AC, Loh P, Jordaens L, Arens Y, Cramer MJ, Doevendans PA, van Tintelen JP, Wilde AA, Hauer RN. Arrhythmogenic right ventricular dysplasia/cardiomyopathy diagnostic task force criteria: impact of new task force criteria. Circ Arrhythm Electrophysiol. 2010;3:126–133. doi: 10.1161/CIRCEP.109.927202. [DOI] [PubMed] [Google Scholar]
- 22.Barbato E, Pileggi F, Debes AC, Fujioka T, Magalhaes MS, Tranchesi J, San Juan E, Decourt LV. Study of the sequence of ventricular activation and the QRS complex of the normal human heart using direct epicardial leads. Am Heart J. 1958;55:867–880. doi: 10.1016/0002-8703(58)90102-9. [DOI] [PubMed] [Google Scholar]
- 23.Durrer D, van Dam RT, Freud GE, Janse MJ, Meijler FL, Arzbaecher RC. Total excitation of the isolated human heart. Circulation. 1970;41:899–912. doi: 10.1161/01.cir.41.6.899. [DOI] [PubMed] [Google Scholar]
- 24.Kaplan SR, Gard JJ, Protonotarios N, Tsatsopoulou A, Spiliopoulou C, Anastasakis A, Squarcioni CP, McKenna WJ, Thiene G, Basso C, Brousse N, Fontaine G, Saffitz JE. Remodeling of myocyte gap junctions in arrhythmogenic right ventricular cardiomyopathy due to a deletion in plakoglobin (Naxos disease) Heart Rhythm. 2004;1:3–11. doi: 10.1016/j.hrthm.2004.01.001. [DOI] [PubMed] [Google Scholar]
- 25.Sato PY, Musa H, Coombs W, Guerrero-Serna G, Patino GA, Taffet SM, Isom LL, Delmar M. Loss of plakophilin-2 expression leads to decreased sodium current and slower conduction velocity in cultured cardiac myocytes. Circ Res. 2009;105:523–526. doi: 10.1161/CIRCRESAHA.109.201418. [DOI] [PMC free article] [PubMed] [Google Scholar]
Associated Data
This section collects any data citations, data availability statements, or supplementary materials included in this article.
Supplementary Materials
Supplementary Figure 1. Schematic representation of our scoring system for regional cardiac involvement. A 5-segment RV and 17-segment LV model13 was used to score cardiac regional involvement. Abbreviations: LV: left ventricular, RV: right ventricular, RVOT: right ventricular outflow tract.
Supplementary Figure 2. Epicardial electroanatomic voltage maps for 11 patients who underwent a complete electrophysiological study. Numbers in the images refer to sites of successful VT ablation in these patients (Figure 5B in the main manuscript). Electroanatomic scar (<0.5 mV) is colored red; normal and low-voltage myocardium (≥0.5 mV) is colored purple. Abbreviations: VT: ventricular tachycardia.
Supplementary Figure 3. Endocardial electroanatomic voltage maps for 11 patients who underwent a complete electrophysiological study. Electroanatomic scar (<0.5 mV) is colored red; normal and low-voltage myocardium (≥0.5 mV) is colored purple.
Supplementary Figure 4. Representative example of correspondence between epicardial scar (<0.5 mV) and endocardial low voltage area (<1.5 mV) in an ARVD/C patient. Abbreviations: ARVD/C: Arrhythmogenic Right Ventricular Dysplasia/Cardiomyopathy.
(A). Anteroposterior view of the epicardial electroanatomic voltage map showing a large area of epicardial scar involving the subtricuspid region, RV inferior wall, and RV free wall. An encircled area of normal voltage can be appreciated in the RV anterior wall. Abbreviations: RV: right ventricular, RVOT: right ventricular outflow tract.
(B). Anteroposterior view of the endocardial electroanatomic voltage map revealing low voltage in the subtricuspid region, RV inferior wall, and RV anterior wall. Epicardial scar and endocardial low voltage show a very similar regional distribution. Abbreviations: RV: right ventricular.
Supplementary Figure 5. New Triangle of Structural Abnormalities in Early ARVD/C. Structural abnormalities in ARVD/C preferentially locate to the epicardial subtricuspid region (1), the RV basal anterior wall (2), and the LV posterolateral wall (3). These regions are all late activated region of the normal heart during sinus rhythm, depicted by isochronic activation times (based on Durrer et al, Circulation 1970; 41:899-912). This activation delay is aggravated in ARVD/C. Abbreviations: ARVD/C: Arrhythmogenic Right Ventricular Dysplasia/Cardiomyopathy, LV: left ventricular, RV: right ventricular.
Supplementary Table 1. Mutations among the study population.
Supplementary Table 2. Patient Characteristics in the Johns Hopkins and Dutch CMR cohort.
Supplementary Table 3. CMR results for the study population.
Supplementary Table 4. Comparison of patients with increasing structural severity with respect to clinical variables.