

Abstract
At a nanometer scale, the behavior of biological fluids is largely governed by interfacial physical chemistry. This may manifest as slowed or anomalous diffusion. Here we describe how measures developed for studying glassy systems allow quantitative measurement of interfacial effects on water dynamics, showing that correlated motions of particles near a surface result in a viscosity greater than anticipated from individual particle motions. This effect arises as a fundamental consequence of spatial heterogeneity on nanometer length scales and applies to any fluid near any surface. Increased interfacial viscosity also causes the classic finding that large solutes such as proteins diffuse much more slowly than predicted in bulk water. This has previously been treated via an empirical correction to the solute size: the hydrodynamic radius. Using measurements of quantities from theories of glass dynamics, we can now calculate diffusion constants from molecular details alone, eliminating the empirical correction factor.
Introduction
Most biological interactions occur in fluid that is near a surface interface rather than in bulk solvent. The high membrane surface area of cells [1] and densely populated cytoplasm mean that biological solutes and solvent display greatly slowed [2–6] or anomalous[7–9] diffusion. Thus, how these interfacial fluids differ from bulk solvent is of great importance to understanding biomolecular interactions. The dynamics of water molecules at surfaces has been extensively studied experimentally[10–12], but a simple quantitative explanation of how bulk properties could be calculated from molecular interactions has remained elusive. Experimental methods such as surface-sensitive NMR[11] have yielded a detailed picture of both collective and microscopic rotational relaxation dynamics of water around proteins[13], measuring how water molecules slow near surfaces. Ultrafast infrared pump-probe spectroscopy[14] has also made it possible to measure the spatial extent of this surface-specific slowdown. These recent experimental data thus allow measurement of the interfacial properties of water, providing an important test for any quantitative theory on how such properties arise.
Here, we show how correlated motions are a near-universal characteristic of fluids close to interfaces and how these motions lead to increased local viscosity near surfaces. We accomplish this by developing a framework for local viscosity and diffusion in terms of measures devised to describe supercooled or glass-like systems. In such systems, the presence of dynamic heterogeneity– regions of high-mobility embedded in nearly immobile or jammed surroundings–can dominate overall dynamics [15, 16]. We show that fluids at biological interfaces display a similar heterogeneity: the effective viscosity increases and decouples from diffusional motion such that local viscosity is up to four times greater than would be expected from a spatially homogeneous application of the Stokes-Einstein relation.
One important consequence of this locally increased viscosity is that protein-sized solutes diffuse approximately two-fold slower than expected from Brownian motion based on their size alone. Classically, this is corrected using the hydrodynamic radius, an empirical factor to account for the increased effective size of the particle due to locally viscous water. Here, we use the local viscosity measures that we develop to calculate protein diffusion rates from molecular details alone, quantitatively matching and eliminating the empirical correction.
Results
Dynamic heterogeneity
In order to resolve local heterogeneity, we wish to measure spatially resolved effects of surfaces. These measurements require local equivalents of the bulk diffusion constant and viscosity. To obtain these local measures, we consider a system where viscosities and diffusion constants have been extensively studied: supercooled liquids as they approach the glass transition.
One characteristic of glasses is that they exhibit heterogeneity in their dynamics. Regions of relative mobility move through an essentially immobile, jammed, environment[15]. This observation has consequences for the Stokes-Einstein relation
| (1) |
where D is a translational or rotational diffusion constant, μ is a translational or rotational hydrodynamic mobility, η is the viscosity of the fluid, kB is the Boltzmann constant, and T is the temperature. The Stokes-Einstein relation holds in fluids but is no longer homogeneously true in glasses. This breakdown of homogeneity is the result of a decoupling of two different characteristic times, one that scales with D, and one that scales with a structural relaxation time τ ∝ η[17].
This can be quantified by mapping particle motions to a continuous-time random walk[18]. This mapping is done by measuring the times of single-particle events (exchange events) which occur when a particle moves a distance d from its initial position, corresponding to a CTRW where the jump length is fixed. As shown in Fig. 1a, two times are extracted: exchange times tx between two exchange events (the random walk waiting times), and persistence times tp which start at a random time and end at the subsequent exchange event. d is a coarse-graining length often set to be equal to the distance of the first peak in the pair distribution function: a distance sufficient for particle motion to be mainly diffusive.
Fig. 1. Exchange events and local diffusion.

(a) Exchange events: persistence times tp and exchange times tx for 3 particles p1, p2 and p3, starting from an arbitrary point in time. (b) Two grid cells of size Δx with local hydrodynamic mobility μi and local per-particle diffusive flux j between the two halves.
The average exchange time 〈tx〉, the time between random walk jumps, scales with the inverse of the diffusion constant: D ∝ 〈tx〉−1. The average 〈tp〉 is the expected time for any given microscopic structure to persist and thus a measure for the structural correlation time and the viscosity[15, 17, 19, 20].
The exchange times tx and tp are clearly related: under normal bulk fluid conditions, tp and tx follow a Poisson distribution and 〈tp〉 = 〈tx〉 (cf. particle p1 in Fig. 1a).
In glassy systems, however, mobile regions coexist with an otherwise jammed system, and particle motions are correlated in time (cf. p3). This increases 〈tp〉 relative to 〈tx〉: there is a higher likelihood of starting a persistence time measurement during a long wait time. This leads to a breakdown in the relationship betwen 〈tp〉 and 〈tx〉 and therefore of the Stokes-Einstein relation D ∝ kBTη−1. Such behavior has been shown in continuous-time random walks[21], in spin models of glasses[19] and in real-space models of glassy systems[16, 20].
Localized transport properties
This relation between viscosity and persistence times holds locally. The Stokes-Einstein relation relies on the equilibrium between the diffusive driving force Jdiff of a concentration gradient due to a small applied potential, and the frictional counter-forces Jdrift it causes[22].
In spatially discretized cells of size Δx (see Fig. 1b), the drift flux Jdrift from cell i to cell i + 1 due to potential U on cell i is to first order in U:
| (2) |
where μi is the isotropic hydrodynamic friction at i, kB is the Boltzmann constant, T the temperature, is the unperturbed number of particles, is the excess number of particles due to U, and . The diffusional flux Jdiff due to the potential is
| (3) |
where j is the rate at which an individual particle diffusely crosses from cell i to cell i + 1. This rate is proportional to the inverse of the mean first-passage time of particles starting in a fixed position in cell i, crossing into cell i + 1[23], and therefore to the inverse of the persistence time
| (4) |
where the average 〈 〉x is calculated over all particles starting in the cell at location x. Balancing the fluxes of Eqs. 2 and 3 leads to an expression for relative local viscosity η(x)
| (5) |
where multiple η(x) are averaged with a harmonic mean.
Because the moments are finite, the diffusion constant at x is[21, 24]
| (6) |
The distribution of exchange events in spatially heterogeneous systems near surfaces is multimodal and may lead to decoupling of 〈tp〉 from 〈tx〉. We use the ratio 〈tp〉 / 〈tx〉 as a means to quantify this:
| (7) |
which, if not equal to 1, indicates decoupling of mean-squared displacement from viscosity.
As in studies of glasses[16], we will set the characteristic length scale d to the primary peak in the radial distribution function. At this distance, the mean-squared-displacement based diffusion constant is close to the bulk value in homogeneous fluids[25] and sets the lower limit at which continuous quantities such as η are meaningful.
Our formulation of local viscosity based on the Stokes-Einstein relation is similar to approaches used in microrheology[26]. Here, however, the probe particles are the solvent particles, and local rather than total displacements are averaged.
Measurements of waiting time distributions near surfaces have been reported before in the context of anomalous diffusion[8, 9, 27]. Here, however, we also analyze these distributions in the context of viscosity. More direct measurements of localized viscosity have been developed[28–30] which do not yield concomitant diffusion constants. Our formulation of local viscosity based on the Stokes-Einstein relation has the advantage of cleanly yielding both with a simple formalism.
Simulations
We first present calculations of diffusion-viscosity decoupling at a number of surface interfaces, followed by a comparison to experimental data on water dynamics at biomolecular surfaces. Since direct calculation of persistence and exchange times requires tracking the motion of individual solvent molecules, we have performed simulations of several fluids near a variety of surfaces: water near silica surfaces and lipid bilayers, and a Lennard-Jones particle fluid (at T = 0.75, ρ = 0.8 in reduced units[31]) near a Lennard-Jones particle surface. The silica surface has a modifiable charge strength multiplier c, ranging from a hydrophobic surface (c = 0) to a strongly hydrophilic surface (c = 1.33), similar to Ref. [32].
The localized average exchange and persistence times near these simulated surfaces are plotted in Fig. 2. These show a marked slowing of dynamics near the surface, particularly within the first hydration shell. Stokes-Einstein violations near the surface are detected as discrepancies between the persistence and exchange times. Fig. 3 summarizes the values for their ratio γ, averaged over all particles within zm + d of the surface, where zm is the location of the first maximum in the z density distribution.
Fig. 2. Near-surface viscosity and diffusion.

Localized viscosities from average persistence times 〈tp〉 (black, solid), and inverse diffusion constants from exchange times 〈tx〉 (blue, dashed), as a function of z distance (normal to the surface) for a number of simulated systems. Error bars show standard error estimates. For reference, the local density ρ(z) (in arbitrary units) is shown in gray. For the Lennard-Jones system, the distances are in units of σ.
Fig. 3. Diffusion-viscosity decoupling.

Decoupling is shown by γ > 1. Ratios are plotted as a function of surface charge on a flat silica surface, a Lennard-Jones fluid near a surface, and water on a lipid bilayer. Ratios are computed for the fluid layer close to the surface. Error bars show estimates for the standard error of the ratio means. The inset shows the same data, plotted according to (see Methods section).
It is clear that all interfaces exhibit significant diffusion-viscosity decoupling, independent of the fluid model used, although the amount varies considerably. The strength of the surface-fluid interaction strongly influences the extent of diffusion-velocity decoupling: the fully hydrophilic silica surface shows a local viscosity 4.1 times larger than expected from the local diffusion constant. These results are consistent with previous simulations on water near proteins[8, 9, 27] and particles near silica surfaces[33], with waiting time distributions and residence times comparable to our tx and tp. The viscosities[29] and diffusion constants[34] of Lennard-Jones are consistent with those previously reported for confined fluids.
The decoupling of diffusion and viscosity cannot be solely due to the occlusive effect of the surface[35]. If it were, γ would not vary with the interaction strength c. Instead, it can be understood in terms of heterogeneity in dynamics at the surface, a simple result of the heterogeneity of the surface itself and thus a general feature of liquids near surfaces. Surface properties play a role in determining the extent of this heterogeneity because more strongly-interacting surfaces create larger differences between dwell times at the surface and in the bulk. This disproportionally affects 〈tp〉 relative to〈tx〉. The origins of this decoupling can be understood purely in terms of temporal heterogeneity in particle dynamics induced by the surface itself, and therefore has a spatial extent dominated by range of the layering in the density profile ρ(z), and replaces that of the mobile regions in glasses. This measurement and insight are readily provided by an analysis of water molecule persistence and exchange times.
Experimental evidence
While local persistence and exchange times are not experimentally observable at molecular resolution, we present comparisons to data from several spectroscopic techniques that have enabled the measurement of solvent dynamics close to surfaces. Recent experiments have mostly used NMR techniques[11, 13, 36] or time-resolved IR spectroscopy[14, 37]. Such methods involve the monitoring of relaxation from an initial state at a random time, and therefore measure quantities that scale with persistence times.
Ultrafast infrared pump-probe experiments of interfacial water in reverse micelles yield collective relaxation times of approximately 18 ps near the surface of large micelles[14, 37]. This slow region extends about 1.25 nm from the micelle surface[14]. Both the relaxation times and the spatial extent of slowed relaxation are in good agreement with our predictions for lipid bilayers (21 ps extending to roughly 1.5 nm, see Fig. 2).
The rotational decorrelation time of water molecules near a protein surface can be measured with NMR experiments. With magnetic relaxation dispersion (MRD) measurements it is possible to obtain a distribution of relaxation times, giving a range of times 10 – 50 ps[11, 36]. Experiments using the Nuclear Overhauser effect can be sensitive to individual parts of a protein surface[13] and give times comparable to MRD measurements[11], but with significant variation along the protein surface. These results agree closely with our estimates for 〈tp〉. Figure 4 shows γ as a function of the measured 〈tp〉 for ubuquitin in our simulations. The striking heterogeneity of the surface dynamics reported in Ref. [13] can be visualized via a surface map of the local persistence times of lysozyme.
Fig. 4. Locally varying near-surface viscosity.
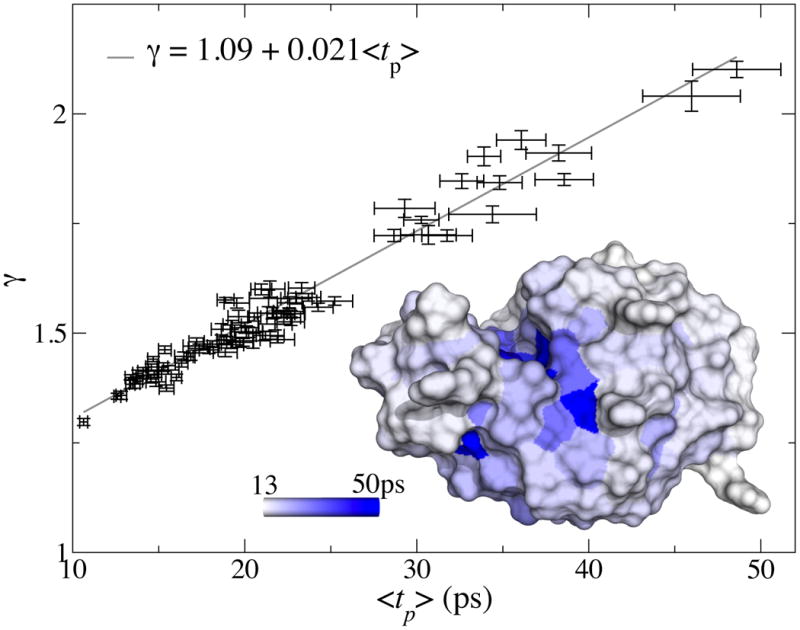
Local persistence times 〈tp〉 versus decoupling ratio γ, of water molecules close to the surface of the protein ubiquitin. The correlation coefficient between the two is 0.97; the persistence times are for water molecules within 0.85 nm from the nearest atom, and averaged per residue. Error bars show standard error estimates. Inset: local persistence time 〈tp〉 mapped onto the surface of lysozyme.
Calculating the hydrodynamic radius
The full power of the dynamic heterogeneity approach becomes apparent for more complex systems such as the diffusion rates of biomolecules. Proteins present a surface that is both irregular and non-uniformly interacting with solvent. As a result, measured diffusion coefficients for globular proteins are approximately two-fold slower than expected from their size alone[36]. The hydrodynamic radius empirically accounts for surface effects and water viscosity, and methods have been developed to approximate hydrodynamic radii, typically by empirically adding a constant shell distance, the hydrodynamic correction, to each atomic radius with or without an additional viscous drag term [36, 38]. Translational and rotational diffusion coefficents calculated via these methods are typically within 5% for small globular proteins.
We have used MD simulations of water at the surface of proteins to calculate local viscosities (see Fig 5) and thus derive hydrodynamic correction factors and rotational diffusion coefficients. Results are shown in table I with additional details given in the Methods section. The hydrodynamic correction factors calculated from local viscosities yield effective atomic radii of σh = 0.286 to 0.298nm, which agree to within error with the empirical values of 0.29 to 0.30nm [36, 38] that are typically used. Our results show that dynamic heterogeneity and local viscosity calculations can yield a quantitative explanation for how water interacts with biomolecular surfaces, sufficient to reproduce experimental measurements based on molecular details alone, without including empirical correction factors.
Fig. 5. Mobility decrease near proteins.

Inverse relative viscosity as a function of distance from the protein center of mass for 4 proteins calculated from simulation. The arrows locate the bare radius R of the proteins, the lines are fits to a sigmoid function, used for integration of values r > R.
Table I. Hydrodynamic radius calculation for 4 proteins.
Relative hydrodynamic mobility μr/μr,0 and rigid equivalent solvation layer thickness (σS) for four proteins of different sizes (as indicated by the molar mass M), calculated from MD simulations. Also shown are the rotational diffusion constant based on the Stokes-Einstein relation and radii shown in Fig. 5, the experimentally obtained rotational diffusion constant , and the diffusion constant calculated with Hydropro[38], based on the values for σs obtained for each protein.
| PDB | M(kg/mol) | μr/μr,0 | σs(nm) |
|
|
|
|||
|---|---|---|---|---|---|---|---|---|---|
| 1ubq | 8.55 | 0.68 | 0.100 | 65.0 | 34.6 | 30.8 | |||
| 1a1x | 12.60 | 0.71 | 0.100 | 44.1 | 17.0 | 20.0 | |||
| 6lyz | 14.30 | 0.73 | 0.089 | 38.8 | 20.2 | 21.2 | |||
| 1svn | 26.68 | 0.74 | 0.101 | 20.8 | 13.5 | 12.9 |
Discussion
We have used methods from theories of glassy systems to show that interfacial solvent dynamics can be simply explained from the general phenomenon of heterogeneous particle dynamics near a surface. Although fluids near a surface are not themselves glassy, the presence of a surface causes heterogeneous dynamics. These heterogeneous dynamics can be measured using particle persistence and exchange times and manifest as a greater decrease in diffusion coefficient than in viscosity, leading to diffusion-viscosity decoupling and the well-described phenomenon of ”anomalous” diffusion near a surface.
Measurements of persistence and exchange times at using simulations of water at biomolecular surfaces yield solvent dynamics that agree well with available spectroscopic data. Since the diffusion-viscosity decoupling caused by a surface is much milder than that in glasses, the quantitative agreement between our results and experimental measurements of water motion near surfaces actually serves as a more robust test of the persistence/exchange time theory than the massive effects observed in glasses. However, since we show that altered solvent dynamics arise from spatial heterogeneity among solvent molecules, we propose that the optimal test of our theory and also the fullest description of solvent dynamics would be experimental measurement of the full spatial distribution of relaxation times rather than average values.
Using persistence and exchange times, we can also simply and accurately measure local viscosity near proteins and thus predict their diffusion coefficients without commonly-used empirical correction factors. Proteins present a challenging case because they are irregular both in shape and atomic composition, yielding a variably-interacting surface. Our application of glass-former theory and resulting measurements yield what we believe is the first purely molecular explanation for the hydrodynamic radius.
Methods
Simulations
All simulations were performed with Gromacs 4.5[39], with constant temperature maintained using the v-rescale thermostat[40]. Long-range electrostatics were calculated using Particle-Mesh Ewald[41, 42], and co-valent bond-lengths were constrained using LINCS[43]. The time steps were 2fs for the silica system and 4fs for the lipid bilayer. Simulations were run to 10ns, several times the longest tx, to ensure well-converged averaging of its mean.
The silica surface was taken from Ref. [44]; surface partial charges were varied to test the electrostatic influence on surface-driven heterogeneity, in a way similar to Ref. [32]. Using a simple multiplier c, the surface charge was varied in different simulations according to q = −0.71c for the Si atoms, q = 0.40c for the O atoms, and q = 0.31c for the H atoms. This allowed us to probe a range of surface types: zero charge (c = 0), corresponding to an almost fully hydrophobic surface, c = 1, the original silica surface, and c = 1.33, corresponding to a strongly hydrophilic surface similar to a salt crystal.
Each silica interface simulation consisted of two silica surfaces with a normal perpendicular to the z direction in a 5.9 × 5.1 nm hexagonal simulation box, where only the x and y directions are periodically replicated. The two surfaces were pulled towards each other with a force corresponding to a hydrostatic pressure of 1 bar. A total of 9216 water molecules were placed between the two surfaces with random starting velocities corresponding to a temperature of 298K.
The Lennard-Jones system used similar parameters (with charges set to 0), with Lennard-Jones parameters corresponding to a reduced temperature of T = 0.75, and a reduced density of ρ = 0.8, well within the liquid range of the phase diagram[31].
The lipid bilayer system consisted of 256 POPC molecules in an x,y,z- periodic box with 32768 TIP3P water molecules. The lipid force field was taken from [45] and the bilayer coordinates from [46]. These simulations were run at 303K with Parinello-Rahman[47] pressure coupling at 1 bar, resulting in a stable, fluid bilayer.
The protein systems had initial coordinates taken from the PDB structures indicated in table I. These were positioned in a truncated dodecahedral simulation box spaced so that the protein is at least 2nm away from any box edge, and solvated with SPC/E water, while the protein used the Amber03[48] force field. The total number of water molecules ranges from 14345 ubiquitin (1ubq) to 16657 for savinase (1svn). The total system charge was kept neutral by adding Na+ or Cl− ions.
Moments of the exchange time distribution
For lattice systems, persistence times can be expressed as ratios of moments of the exchange times[18–20]:
| (8) |
which, specifically for first-order persistence and exchange times is simply
| (9) |
which can clearly be seen to hold in the simulated systems in the inset of Fig. 3.
Intuitively, one could picture the molecules of the fluid being slowed down by the presence of the immobile surface, or part of a more bulk fluid-like, mobile region, which has consequences for the distributions of persistence and exchange times. The decoupling can be understood as follows: when a mixture of multiple types of mobility leads to a distribution of exchange times tx that is wider than that of the bulk, the heterogeneity in exchange times influences the average exchange time 〈tx〉, but has a much greater effect on the persistence time 〈tp〉.
Calculating the hydrodynamic radius
The rotational hydrodynamic mobility μr of a spherical object in a fluid with radially varying viscosity η(r) can be expressed as
| (10) |
where R is the radius of the solute[49]. In the case of η(r) = η0, where there is no enhanced viscosity in the protein's neighborhood, this leads to the familiar expression The relative hydrodynamic mobility μr/μr,0 is
| (11) |
and depends on the the inverse relative viscosity η0/η (r).
Using simulations, we can directly calculate this relative viscosity as a function of location. By measuring the average 〈tp〉 as a function of r, the distance to the center of mass of the protein, we can calculate the relative inverse viscosity η0/η(r). These viscosities are shown in Fig. 5.
Table I shows the relative hydrodynamic mobility for the systems of Fig. 5. These were obtained by fitting the measured values for η0/η(r) to a sigmoid function η0/η (r) ≈ (1 + e−b(r−a))−1, which yields an excellent fit for r > R in all cases (shown in Fig. 5). This fitted function was then used to numerically integrate Eq. 11 over R < r < ∞.
From the relative mobility, the value of σs can be calculated following the procedure outlined in Ref. [36], which partially accounts for the non-spherical shape of proteins.
Acknowledgments
This work was supported by ERC award 209825 to E.L., NIGMS award GM098304 to P.K., a STINT institutional grant, and the Swedish Vetenskapsrådet and Foundation for Strategic Research. Computational resources were provided by the Swedish National Infrastructure for Computing.
Footnotes
AUTHOR CONTRIBUTIONS: S.P and P.M.K. designed the research. S.P. carried out simulations. All authors contributed to the analysis and discussion of the data and writing the manuscript.
ADDITIONAL INFORMATION
Competing Financial Interests: The authors declare no competing financial interests.
References
- 1.Weibel ER, Stäubli W, Gnägi HR, Hess FA. Correlated morphometric and biochemical studies on the liver cell. i. morphometric model, stereologic methods, and normal morphometric data for rat liver. J Cell Biol. 1969;42:68–91. doi: 10.1083/jcb.42.1.68. [DOI] [PMC free article] [PubMed] [Google Scholar]
- 2.Swaminathan R, Bicknese S, Periasamy N, Verkman AS. Cytoplasmic viscosity near the cell plasma membrane: translational diffusion of a small fluorescent solute measured by total internal reflection-fluorescence photobleaching recovery. Biophys J. 1996;71:1140–1151. doi: 10.1016/S0006-3495(96)79316-5. [DOI] [PMC free article] [PubMed] [Google Scholar]
- 3.Luby-Phelps K. Physical properties of cytoplasm. Curr Opin Cell Biol. 1994;6:3–9. doi: 10.1016/0955-0674(94)90109-0. [DOI] [PubMed] [Google Scholar]
- 4.Mastro AM, Babich MA, Taylor WD, Keith AD. Diffusion of a small molecule in the cytoplasm of mammalian cells. P Natl Acad Sci USA. 1984;81:3414–3418. doi: 10.1073/pnas.81.11.3414. [DOI] [PMC free article] [PubMed] [Google Scholar]
- 5.Verkman AS. Solute and macromolecule diffusion in cellular aqueous compartments. Trends Biochem Sci. 2002;27:27–33. doi: 10.1016/s0968-0004(01)02003-5. [DOI] [PubMed] [Google Scholar]
- 6.Ando T, Skolnick J. Crowding and hydrodynamic interactions likely dominate in vivo macromolecular motion. P Natl Acad Sci USA. 2010;107:18457–18462. doi: 10.1073/pnas.1011354107. [DOI] [PMC free article] [PubMed] [Google Scholar]
- 7.Saxton MJ, Jacobson K. Single-particle tracking: applications to membrane dynamics. Annu Rev Biophys Biomol Struct. 1997;26:373–399. doi: 10.1146/annurev.biophys.26.1.373. [DOI] [PubMed] [Google Scholar]
- 8.Bizzarri A. Origin of the anomalous diffusion observed by md simulation at the protein-water interface. Chem Phys Lett. 1996;263:559–566. [Google Scholar]
- 9.Sterpone F, Stirnemann G, Laage D. Magnitude and molecular origin of water slowdown next to a protein. J Am Chem Soc. 2012;134:4116–4119. doi: 10.1021/ja3007897. [DOI] [PubMed] [Google Scholar]
- 10.Kuntz ID, Kauzmann W. Hydration of proteins and polypeptides. Adv Protein Chem. 1974;28:239–345. doi: 10.1016/s0065-3233(08)60232-6. [DOI] [PubMed] [Google Scholar]
- 11.Halle B. Protein hydration dynamics in solution: a critical survey. Philos T Roy Soc B. 2004;359:1207–1224. doi: 10.1098/rstb.2004.1499. [DOI] [PMC free article] [PubMed] [Google Scholar]
- 12.Bagchi B. Water dynamics in the hydration layer around proteins and micelles. Chem Rev. 2005;105:3197–219. doi: 10.1021/cr020661+. [DOI] [PubMed] [Google Scholar]
- 13.Nucci NV, Pometun MS, Wand AJ. Mapping the hydration dynamics of ubiquitin. J Am Chem Soc. 2011;133:12326–12329. doi: 10.1021/ja202033k. [DOI] [PMC free article] [PubMed] [Google Scholar]
- 14.Fayer MD, Levinger NE. Analysis of water in confined geometries and at interfaces. Annu Rev Anal Chem. 2010;3:89–107. doi: 10.1146/annurev-anchem-070109-103410. [DOI] [PubMed] [Google Scholar]
- 15.Chandler D, Garrahan JP. Dynamics on the way to forming glass: bubbles in space-time. Annu Rev Phys Chem. 2010;61:191–217. doi: 10.1146/annurev.physchem.040808.090405. [DOI] [PubMed] [Google Scholar]
- 16.Hedges LO, Maibaum L, Chandler D, Garrahan JP. Decoupling of exchange and persistence times in atomistic models of glass formers. J Chem Phys. 2007;127:211101. doi: 10.1063/1.2803062. [DOI] [PubMed] [Google Scholar]
- 17.Chen SH, et al. The violation of the stokes-einstein relation in supercooled water. P Natl Acad Sci USA. 2006;103:12974–12978. doi: 10.1073/pnas.0603253103. [DOI] [PMC free article] [PubMed] [Google Scholar]
- 18.Montroll EW, Weiss GH. Random walks on lattices. ii. J Mat Phys. 1965;6:167–181. [Google Scholar]
- 19.Jung Y, Garrahan JP, Chandler D. Dynamical exchanges in facilitated models of supercooled liquids. J Chem Phys. 2005;123:084509. doi: 10.1063/1.2001629. [DOI] [PubMed] [Google Scholar]
- 20.Rubner O, Heuer A. From elementary steps to structural relaxation: A continuous-time random-walk analysis of a supercooled liquid. Phys Rev E. 2008;78:011504. doi: 10.1103/PhysRevE.78.011504. [DOI] [PubMed] [Google Scholar]
- 21.Metzler R, Klafter J. The random walk's guide to anomalous diffusion: a fractional dynamics approach. Phys Rep. 2000;339:1–77. [Google Scholar]
- 22.Einstein A. Über die von der molekularkinetischen the-orie der wärme geforderte bewegung von in ruhenden flüssigkeiten suspendierten teilchen. Ann Phys. 1905;322:549–560. [Google Scholar]
- 23.Reimann P, Schmid GJ, Hänggi P. Universal equivalence of mean first-passage time and kramers rate. Phys Rev E. 1999;60:R1–4. doi: 10.1103/physreve.60.r1. [DOI] [PubMed] [Google Scholar]
- 24.Bettin R, Mannella R, West B, Grigolini P. Influence of the environment on anomalous diffusion. Phys Rev E. 1995;51:212–219. doi: 10.1103/physreve.51.212. [DOI] [PubMed] [Google Scholar]
- 25.Medina-Noyola M. Long-time self-diffusion in concentrated colloidal dispersions. Phys Rev Lett. 1988;60:2705–2708. doi: 10.1103/PhysRevLett.60.2705. [DOI] [PubMed] [Google Scholar]
- 26.Squires TM, Mason TG. Fluid mechanics of microrheology. Annu Rev Fluid Mech. 2010;42:413–438. [Google Scholar]
- 27.Pizzitutti F, Marchi M, Sterpone F, Rossky PJ. How protein surfaces induce anomalous dynamics of hydration water. J Phys Chem B. 2007;111:7584–7590. doi: 10.1021/jp0717185. [DOI] [PubMed] [Google Scholar]
- 28.Bitsanis I, Vanderlick TK, Tirrell M, Davis HT. A tractable molecular theory of flow in strongly inhomo-geneous fluids. J Chem Phys. 1988;89:3152–3162. [Google Scholar]
- 29.Pozhar LA. Structure and dynamics of nanofluids: Theory and simulations to calculate viscosity. Phys Rev E. 2000;61:1432–1446. doi: 10.1103/physreve.61.1432. [DOI] [PubMed] [Google Scholar]
- 30.Hoang H, Galliero G. Local viscosity of a fluid confined in a narrow pore. Phys Rev E. 2012;86:21202. doi: 10.1103/PhysRevE.86.021202. [DOI] [PubMed] [Google Scholar]
- 31.Hansen JP, Verlet L. Phase transitions of the lennard-jones system. Phys Rev. 1969;184:151–184. [Google Scholar]
- 32.Castrillón SRV, Giovambattista N, Aksay IA, Debenedetti PG. Evolution from surface-influenced to bulk-like dynamics in nanoscopically confined water. J Phys Chem B. 2009;113:7973–7976. doi: 10.1021/jp9025392. [DOI] [PubMed] [Google Scholar]
- 33.Castrillón SRV, Giovambattista N, Aksay IA, Debenedetti PG. Effect of surface polarity on the structure and dynamics of water in nanoscale confinement. J Phys Chem B. 2009;113:1438–1446. doi: 10.1021/jp809032n. [DOI] [PubMed] [Google Scholar]
- 34.Krekelberg WP, Shen VK, Errington JR, Truskett TM. Impact of surface roughness on diffusion of confined fluids. J Chem Phys. 2011;135:154502. doi: 10.1063/1.3651478. [DOI] [PubMed] [Google Scholar]
- 35.Lindahl E, Edholm O. Solvent diffusion outside macromolecular surfaces. Phys Rev E. 1998;57:791–796. [Google Scholar]
- 36.Halle B, Davidovic M. Biomolecular hydration: from water dynamics to hydrodynamics. P Natl Acad Sci USA. 2003;100:12135–12140. doi: 10.1073/pnas.2033320100. [DOI] [PMC free article] [PubMed] [Google Scholar]
- 37.Moilanen DE, Levinger NE, Spry DB, Fayer MD. Confinement or the nature of the interface? dynamics of nanoscopic water. J Am Chem Soc. 2007;129:14311–14318. doi: 10.1021/ja073977d. [DOI] [PMC free article] [PubMed] [Google Scholar]
- 38.Ortega A, Amorós D, de La Torre JG. Prediction of hydrodynamic and other solution properties of rigid proteins from atomic- and residue-level models. Biophys J. 2011;101:892–898. doi: 10.1016/j.bpj.2011.06.046. [DOI] [PMC free article] [PubMed] [Google Scholar]
- 39.Pronk S, et al. Gromacs 4.5: a high-throughput and highly parallel open source molecular simulation toolkit. Bioinformatics. 2013;29:845–854. doi: 10.1093/bioinformatics/btt055. [DOI] [PMC free article] [PubMed] [Google Scholar]
- 40.Bussi G, Donadio D, Parrinello M. Canonical sampling through velocity rescaling. J Chem Phys. 2007;126:014101. doi: 10.1063/1.2408420. [DOI] [PubMed] [Google Scholar]
- 41.Essmann U, et al. A smooth particle mesh ewald method. J Chem Phys. 1995;103:8577–8593. [Google Scholar]
- 42.Yeh Y, Mou C. Orientational relaxation dynamics of liquid water studied by molecular dynamics simulation. J Phys Chem B. 1999;103:3699–3705. [Google Scholar]
- 43.Hess B. P-lincs: A parallel linear constraint solver for molecular simulation. J Chem Theory Comput. 2008;4:116–122. doi: 10.1021/ct700200b. [DOI] [PubMed] [Google Scholar]
- 44.Lee SH, Rossky PJ. A comparison of the structure and dynamics of liquid water at hydrophobic and hydrophilic surfaces–a molecular dynamics simulation study. J Chem Phys. 1994;100:3334–3345. [Google Scholar]
- 45.Berger O, Edholm O, Jähnig F. Molecular dynamics simulations of a fluid bilayer of dipalmitoylphosphatidyl-choline at full hydration, constant pressure, and constant temperature. Biophys J. 1997;72:2002–2013. doi: 10.1016/S0006-3495(97)78845-3. [DOI] [PMC free article] [PubMed] [Google Scholar]
- 46.Kasson PM, Lindahl E, Pande VS. Atomic-resolution simulations predict a transition state for vesicle fusion defined by contact of a few lipid tails. PLoS Comp Biol. 2010;6:e1000829. doi: 10.1371/journal.pcbi.1000829. [DOI] [PMC free article] [PubMed] [Google Scholar]
- 47.Parrinello M, Rahman A. Polymorphic transitions in single crystals: A new molecular dynamics method. J Appl Phys. 1981;52:7182–7190. [Google Scholar]
- 48.Duan Y, et al. A pointcharge force field for molecular mechanics simulations of proteins based on condensed-phase quantum mechanical calculations. J Comp Chem. 2003;24:1999–2012. doi: 10.1002/jcc.10349. [DOI] [PubMed] [Google Scholar]
- 49.Brilliantov N, Krapivsky P. Stokes laws for ions in solutions with ion-induced inhomogeneity. J Chem Phys. 1991;95:6055–6057. [Google Scholar]