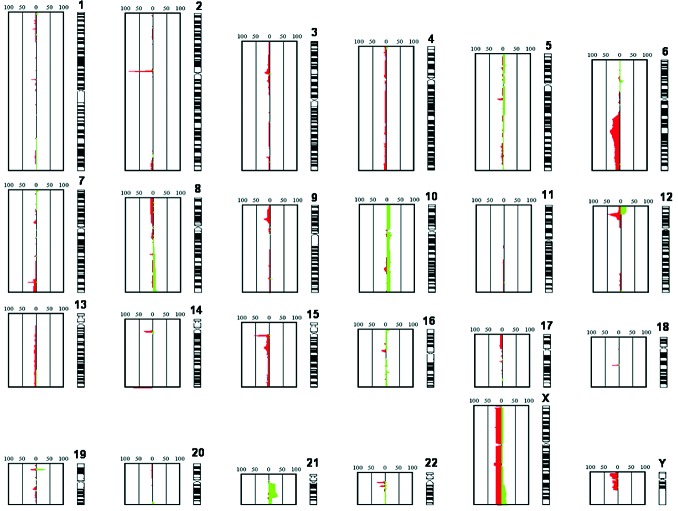
Figure 1.
Summation of the total of identified CNA in 51 ETV6/RUNX1-positive ALL relapses. The figure shows the relative frequency of CNA identified in all the investigated relapses. Copy number losses are indicated in red, copy number gains in green. The numbering 0-50-100 indicates the number of relapses showing the CNA. The diagram is based on an automatic readout of the array CGH data without a correction of the data regarding copy number variants.

