Abstract
Prostate cancer, one of the most lethal forms of urinary system cancer, remains resistant to currently available treatments. Therefore, novel mechanism and target-based approaches are needed for the management of this neoplasm. PI3K/AKT signaling pathway activation correlates with human prostate cancer progression and metastasis. However, the role of mTOR in prostate cancer is not well-established. Here, we demonstrate that mTOR is over-expressed in both clinical tissue specimens and cultured human prostate cancer cells when compared to normal prostate tissues, respectively. Further, mTOR gene knockdown via lentivirus mediated mTOR specific shRNA resulted in a significant decrease in the viability and growth of prostate cancer cells without affecting normal human prostate cells. In addition, mTOR inhibition resulted in a significant i) decrease in 4EBP1, S6K, PI3K and AKT protein, ii) increase in PARP protein of prostate cancer cells. Most importantly, mTOR inhibition triggered apoptosis and suppressed pancreatic carcinoma growth in vivo in a mouse xenograft model. We suggest that targeting of mTOR may be a viable approach for the treatment of prostate cancer.
Keywords: mTOR, prostatic carcinoma, apoptosis
Introduction
Prostate cancer (PCa) is the most frequently diagnosed non-cutaneous malignancy and the second leading cause of death due to cancer in men in the world [1]. Treatment options for localized disease include watchful waiting, surgery, and radiotherapy [2]. In the context of definitive treatment, despite advances in systemic chemotherapy, only small improvements in the quality of life and overall survival (OS) have been achieved for patients carrying PCa.
Efforts are now being directed at developing molecular targeting agents. Mammalian targets of rapamycin (mTOR) is a member of the PI3-kinase-related protein kinase (PIKK) family that plays a critical role in the regulation of cell homeostasis in response to various upstream stimuli such as growth factors, nutrients and ER stress [3-5]. The mammalian target of rapamycin (mTOR), an evolutionarily conserved serine/threonine protein kinase, integrates both intracellular and extracellular signals and serves as a central regulator of cell metabolism, growth, proliferation, survival, and autophagy in the biological process [6,7]. In mammalian cells, mTOR forms two structurally and functionally distinct complexes, namely mTORC1 and mTORC2, which differ in subunit compositions and biological functions [8,9]. mTORC1 consists of mTOR, Raptor, mLST8/GβL, PRAS40, and DEPTOR, whereas mTORC2 is also the composed of mTOR, Rictor, GβL, Protor, Sin1, and DEPTOR [6,7]. It is well known that mTORC1 mainly promotes protein translation and cell growth by phosphorylating S6K1 and 4E-BP1, whereas mTORC2 regulates cytoskeletal organization [10] as well as cell survival through directly phosphorylating and activating AKT [8,9].
Viruses have been known to utilize various cellular signaling pathways to achieve successful infection and replication [11]. The application of viruses in the gene therapy field was universal and helpful for treatment of virous diseases, containing cancers. Viruses containing small interference RNA for the target genes were the most useful tools. RNA interference (RNAi) is one of the natural ways of gene regulation that utilizes small interfering RNA (siRNA) for functional suppression of specific mRNAs in the transcriptional level. Introduction into cells of siRNA specific for particular mRNA has become a widespread tool in reverse genetics biology and for functional characterization of genes. The most straightforward approach is to introduce into cells or organisms siRNA oligonucleotides as it produces quick and robust suppression of a particular mRNA [12]. However, the effect is transient and does not allow stable inhibition of the targeting gene function. Expression of small hairpin RNAs (shRNAs), which are recognized by the RNAi machinery and processed into active siRNA, has become a preferable approach in the gene function research field. It allows stable suppression of functions not only in cell culture in vitro, but also in animals in vivo [13]. Lentiviral vectors are currently the most appealing tool for efficient delivery and stable expression of genes in almost all cell types [14]. This is why the development of convenient lentiviral vectors for expression of shRNAs is important for successful application of RNAi based technologies both in research, and in practical fields.
In the present research, we used antibodies against the mTOR protein to detect the prostate cancer tissue and the normal cancer tissue to ascertain the expression level of mTOR at first. Then we detected the mTOR expression in the prostate cancer and prostate normal cells. After detecting, we constructed a recombinant shRNA-expressing lentiviral vector targeting mTOR, and observed the effects of mTOR downregulation on the growth and apoptosis of prostate cancer cells in vitro. To reveal the possible mechanism, we also showed the effects of mTOR shRNA on the expression of 4EBP1, S6K, PI3K, AKT and PARP in C4-2B cells in vitro. mTOR inhibition triggered apoptosis and suppressed pancreatic carcinoma growth in vivo in a mouse xenograft model.
Materials and methods
Immunohistochemistry
Paraffin embedded human prostate cancer and normal prostate tissue was obtained from Biomax USA (Rockville, MD). The tissue was deparaffinized with xylenes and ethanol series and antigen retrieval performed by heating in 1 mM EDTA (pH 8.0) at 85°C. Slides were blocked in 10% normal goat serum (Caltag, CA) in PBS for 1 hour at room temperature followed by incubation with mTOR antibody (Abcam) or IgG control anti-sera (Abcam) diluted 1:100 in 10% normal goat serum in PBS overnight at 4°C in a humidified chamber. The following day, slides were incubated with biotin conjugated secondary antibody (Invitrogen, CA) (1:100 in blocking buffer) and then fresh ABC-Alkaline Phosphatase reagent (Vector Labs, CA) for 1 h each at room temperature in a humidified chamber. Tissues were then washed with PBS then exposed to fresh Vector Red reagent (Vector Labs, CA) for 20 minutes. Tissues were then counterstained with hematoxylin, dehydrated with ethanol and xylenes and mounted. The images were obtained with a digital camera (model 14.2 color Mosaic, Diagnostic Instruments, Inc., MI). Positive cells were quantified by counting the mTOR positive (brown) cells and the total number of cells in 10 arbitrarily selected fields at × 400 magnifications by an independent observer. The mTOR index was calculated as: the number of mTOR positive cells/the total cell count × 100%.
Cell culture and reagents
Human prostate cancer RWPE1, LNCap, PC-3, PC-3m, C4-2, C4-2B and MCF-7 cells were obtained from the American Type Culture Collection (Manassas, VA). Cells were routinely maintained in Dulbecco’s Modified Eagle Medium (DMEM, Gibco) with 10% fetal bovine serum (FBS) and 2 mM L-glutamine. Cultures were maintained in a humidified incubator at 37°C with 5% CO2. Antibodies against mTOR, 4EBP1, S6K, PI3K, AKT, and GAPDH were purchased from BD Biosciences (San Jose, CA). Secondary antibodies against primary antibodies were purchased from Santa Cruz Biotechnology (Santa Cruz, CA). Chemicals were from Sigma unless otherwise indicated.
Western blotting
Whole-cell lysate (20-40 μg) was resolved by SDS-PAGE and then transferred onto PVDF membranes. PVDF membranes were washed briefly in Tris-buffered saline and 0.1% Tween-20 (TBST) and blocked in a solution of TBST containing 5% nonfat dry milk for 15 min with constant agitation. After blocking, the PVDF membrane was incubated with the following primary antibodies overnight at 4°C: mouse monoclonal mTOR (1:500 dilution in TBST), 4EBP1 (1:800 dilution in TBST), S6K (1:1,000 dilution in TBST), PI3K (1:500 dilution in TBST), AKT (1:1,000 dilution in TBST), (1:500 dilution in TBST) and GAPDH (1:2,000 dilution in TBST) antibody. Membranes were washed in TBST (3 times for 15 min) and were incubated for 1 h with horseradish peroxidase-conjugated secondary antibodies at a 1:10,000 dilution at room temperature with constant agitation before enhanced chemiluminescence (Amersham Biosciences, NJ) and exposure to film.
RNA isolation, RT-PCR, and real-time PCR
Total RNA from RWPE1, LNCap, PC-3, PC-3m, C4-2, C4-2B and MCF-7 cells was isolated with Trizol reagent (Invitrogen, Carlsbad, CA) as described by the manufacturer. 1 μg of total RNA was used in reverse transcription reactions with Moloney murine leukemia virus (MMLV) reverse transcriptase and oligo (dT)15 primer (Promega, Madison, WI) as described by the manufacturer. 2 μL of the resulting total cDNA was then used as the template in PCR to measure the mRNA level of interest, using designed primers: for mTOR, forward, 5’- ACTCGCTTCTATGACCAACTGA-3’; reverse, 5’-TTTCCATGACAACTGGGTCATTG-3’. These will give an 193-bp band. For GAPDH: forward, 5’-CAGAGCAAGAGAGGCATCCT-3’ reverse, 5’-TTGAAGGTCTCAAACATGAT-3’. These will give a 200-bp band. The reactions were performed at 94°C for denaturation, 58°C for annealing, and 72°C for extension for 30 cycles. For real-time PCR, SYBR green methods were employed according to the manufacturer’s protocol. The expression value was normalized to GAPDH. Relative gene expression was determined by assigning the control a relative value of 1.0, with all other values expressed relative to the control.
Lentivirus-mediated knockdown mTOR expression
In brief, the mTOR mRNA region AGC CTA TTC TGA AGG CAT TAA T was targeted by shRNA. The shRNA expressing cassette was ligated into pCMV-RFP-U6 vector for expressing shRNA. Virus preparation was performed as described [13]. Briefly, the shRNA expressing vector pCMV-RFP-U6-simTOR was co-transfected by liperfectin 2000-mediated transfection with packaging vectors pDMG, pMDLg/pRRE and pRSV-REV into HEK293T cells. Lentiviruses in the culture media were concentrated by centrifugation, and resuspended in HBSS buffer. The virus aliquots were frozen and kept in 70°C freezer for future use. The concentrated viruses were used to infect target cells. For virus infection, about 3,000 cells were seeded on each well in 24-well plate, after 24 h, the medium was removed. The concentrated virus in 2 ml of growth medium was added to the cells. After incubation at 37°C for 24 h, the cells were cultured in fresh growth medium for another 24-48 h, after which, the cells were expanded to grow on larger plates.
MTT assay
The effect of lentivirus mediated mTOR interference was determined based on cytotoxicity to the human prostate cancer cell line using an MTT assay. Briefly, cells were seeded in 96-well tissue culture plates at a density of 5 × 10³ cells/well and then treated with the concentrated virus to the growth medium. The following day, the medium was removed, and 100 μL of fresh medium containing 0.5 mg/mL MTT was added to each well. The cells were incubated at 37°C in humidified 5% CO2 atmosphere for 4 h, followed by the addition of 150 μL of solubilization solution (0.01 mol/L HCl in 100 g/L sodium dodecyl [SDS]) to each well, and the incubation of cells for a further 10 min at 37°C with gentle shaking. The optical density of the plates was measured using the spectrophotometrical absorbance at 570 nm in the Microplate Reader Model 550 (BIO-RAD; CA, USA).
Colony formation
Cells were plated at a density of 3.0 × 10³ in 6-well plates. Twenty-four hours later cells were treated with lentivirus mediated mTOR shRNA. Cells treated with shRNA had media removed and replaced with normal cell media every three days with no further selection or treatment. Cells were then stained after the two week treatment regimen with 0.1% crystal violet diluted in water and methanol (2:2:1 ratio), washed with PBS and air-dried. The pictures were captured with a digital camera.
Xenograft mouse model
1 × 10⁶ C4-2b cells were s.c. inoculated at right flank of 6-wk-old female nude mice (Shaihai Laboratories). In the tumor model, treatment started 1 week after tumor cell inoculation by daily intratumoral injection of PBS, LV-shCON and LV-shmTOR for 10 d. Tumor size was assessed every other day by caliper; the tumor volume was calculated according to the formula: 0.5 × W × L × L (L, length; W, width). At the end of the experiment, tumors were recovered for histologic and pathologic analysis. Tumor tissue was analyzed by immunohistochemistry. Animal experiments were performed in accordance with relevant institutional and national regulations; research protocols were approved by relevant authorities.
In situ detection of apoptotic cells
The methodology has been described in the immunohistochemistry method. Tumor sections were stained with TUNEL agent (Roche, Shanghai, China). The apoptosis was evaluated by counting the positive cells (brown-stained), as well as the total number of cells in 10 arbitrarily selected fields at × 400 magnification by an independent observer. The apoptotic index was calculated as: the number of apoptotic cells/total number of nucleated cells × 100%.
Statistical analysis
Assays were set up in triplicates and the results were presented as mean ± S.D. Variance between the experimental groups were determined by two-tailed t-test. P<0.05 was considered statistically significant.
Results
mTOR is over-expressed in human prostate cancer tissues versus normal ones
As a first step of our study, employing a human tissue containing prostate normal and cancer samples, we determined the expression pattern of mTOR in clinical human prostate cancer samples. The tissue consisted of tumor samples mostly arising from the prostate cancer patients. We found that prostate cancer samples showed strong immunostaining of mTOR compared to normal prostate cells, representative images of both prostate cancer and normal are shown in Figure 1. We found that mTOR is significantly over-expressed in prostate cancer.
Figure 1.
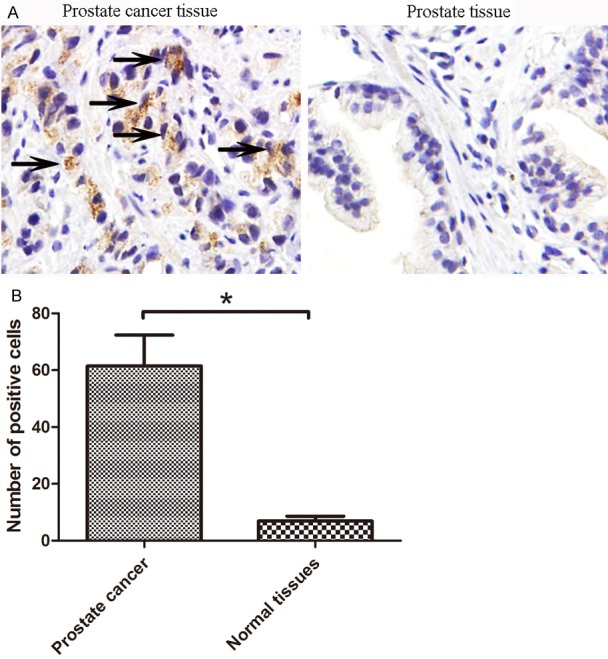
mTOR is over-expressed in human prostate cancer tissues compared to normal tissue samples. A: Immunohistochemical staining of mTOR. A tissue was stained for mTOR; B: Quantitation of mTOR immunostaining. Numbers of positive cells were counted for mTOR staining. Tissue types were grouped. The groups were compared using a 2-tailed Fisher’s exact test with a p-value of 0.05 and was therefore considered statistically significant (*). Black arrowhead stands for the positive mTOR staining.
mTOR is over-expressed in prostate cancer cells and is required for their growth
To understand the role of mTOR in prostate cancer, we determined its expression profile in five prostate cancer cell lines (LNCap, PC-3, PC-3m, C4-2, C4-2B) compared to normal human prostate cell (RWPE1) and the positive cancer cell MCF-7. Our data demonstrated that compared to the RWPE1, mTOR mRNA as well as protein is significantly over-expressed in prostate cancer cells, albeit at different levels in different prostate cancer cell lines (Figure 2A-C). Using quantitative real time RT-PCR, we found mTOR mRNA expressed in prostate cancer cells at 5- to 20- fold higher versus RWPE1 (Figure 2A). A similar pattern was observed at the protein level with mTOR protein showing a 10- to 20- fold increase in prostate cancer cells compared to the RWPE1 (Figure 2B & 2C).
Figure 2.
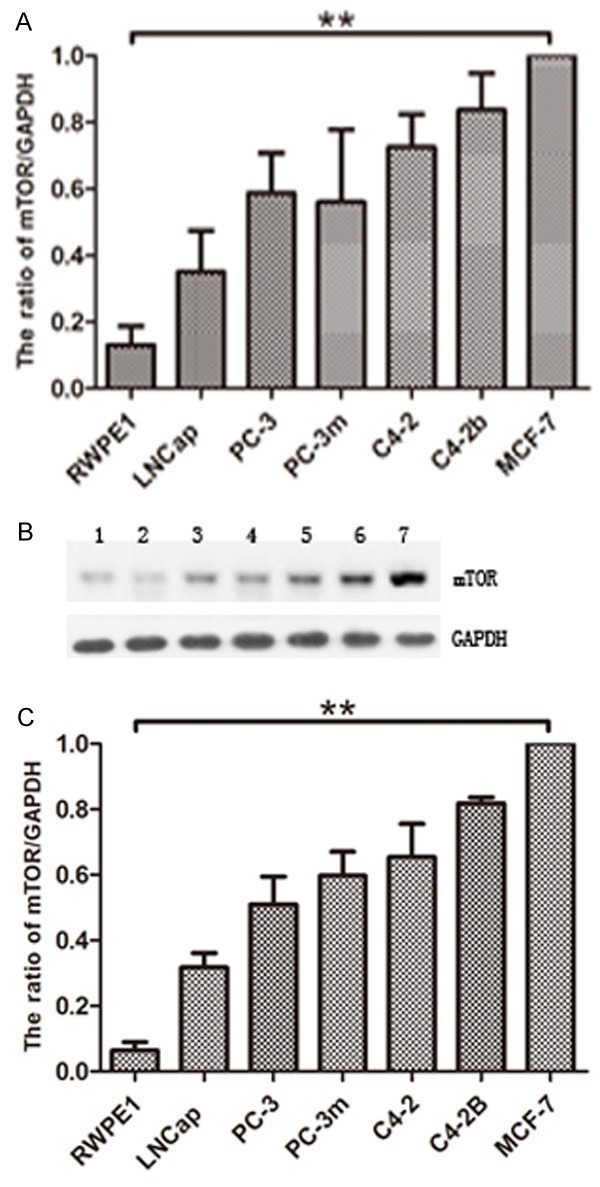
mTOR is over-expressed in prostate cancer cells compared to normal prostate cells. mTOR mRNA and protein levels in prostate cancer cells versus RWPE1. Quantitative real time RT-PCR (A) and Western blot analysis (B & C) of endogenous mTOR expression was performed using normal RWPE1 and five prostate cancer cell lines LNCap, PC-3, PC-3m, C4-2 and C4-2B. MCF-7 is loaded as positive control. For RT-PCR, mTOR mRNA levels were quantitated relative to GAPDH mRNA and calculated using the ΔΔCt method. (B) Western blot analysis of the mTOR and GAPDH. 1: RWPE1; 2: LNCap; 3: PC-3; 4: PC-3m; 5: C4-2; 6: C4-2B; 7: MCF-7. (C) The protein levels were quantitated by a densitometric analysis of protein bands. The data (relative density normalized to GAPDH) is expressed as mean ± standard deviation of three experiments (**p<0.01) .
Effective RNAi of mTOR by lentiviral transduction of shRNA-expressing vector
Next, we determined the effects of mTOR inhibition on the viability and growth of prostate cancer cells. The resulting mTOR shRNA-expressing lentivirus (LV-shmTOR) (together with vector-derived lentivirus as control, LV-shCON) was used to infect LNCap, PC-3, PC-3m, C4-2 and C4-2b cells. The lentiviral expression vector also contains an RFP expressing cassette so that successfully transduced cells are red under fluorescence microscopy (Figure 3A). Essentially every cell is transduced based on the expression of RFP viewed under fluorescence microscope. Real time PCR analysis revealed robust knockdown of mTOR in all the cancer cells (Figure 3B). These results suggest that we have achieved effective kno-ckdown of mTOR in the cancer cells.
Figure 3.
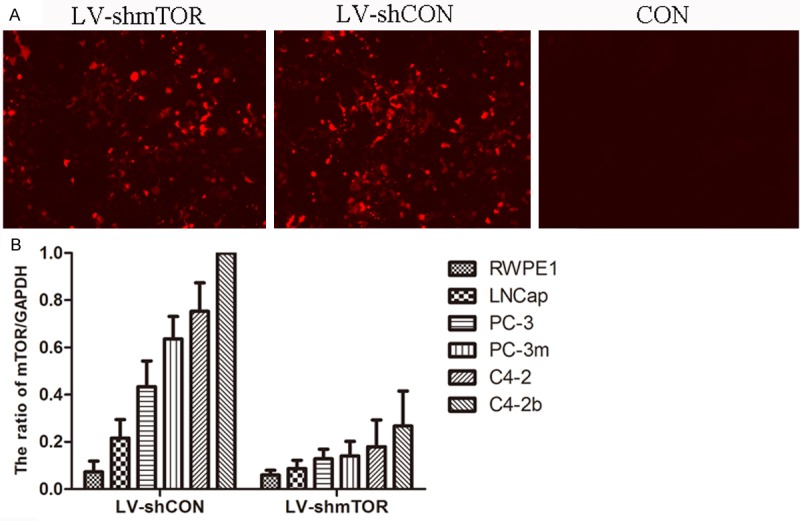
Knockdown of mTOR by lentivirus mediated shRNA. A: Plates were examined under a fluorescence microscope at × 100 magnification; B: mTOR mRNA levels were evaluated following lentiviral transduction via mTOR shRNA and control shRNA treatments, respectively. The data (relative density normalized to GAPDH) is expressed as mean ± standard deviation of three experiments.
We also evaluated the effects of mTOR inhibition on cell proliferation using MTT assay using RWPE1, LNCap and C4-2b cells. As shown in Figure 4A, we found that genetic knockdown of mTOR caused a significant decrease in proliferation of all prostate cancer cell lines tested. Finally, we evaluated the effects of mTOR inhibition on colony formation ability of C4-2b prostate cancer cells. Our data demonstrated that genetic knockdown resulted in a drastic reduction in the clonogenic survival of prostate cancer cells (Figure 4B).
Figure 4.
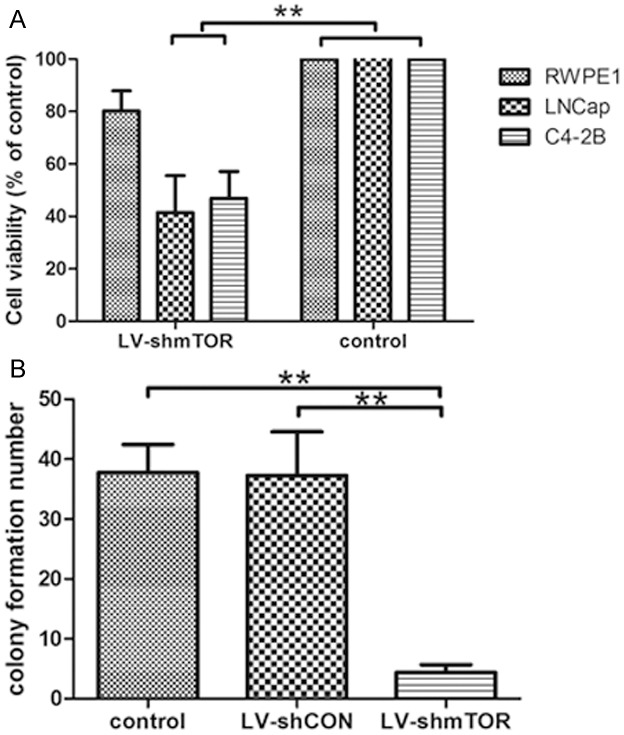
mTOR inhibition causes a decrease in prostate cancer cell proliferation and colony formation. A: Effect of mTOR inhibition on cell proliferation - MTT analysis. Following lentiviral transduction via mTOR shRNA, MTT analysis was performed, OD570 nm was determined to assess the effect of mTOR inhibition on prostate cancer cell growth. The data is expressed as percent proliferation and normalized to control, mean ± standard deviation of three experiments with similar results (**p<0.01). B: Effect of mTOR inhibition on colony formation. Following lentiviral transduction via mTOR shRNA, prostate cancer cells were allowed to grow for 2 weeks with media changes every 3 days with no further treatment. Colonies were stained with crystal violet, counted and the data is shown as percent colony formation (normalized to control). The data represents mean ± standard deviation of three experiments with similar results (**p<0.01).
The changes of proteins after downregulation of mTOR
To investigate a role for mTOR in regulation of mTOR signaling, we compared the abilities of wild-type and mTOR shRNA to mediate the states of AKT, PI3K, S6K, 4EBP1 and PARP, the well-characterized mTOR pathway key proteins. In mTOR shRNA-transduced C4-2b cells, AKT, PI3K, S6K and 4EBP1 was downregulated significantly and increased cleavage of the PARP compared with the mock-transduced cells (Figure 5).
Figure 5.
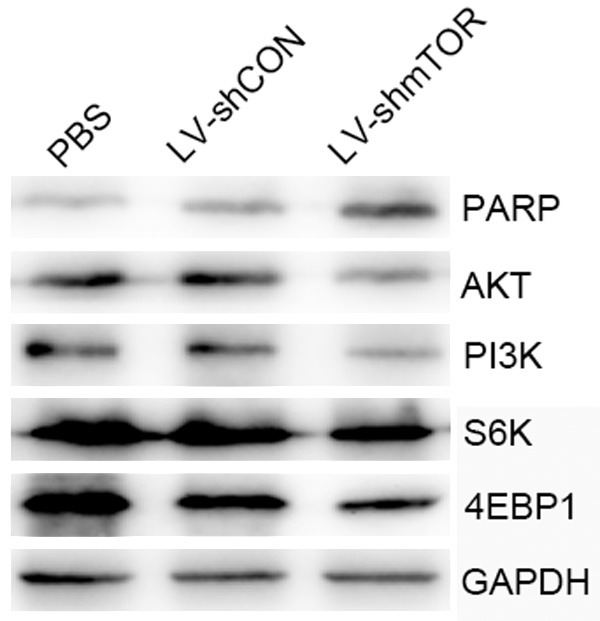
Restoration of PI3K/AKT signaling in C4-2b cells on mTOR knockdown. Western blot analysis was performed using AKT, PI3K, S6K, 4EBP1 and PARP specific antibodies in control, LV-shCON and LV-shmTOR infected C4-2b cells
LV-shmTOR significantly inhibit the growth of human PCa cells in vivo
To investigate the effect of LV-shmTOR on cell growth in vivo, C4-2b cells were subcutaneously xenografted in nude mice. The LV-shmTOR group demonstrated a significant reduction in tumor volume compared with the LV-shCON and PBS groups (P<0.05). Mice treated with the LV-shmTOR was significantly smaller than the control (P<0.05), demonstrating higher suppression on tumor growth in vivo (Figure 6A).
Figure 6.

Tumor growth and cell apoptosis detection in vivo. A: C4-2b tumors were established subcutaneously in mice. When the tumors reached approximately 50 mm3 in volume, the mice were randomly assigned to LV-shmTOR, LV-shCON or PBS groups and treated as described in the methods section. The sizes (measured in mm3) of the tumors were monitored and recorded. A significant difference in tumor volume from the control is denoted by “*” (P<0.05). B: Analysis of apoptotic status of tumor cells by in situ TUNEL assay. C: TUNEL-positive cells were also counted under microscope to calculate the apoptotic index, respectively. “*”: P<0.05, compared with control.
Cell apoptosis were further examined in situ in tumor samples from the three groups by TUNEL method. As shown in Figure 6B and 6C, LV-shmTOR treated groups had up-regulated expression of TUNEL compared to control group (P<0.05). LV-shmTOR produced significantly higher apoptosis than LV-shCON or PBS control group (P<0.05).
Discussion
In the present study, we demonstrated that: (1) mTOR is over-expressed in both clinical tissue specimens and cultured human prostate cancer cells, (2) mTOR gene knockdown via lentivirus mediated mTOR specific shRNA resulted in a significant decrease in the viability and growth of prostate cancer cells, (3) mTOR inhibition resulted in a significant decrease in 4EBP1, S6K, PI3K, AKT protein and increase in PARP protein of prostate cancer cells. To our knowledge, this is the first report to show that mTOR signaling is implicated in treatment of prostate cancer.
Several approaches to therapy for prostate cancer are currently in clinical development. Some result marked the first time that treatment with a cancer ‘vaccine’ resulted in a survival benefit in a metastatic solid tumor, and was, thus, critically important for cancer therapy. In some cases existing treatments for early prostate cancer fail, leading to advanced stage therapy method for treating prostate cancer. Since prostate cancer is commonly a relatively slow-growing disease, it may be necessary to use gene therapy approaches, with single gene or gene knockdown, over the lifespan of the patient. The mTOR pathway may be of particular relevance to prostate cancer.
mTOR is a highly conserved serine/threonine kinase that regulates cell growth and metabolism in response to environmental factors. It is activated downstream of the PI3-K/AKT pathway and executes its biologic functions as two distinct complexes, mTORC1 and mTORC2, that differ in their subunit composition and sensitivity to rapamycin. mTORC1 consists of a complex that includes mTOR and a protein known as Raptor (regulatory associated protein of mTOR), whereas mTORC2 consists of a complex that includes mTOR and a protein known as Rictor (rapamycin-insensitive companion of mTOR) [8,15]. There are also mTORC2 complexes that can be distinguished by association with different isoforms of mSin1. mTOR, mLST8/GβL and the negative regulator adaptor are shared by both complexes [16]. The mTOR pathway is most typically activated downstream of the PI3K/AKT pathway in response to growth factors signaling. mTOR acts through its downstream effectors, the S6K and the eukaryotic elongation factor 4EBP1, to regulate cell growth and proliferation in response to growth factors (i.e., IGF), nutrients (amino acids in particular), energy level and environmental stress (e.g., hypoxia, DNA damage and reducing conditions) [3]. The activation of S6K by mTOR is critical for ribosomal biogenesis [17], cell growth, anti-apoptosis and translation of the structured 5’ untranslated region (UTR) containing mRNA species, while the phosphorylation (and inactivation) of 4EBP1 promotes cap-dependent translation. It is possible that attenuation of the translation of critical mTOR gene products may be an important aspect of this effect.
Acknowledgements
This work was supported by the following: National Science Foundation of China (grant number: 30901500/H1619; URL: http://www.nsfc.gov.cn); Science and Technology Program of Shaan-Xi Province (grant number: 2009JQ4002; URL: http://www.sninfo.gov.cn); The funders had no role in study design, data collection and analysis, decision to publish, or preparation of the manuscript.
Disclosure of conflict of interest
None.
References
- 1.Siegel R, Naishadham D, Jemal A. Cancer statistics, 2012. CA Cancer J Clin. 2012;62:10–29. doi: 10.3322/caac.20138. [DOI] [PubMed] [Google Scholar]
- 2.Siegel R, DeSantis C, Virgo K, Stein K, Mariotto A, Smith T, Cooper D, Gansler T, Lerro C, Fedewa S, Lin C, Leach C, Cannady RS, Cho H, Scoppa S, Hachey M, Kirch R, Jemal A, Ward E. Cancer treatment and survivorship statistics, 2012. CA Cancer J Clin. 2012;62:220–241. doi: 10.3322/caac.21149. [DOI] [PubMed] [Google Scholar]
- 3.Wullschleger S, Loewith R, Hall MN. TOR signaling in growth and metabolism. Cell. 2006;124:471–484. doi: 10.1016/j.cell.2006.01.016. [DOI] [PubMed] [Google Scholar]
- 4.Yang Q, Guan KL. Expanding mTOR signaling. Cell Res. 2007;17:666–681. doi: 10.1038/cr.2007.64. [DOI] [PubMed] [Google Scholar]
- 5.Loewith R, Jacinto E, Wullschleger S, Lorberg A, Crespo JL, Bonenfant D, Oppliger W, Jenoe P, Hall MN. Two TOR complexes, only one of which is rapamycin sensitive, have distinct roles in cell growth control. Mol Cell. 2002;10:457–468. doi: 10.1016/s1097-2765(02)00636-6. [DOI] [PubMed] [Google Scholar]
- 6.Efeyan A, Sabatini DM. mTOR and cancer: many loops in one pathway. Curr Opin Cell Biol. 2010;22:169–176. doi: 10.1016/j.ceb.2009.10.007. [DOI] [PMC free article] [PubMed] [Google Scholar]
- 7.Zoncu R, Efeyan A, Sabatini DM. mTOR: from growth signal integration to cancer, diabetes and ageing. Nat Rev Mol Cell Biol. 2011;12:21–35. doi: 10.1038/nrm3025. [DOI] [PMC free article] [PubMed] [Google Scholar]
- 8.Guertin DA, Sabatini DM. Defining the role of mTOR in cancer. Cancer Cell. 2007;12:9–22. doi: 10.1016/j.ccr.2007.05.008. [DOI] [PubMed] [Google Scholar]
- 9.Sabatini DM. mTOR and cancer: insights into a complex relationship. Nat Rev Cancer. 2006;6:729–734. doi: 10.1038/nrc1974. [DOI] [PubMed] [Google Scholar]
- 10.Corradetti MN, Guan KL. Upstream of the mammalian target of rapamycin: do all roads pass through mTOR? Oncogene. 2006;25:6347–6360. doi: 10.1038/sj.onc.1209885. [DOI] [PubMed] [Google Scholar]
- 11.Nguyen DG, Yin H, Zhou Y, Wolff KC, Kuhen KL, Caldwell JS. Identification of novel therapeutic targets for HIV infection through functional genomic cDNA screening. Virology. 2007;362:16–25. doi: 10.1016/j.virol.2006.11.036. [DOI] [PubMed] [Google Scholar]
- 12.Elbashir SM, Harborth J, Lendeckel W, Yalcin A, Weber K, Tuschl T. Duplexes of 21-nucleotide RNAs mediate RNA interference in cultured mammalian cells. Nature. 2001;411:494–498. doi: 10.1038/35078107. [DOI] [PubMed] [Google Scholar]
- 13.Tiscornia G, Singer O, Ikawa M, Verma IM. A general method for gene knockdown in mice by using lentiviral vectors expressing small interfering RNA. Proc Natl Acad Sci U S A. 2003;100:1844–1848. doi: 10.1073/pnas.0437912100. [DOI] [PMC free article] [PubMed] [Google Scholar]
- 14.Bos TJ, De Bruyne E, Heirman C, Vanderkerken K. In search of the most suitable lentiviral shRNA system. Curr Gene Ther. 2009;9:192–211. doi: 10.2174/156652309788488578. [DOI] [PubMed] [Google Scholar]
- 15.Guertin DA, Sabatini DM. An expanding role for mTOR in cancer. Trends Mol Med. 2005;11:353–361. doi: 10.1016/j.molmed.2005.06.007. [DOI] [PubMed] [Google Scholar]
- 16.Voss MH, Molina AM, Motzer RJ. mTOR inhibitors in advanced renal cell carcinoma. Hematol Oncol Clin North Am. 2011;25:835–852. doi: 10.1016/j.hoc.2011.04.008. [DOI] [PMC free article] [PubMed] [Google Scholar]
- 17.Jastrzebski K, Hannan KM, Tchoubrieva EB, Hannan RD, Pearson RB. Coordinate regulation of ribosome biogenesis and function by the ribosomal protein S6 kinase, a key mediator of mTOR function. Growth Factors. 2007;25:209–226. doi: 10.1080/08977190701779101. [DOI] [PubMed] [Google Scholar]


